Peptide Biomarker Discovery for Rapid
Identification of Methicillin-resistant and
Vancomycin-intermediate Staphylococcus
aureus Strains by MALDI-TOF
Jang-Jih Lu1,2, Fuu-Jen Tsai3,4,Cheng-Mao Ho2,5, Yu-Ching Liu6, and Chao-Jung Chen6,7*
1Department of Laboratory Medicine, Chang-Gung Memorial Hospital, Linkou,
Taoyuan, 33305, Taiwan
2Graduate Institute of Clinical Medical Science, China Medical University, Taichung,
40402, Taiwan
3Department of Medical Genetics, Pediatrics and Medical Research, China Medical
University Hospital, Taichung, 40402, Taiwan
4College of Chinese Medicine, China Medical University, Taichung, 40402, Taiwan
5Department of Laboratory Medicine, China Medical University Hospital, Taichung,
40402, Taiwan
6Proteomics Core Laboratory, Department of Medical Research, China Medical
1 2 3 4 5 6 7 8 9 10 11 12 13 14 15 16
University Hospital, Taichung, 40402, Taiwan
7Graduate institute of integrated medicine, China Medical University, Taichung,
40402, Taiwan
Keywords: Peptide biomarker, Community associated methicillin-resistant
Staphylococcus aureus (CA-MRSA), Hospital associated methicillin-resistant Staphylococcus aureus (HA-MRSA), Vancomycin-intermediate Staphylococcus aureus (VISA), heterogeneous vancomycin-intermediate S. aureus (hVISA),
Matrix-assisted laser desorption/ionization time-of-flight mass spectrometry (MALDI-TOF
MS) 1 2 3 4 5 6 7 8 9
Abstract
Rapid identification of community associated (CA) methicillin-resistant
Staphylococcus aureus (MRSA), hospital associated (HA) MRSA, and
vancomycin-intermediate S. aureus (VISA) is essential for proper therapy and timely intervention
of outbreaks. In this study, peptide biomarkers for rapid identification of
methicillin-resistant and vancomycin-intermediate staphylococcus aureus Strains were
discovered by matrix-assisted laser desorption/ionization time-of-flight mass
spectrometry (MALDI-TOF MS). Results showed that the 1774.1 m/z and 1792.1 m/z
peaks corresponding to the phenol-soluble modulin alpha 1 peptide (PSMα1) and
PSMα2, respectively were present in the majority (95%; 121/127) of SCCmec types
IV and V isolates, but only in 8% (15/185) of SCCmec types I, II, and III isolates.
Since SCCmec types I, II, and III isolates are recognized as HA-MRSA and most
CA-MRSA isolates belongs to SCCmec types IV and V isolates are recognized as
CA-MRSA, these two peptides may serve as markers for discrimination between
HA-MRSA and CA-HA-MRSA isolates. The 1835.0 m/z and 1863.0 m/z peaks were present
in 50% (4/8) of hVISA and 88% (14/16) of VISA isolates. The peptides of these two
peaks were identified as proteolytic products of the acyl carrier protein. Results of this
study provide the possibility to develop methods for identification of CA-MRSA,
HA-MRSA, and vancomycin resistant S. aureus isolates based on the presence of these
peptides. 1 2 3 4 5 6 7 8 9 10 11 12 13 14 15 16 17 18 19 20
Introduction
Staphylococcus aureus, a Gram-positive opportunistic human pathogen can
cause severe infections in cardiovascular, osteoarticular, and respiratory systems as
well as in the skin and soft tissue. S. aureus is one of the most common and important
pathogens in both community-associated and hospital-associated infections.1 Several
evolutions of S. aureus have occurred since the introduction of antibiotics in the
1940s, including the development of resistance to penicillin, methicillin, and
vancomycin and the appearance of community-acquired methicillin-resistant S.
aureus (MRSA).2 Since the first discovery in the 1960s, the incidence of MRSA
nosocomial infection has been increasing,3 and community-associated MRSA
(CA-MRSA) are emerging pathogens since 1990s, which could cause various clinical
infectious diseases, like strains are now a major cause of skin and soft tissue
infections, pneumonia, osteomyelitis or arthritis et cetera. [Nat Rev Microbiol, 2009.
7(9): p. 629-41 & Clin Infect Dis. 2001;33:990-6]. Because the frequent use of
glycopeptide antibiotics for treatment of MRSA infections, S. aureus strains with
different levels of resistance to vancomycin, such as heterogeneous
vancomycin-intermediate S. aureus (hVISA) and vancomycin-resistant S. aureus (VRSA), have
emerged within the past 10 years.4
1 2 3 4 5 6 7 8 9 10 11 12 13 14 15 16 17 18 19
According to the current criteria of the Clinical and Laboratory Standards
Institute (CLSI), S. aureus strains exhibiting a minimum inhibitory concentration
(MIC) >2 but <4 mg/l of vancomycin and displaying populations of both resistant and
susceptible colonies are termed hVISA. VISA strains are defined as having an MIC
(minimal inhibitory concentration) of 4–8 ug/ml mg/l. For VRSA strains, their MIC is
greater than 16 ug/ml or more. mg/l.5 The definition of hVISA are S. aureus isolates
with vancomycin MIC within susceptible range by standard dilution antimicrobial susceptibility tests but there are subpopulations ( 10≦ -6) with higher vancomycin MIC
(> 2 ug/ml) [Clin Infect Dis, 2007. 44(9): p. 1208-15].
Rapid discrimination between vancomycin-resistant no susceptible and
vancomycin susceptible MRSA methicillin-sensitive S. aureus is important for proper
antimicrobial therapy of the infection and infection control intervention of cross
infections. However, identification and determination of antimicrobial susceptibility
tests of S. aureus isolates are time-consuming and laborious. Although the mecA PCR
method could rapidly detect MRSA, the mecA gene is also present in some most
coagulase-negative staphylococci and methicillin-sensitive S. aureus isolates.6
Recently, a method for identification of bacteria in a mixed flora based on
bacterial protein patterns using matrix-assisted laser desorption ionization/time of
flight-mass spectrometry (MALDI/TOF-MS) was developed.7 Furthermore, a MALDI
1 2 3 4 5 6 7 8 9 10 11 12 13 14 15 16 17 18 19
protein-profiling database (BioTyper) has become commercially available (Bruker
Daltonics, Germany).8,9 Based on the analyses of 1660 bacterial isolates, this database
was shown to have an identification rate of 95.4%.8
Although the commercialized MALDI protein-profiling database could be used
for identification of bacterial species, the extension of its applications into detection
of antimicrobial resistance is rarely motioned. it may not be able to identify bacteria
that are resistant to multiple antibiotics. The aim of this study was to identify potential
biomarkers for rapid identification of CA-MRSA, HA-MRSA, and vancomycin
resistant S. aureus isolates by MALDI-TOF.
Materials and Methods
S. aureus isolates
Bacteria isolates used in this study included the 99 MRSA isolates from the 2003 SMART study,10 96 MRSA isolates from previous study [Eur J Clin Microbiol Infect
Dis, 2012. 31(4): p. 499-504], and newly collected 109 methicillin-sensitive S. aureus (MSSA), and 213 MRSA isolates collected from different patients during the period of July, 2008 to March, 2011. Identification of S. aureus isolates and determination of
their antibiotic susceptibility were achieved by using the BD Phoenix™ Automated
Microbiology System (Becton Dickinson). Eight hVISA and sixteen VISA isolates
were from previous studies.10,11
1 2 3 4 5 6 7 8 9 10 11 12 13 14 15 16 17 18 19 20
Detection of SCCmec
The identification of SCCmec types were performed by multiplex PCR using the
genomic DNA from each MRSA isolate as the template as described previously.12
Fourteen primers were used for the multiplex PCR: 2 for the mecA gene, 4 for the four
classes of the mec gene complex (classes A to D), and 8 for the five types of the
cassette chromosome recombinase (ccr) gene complex (ccr types 1 to 5). The
amplification was carried out by first heating the reaction for 2 min at 94°C to
denature the template DNA, followed by 30 cycles of 2 min at 94°C for denaturation,
1 min at 60° for annealing, and 2 min at 72°C for extension, and then 2 min at 72°C
for the final extension. The amplified products were analyzed by agarose gel
electrophoresis. The reference strains for SCCmec types I, II, III, IV, V, and VT were
NCTC10442, N315, 85/2082, IVa, WIS, and TSGH17, respectively.12,13 HA-MRSA
was defined as an MRSA harboring SCCmec type I, II, or III, and CA-MRSA isolates
were of SCCmec type IV, V or VT.4,14 All isolates were subcultured on brain heart
infusion agar (BHI; Becton Dickinson) prior to MALDI-TOF analysis.
MALDI-TOF MS analysis
MS profiling spectra were performed on an Ultraflex III TOF/TOF machine
(Bruker) equipped with a smartbeam laser. All samples were assayed in duplicate. For
sample preparation, one S. aureus colony was suspended in 500 μl of 70% ethanol, 1 2 3 4 5 6 7 8 9 10 11 12 13 14 15 16 17 18 19
followed by centrifugation for 3 min at 12,000xg. The supernatant was discarded.
Fifty μl of 2.5% or 70% formic acid (FA) (LC-MS grade, Sigma Aldrich, MO, USA)
and 50 μl of pure acetonitrile (ACN) (LC-MS grade, JT-Baker, Mallinckrodt Baker,
Inc) were added to the pellet. After vortex, the sample was centrifuged for 3 min at
12,000xg, and 0.5 μl of the supernatant was transferred onto a MALDI plate (Bruker)
and allowed to air-dry. A 0.5 μl aliquot of the α-cyano-4-hydroxycinnamic acid
(CHCA) matrix solution (1mg/ml, 50% ACN/0.1% trifluoroacetic acid) was overlaid
on the sample spot and then air dried. The mass spectra were acquired in the mass
range of 1000 to 4000 m/z in reflector mode and 1000 to 10000 m/z in linear mode.
Each spectrum was obtained after 600 shots in an automatic acquisition mode.
Identification of peptide corresponding to a certain m/z peak was achieved by
MS/MS. The metastable fragmentation of the selected precursor ion was generated by
laser-induced decomposition in the TOF/TOF (LIFTTM) mode. The low accelerating
voltage of 8 kV was first used to provide the long flight time where fragmentation
occurs. The selected precursor ion and the corresponding fragment ions were selected
by a time gate which consists of consecutive electrodes and produces electric filed to
deflect unselected ions. After the isolation, the precursor ion and its fragmented ions
were post-accelerated by the high voltage of 19 kV, and their masses were analyzed in
one spectrum.15 The precursor mass window was set at ±0.45%. A MS/MS spectrum
1 2 3 4 5 6 7 8 9 10 11 12 13 14 15 16 17 18 19
was accumulated from 1500 - 2500 laser shots. Each MS/MS spectrum was processed
by FlexAnalysis 3.0 software (Bruker) to produce a mass list of ions. Peptide
identification was accomplished by the input of a mass list in the Mascot 2.2 server
(Matrix Science, London) and searching it against the NCBInr database (version
20101220) with the following parameters: taxonomy-bacteria; enzyme–no enzyme;
variable modifications–oxidation (M) and dimethylation (R). The mass tolerance was
set at ±100 ppm for MS and ±0.5 Da for MS/MS.
Statistical data analysis
Statistical analyses of the MS profiling spectra from CA-MRSA and HA-MRSA
isolates were performed with the ClinPro ToolsTM software (Bruker). All spectra are
normalized to their own total ion count (TIC). The MS data from CA-MRSA and
HA-MRSA isolates were presented in a 2-D cluster plot. The receiver operating
characteristic (ROC) curve was constructed to determine the sensitivity and
specificity of a potential biomarker.
Results
Optimization of analytical methods
To optimize the methods for generation of specific ion profiles, three standard S.
aureus strains ATCC29213 (MSSA), N315 (MRSA), and Mu50 (VISA) were tested.
As shown in Fig.1a, the most intense peaks appeared in the range between 3000 m/z 1 2 3 4 5 6 7 8 9 10 11 12 13 14 15 16 17 18 19 20
and 10000 m/z. Since different ion patterns were observed in the range of 1500 m/z to
4000m/z, the reflector mode was adopted. Fig. 1b shows the MS profiles of the three
standard S. aureus strains extracted with 70% formic acid (FA). In an attempt to
improve MS signals, samples extracted with 2.5% FA were also tested, and a much
better profile was obtained from each sample (Fig. 2a). However, no significant peaks
were seen above 4000 m/z for MSSA (29213) and VISA (Mu50) strains (Fig. 2b),
suggesting that 2.5% FA was more suitable for extraction of peptides than for proteins
with a mass greater than 4000 m/z.
To investigate whether culture media affect the profiling, the MALDI ion
profiles of the three strains grown on BAP (Blood agar plate) agar (Fig. 2c) were
compared to those of the bacteria grown on BHI agar (Fig. 2a). The signal strengths
of the BAP cultures were found to be weaker. Therefore, BHI agar was used for
bacterial subcultures and 2.5% FA solution with equal volume of pure ACN was used
for extraction of bacterial peptides. The mass range between 1000 m/z and 4000 m/z
in reflector mode was analyzed throughout the study.
Potential peptide markers for discrimination between CA-MRSA and HA-MRSA strains
With the analytical conditions optimized, the possibility to distinguish between
HA-MRSA and CA-MRSA with MALDI-TOF was evaluated. Fig. 3 shows the ion 1 2 3 4 5 6 7 8 9 10 11 12 13 14 15 16 17 18 19
profiles of one MSSA and five MRSA strains (SCCmec I-V types) in range of 1000
m/z to 4000 m/z. The MSSA strain had a unique pattern with a major peak at 2305.3
m/z. SCCmec I, II, and III MRSA isolates had similar ion profiles with a predominant
peak at 2290.1 m/z, and SCCmec IV and V MRSA isolates had similar ion profiles
with a predominant peak at 1792.1 m/z.
A large number of MSSA (109) and MRSA (312) isolates including the control
strains of ATCC29213 (MSSA), N315 (SCCmec II), IVa (SCCmec IV), and WIS
(SCCmec V) were then examined. Because SCCmec I MRSA isolates were rare, only
one isolate (no. 10442) was analyzed. When MS spectra from the SCCmec IV and V
isolates (127 isolates) and the SCCmec II and III isolates (185 isolates) were graphed
as columns according to the number of isolates and signal intensity of MS peaks, the
very intense signals of 1774.1 and 1792.1 m/z peaks were seen only in SCCmec IV
and V MRSA isolates (Fig. 4a). When the two peaks of 1774.1 m/z and 1792.1 m/z
were used to discriminate the isolates, MRSA isolates could be separated into two
groups in a two-dimensional cluster plot (Fig. 4b): one consisted of SCCmec IV and
V isolates (represented by X) distributed in the high intensity range of the two peaks,
and the other group consisted of SCCmec II and III isolates (represented by O)
distributed in the zero or minor signal intensity range of the two peaks.
ROC curves of the 1774.1 m/z and 1792.1 m/z peaks are shown in Fig. 4c and 1 2 3 4 5 6 7 8 9 10 11 12 13 14 15 16 17 18 19
4d, respectively. The area under the ROC plot was 0.968 for the 1774.1 m/z peak, and
0.973 for the 1792.1 m/z peak. Most SCCmec IV and V MRSA isolates were
recognized as CA-MRSA, and most SCCmec I, II and III isolates were recognized as
HA-MRSA.14,16
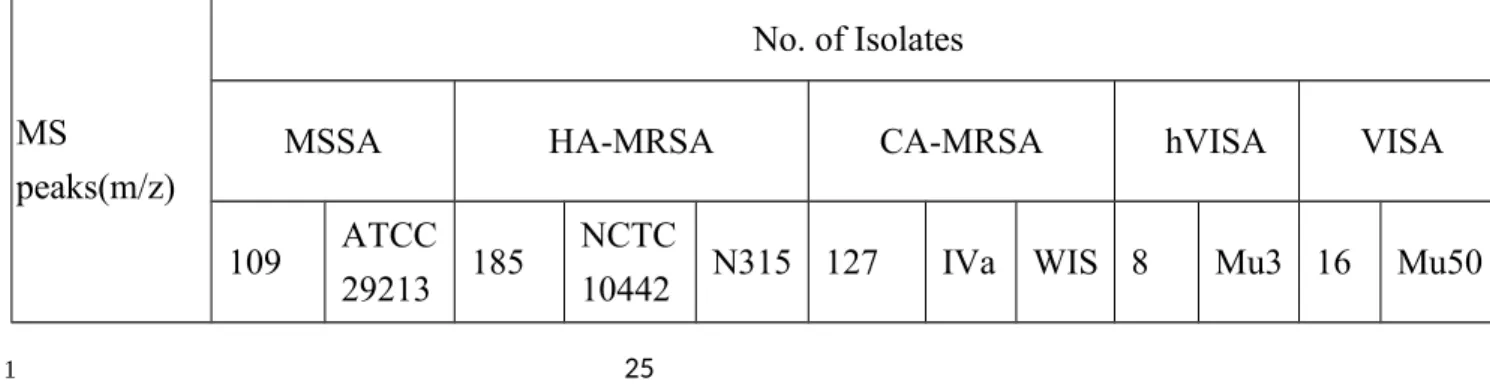
Table 1 shows the total number of MSSA, CA-MRSA, HA-MRSA, hVISA, and
VISA isolates analyzed in this study. Of the 185 HA-MRSA isolates, only 15 had
both 1774.1 m/z and 1792.1 m/z peaks, whereas 121 of 127 CA-MRSA isolates had
these two peaks. The sensitivity and specificity for the use of 1774.1 m/z and 1792.1
m/z peaks to detect CA-MRSA strains in MRSA strains were 95.2% (121/127) and
91.8% (170/185), respectively. Therefore, these two peaks could be used as markers
to discriminate between CA-MRSA and HA-MRSA isolates.
The peptides of the 1774.1 m/z and 1792.1 m/z peaks were then identified by
MALDI-TOF/TOF. Fig. 5a shows the peptide fragment ion spectra of the 1774.1 m/z
peptide. The ion spectra was searched against the NCBInr database and identified as
the phenol-soluble modulin α1Δ1-5 (PSMα1Δ1-5) peptide fragment with the
sequence of GIIKVIKSLIEQFTGK (theoretical m/z: 1774.083), which is the
sequence of a proteolytically processed peptide of PSMα1
(MGIIAGIIKVIKSLIEQFTGK). Fig. 5b shows the ion spectra of the 1792.1 m/z
peptide. The sequence of the peptide was determined to be GIIKFIKGLIEKFTGK 1 2 3 4 5 6 7 8 9 10 11 12 13 14 15 16 17 18 19
(PSMα2Δ1-5, theoretical m/z: 1792.109) which is the sequence of a proteolytically
processed peptide of PSMα2 (MGII AGIIKFIKGLIEKFTGK.17
Potential peptide markers for identification of hVISA and VISA
A total of 16 VISA (Mu50 strain included) and 8 hVISA (Mu3 strain included)
isolates were analyzed by MALDI-TOF. The MALDI ion profiles of Mu50 (VISA,
MIC of vancomycin = 8 mg/l) and Mu3 (hVISA, MIC of vancomycin = 3 mg/l) were
shown in Fig. 2a and Fig. 6, respectively. Both ion profiles were similar and had
intense peaks at 1835.0 m/z and 1863.0 m/z. These two peaks appeared in 88%
(14/16) of VISA isolates and 50% (4/8) of hVISA isolates. However, these two peaks
were also detected with weaker signals in 16% (30/185) of HA-MRSA, 20% (26/127)
of CA-MRSA, and 10% (11/109) of MSSA isolates (Table 1). The sequences of these
two peptide fragments were determined to be MENFDKVKDIIVDRL (theoretical
m/z: 1834.973) and MENFDKVKDIIVDR(dimethyl)L (theoretical m/z: 1863.004),
respectively (Fig. S-1) and were found to be a proteolytically processed form of the
acyl carrier protein (ACP).
Discussion
Many studies have shown that bacterial species can be identified based on their
unique protein profiles.7-9, 18-25 Direct analysis of bacterial cells from an agar plate by
MALDI-TOF can be a rapid method for identification. However, this approach may 1 2 3 4 5 6 7 8 9 10 11 12 13 14 15 16 17 18 19 20
result in numerous MS peaks making the bacterial profile very difficult to interpret.
Therefore, we first optimized the sample preparation methods and found that washing
the cells with 70% ethanol prior to extraction of proteins greatly reduced the
MALDI-TOF noise signals. We also found that extraction of bacterial cells with 70% FA
followed by the addition of equal volume of pure ACN resulted in excellent protein
ion profiling (Fig. 1). For peptide ion profiling, extraction with 2.5% FA followed by
the addition of equal volume of pure ACN produced the best results (Fig. 2). The
growth media were also found to affect the efficiency of MALDI-TOF as bacteria
grown on BHI agar plates produced higher peptide peaks than those grown on BAP
agar plates (Fig. 2a versus Fig 2c). This could be attributed to the higher nutrition
components in BHI agar and thus better growth of S. aureus in this medium. In
addition, the use of the reflector mode in MALDI-TOF analysis can provide better
peak resolution and accuracy than the linear mode.
Similar to the study of Bernardo et al.26, we were unable to distinguish between
MSSA and MRSA isolates by MALDI-TOF protein profiling. Since MSSA isolates is
always susceptible to antibiotics for treatment of MRSA infections, e.g. glycopeptides, and there are rapid or well established clinical microbiological methods for MRSA detection, the necessity for differentiation between MSSA and MRSA by MALDI-TOF is not imperative. However, we found that the ion profiles of 1 2 3 4 5 6 7 8 9 10 11 12 13 14 15 16 17 18 19
SCCmec I-III MRSA isolates were different from those of SCCmec IV-V MRSA
isolates in the range of 1000 - 4000 m/z. Specifically, the 1774.1 m/z and 1792.1 m/z
peaks were found in the majority (95%; 121/127) of SCCmec IV-V isolates, but only
in 8% (15/185) of SCCmec I-III isolates. Since SCCmec I-III types are recognized as
HA-MRSA and most CA-MRSA isolates belong to SCCmec type IV and V types are
recognized as CA-MRSA strains, the peptides of these two peaks could be used as
markers to distinguish these two types of MRSA strains. This finding is important
clinically because no rapid or standard clinical microbiological methods is available for the differentiation between MRSA isolates harbor SCCmec I, II and III from IV and V. Separation of these two groups by rapid method is meaningful clinically because of CA-MRSA strains could harbor various toxin genes or virulence determinants, compared to HA-MRSA isolates [Nat Rev Microbiol, 2009. 7(9): p. 629-41 & Nat Med, 2007. 13(12): p. 1510-4.]. These two peptides were identified as
PSMα1Δ1-5 and PSMα2Δ1-5, respectively. The sequence and function of the PSM α
family peptides in S. aureus were recently determined by Wang et al.17 PSM α
peptides can recruit, activate, and lyse human neutrophils, thereby increasing the
virulence of S. aureus.
Although the PSM genes are present in all S. aureus strains that have been
sequenced, the formylated-PSM α family peptide was found to be produced in higher 1 2 3 4 5 6 7 8 9 10 11 12 13 14 15 16 17 18 19
levels in vitro by CA-MRSA than by HA-MRSA strains. In our study, we found that
discrimination between CA-MRSA and HA-MRSA based on the levels of the PSM α
family peptide could not be achieved because formylated-PSM α1 (observed m/z:
2287.3; theoretical m/z: 2287.346) and formylated-PSM α2 (observed m/z: 2305.3;
theoretical m/z: 2305.372) were also found in high levels in 49% (91/185) of
HA-MRSA isolates.
S. aureus strains with reduced susceptibility to vancomycin was first reported in
Japan in 1996.27 Cell wall thickening, reduced pigmentation, smaller colony size, and
reduced autolytic activity are some of the characteristics of hVISA or VISA.
Transcriptional changes or mutations of certain genes, such as VraSR, GraRS, and
agr, have been correlated with vancomycin resistance.28 Decreased production of
surface protein A or increased expression of SAV2095 (SceD-like protein) are also
associated with hVISA or VISA.29 Since identification of VISA or hVISA by
conventional methods is very labor intensive with a high rate of inconsistency
between various commercial methods and the standard dilution method,30,31
biomarkers for rapid detection of hVISA or VISA isolates are urgently needed.
We found that the 1835.0 m/z and 1863.0 m/z peaks appeared in 88% (14/16) of
VISA and 50% (4/8) of hVISA isolates (Table 1). Therefore, the peptide of these two
peaks may serve as a marker for identification of these isolates. However, these two 1 2 3 4 5 6 7 8 9 10 11 12 13 14 15 16 17 18 19
peaks were also detected in 16% (30/185) of HA-MRSA, 20% (26/127) of CA-MRSA
and 10% (11/109) of MSSA isolates (Table 1), and approximately 40% of these
isolates were determined to have vancomycin MICs of 2 mg/l. Although S. aureus
isolates with vancomycin MIC of 2 mg/l are classified as vancomycin susceptible,
60% of these isolates may be hetero-resistance to vancomycin.32 Sancaket al. showed
that the hVISA phenotype (MIC, 0.2-2mg/l) was present in 46 of 256 (18%) MRSA
isolates in a Turkish hospital.33 Another study showed that hVISA isolates existed in
255 (11%) of 2300 S. aureus isolates in a French hospital.34 In this study, we found
that a newly collected MRSA isolate no. 151, which also had the 1835.0 m/z and
1863.0 m/z peaks, had a vancomycin MIC of 4 mg/l.
The peptides of the 1835.0 m/z and 1863.0 m/z peaks were identified as the
proteolytically processed peptides of the acyl carrier protein (ACP) in this study. ACP
is a carrier of a growing fatty acid chain in fatty acid biosynthesis and is involved in
bacterial cell wall synthesis. In general, VISA isolates have a thicker cell wall than
MRSA isolates; this is a mechanism of vancomycin resistance.35 It is possible that the
production of ACP results in thicker cell wall and thus vancomycin resistance. This
possibility remains to be verified because the number of isolates examined in this
study was insufficient to make a definite conclusion. 1 2 3 4 5 6 7 8 9 10 11 12 13 14 15 16 17 18 19
Conclusions
In summary, we found that the peptide ion profiles of SCCmec I-III S. aureus
isolates were different from those of SCCmec IVV isolates in the range of 1000
-4000 m/z. Specifically, the 1774.1 m/z and 1792.1 m/z peaks whose corresponding
peptides were identified as PSMα1Δ1-5 and PSMα2Δ1-5, respectively were found to
be present in the majority (95%; 121/127) of SCCmec IV-V isolates, but only in 8%
(15/185) of SCCmec I-III isolates. Since SCCmec I-III types are recognized as
HA-MRSA and most CA-MRSA isolates harbor SCCmec IV or V, types are recognized as
CA-MRSA strains, these two peptides may be used as markers to distinguish these
two types of MRSA strains. Similarly, the 1835.0 m/z and 1863.0 m/z peaks were
found to be present in 50% (4/8) of hVISA and 88% (14/16) of VISA isolates. The
peptides of these two peaks were identified as a proteolytically processed peptide of
ACP, and the presence of these two peaks correlated with vancomycin resistance.
Based on the peptide markers of the 1774.1, 1792.1, 1835.0, and 1863.0 m/z peaks, a
direct diagnostic or complementary tool by MALDI-TOF maybe developed to provide
a rapid and accurate identification of CA-MRSA, HA-MRSA, and vancomycin
resistant S. aureus isolates.
FIGURE LEGENDS 1 2 3 4 5 6 7 8 9 10 11 12 13 14 15 16 17 18 19
Figure 1. MALDI-TOF mass spectra of MSSA (ATCC29213), MRSA (N315) and
VISA (Mu50) strains. Cell were grown on BHI agar plates and then extracted with 50
µl of 70% formic acid (FA) and 50 µl of ACN. The extracts were analyzed by
MALDI-TOF in both (a) linear and (b) reflector modes.
Figure 2. MALDI-TOF mass spectra of MSSA (ATCC29213), MRSA (N315) and
VISA (Mu50) strains. Cell were grown on BHI agar plates and then extracted with 50
µl of 2.5% formic acid (FA) and 50 µl of ACN. The extracts were analyzed by
MALDI-TOF in both (a) reflector and (b) linear modes. Panel (c) shows the reflector
mode MALDI-TOF analysis of the extracts of cells grown on BAP agar plates.
Figure 3. MALDI-TOF mass spectra of MSSA (strain 44) and the five types of
MRSA strains: SCCmec I (10442), SCCmec II (4159), SCCmec III (4155), SCCmec
IV (4162), and SCCmec V (4139). Cells were grown on BHI agar plates. The cell
extracts were analyzed by the reflector mode MALDI-TOF.
Figure 4. Statistical analyses of reflector mode MALDI-TOF MS data of MRSA
isolates. The analyzed MRSA included 49 SCCmec II, 136 SCCmec III, 74 SCCmec
IV, and 53 SCCmec V isolates. (a) Pseudo gel view of peptide profiles of the isolates.
The horizontal line in the figure indicates the separation between SCCmec(II and III) 1 2 3 4 5 6 7 8 9 10 11 12 13 14 15 16 17 18 19 20
and SCCmec (IVand V) groups. The differential density along x axis represents the
abundance of specific peptide presents in the samples. (b) Two-dimensional cluster
plot of isolates based on the presence of the 1774.1 m/z and 1792.1 m/z peaks. (c)
ROC curve of the 1774.1 m/z peak. (d) ROC curve of the 1792.1 m/z peak.
Figure 5. Identification of the corresponding peptides of the 1774.1 m/z and 1792.1
m/z peaks. (a) Peptide identification spectra of the 1774.1 m/z peak. (b) Peptide
identification spectra of the 1792.1 m/z peak.
Figure 6. MALDI-TOF analysis of a standard VISA strain (Mu3) and two clinical
VISA isolates (no. 1962 and no. 243). Cells were grown on BHI agar plates and then
extracted with 50 µl of 2.5% formic acid (FA) and 50 µl of ACN. The cell extracts
were analyzed by the reflector mode MALDI-TOF.
TABLES
Table 1. Analyses S. aureus isolates by MALDI-TOF. *The numbers of isolates with
or without the indicated peaks are shown. ATCC 29213 (MSSA), NCTC10442
(HA-MRSA), N315 (HA-(HA-MRSA), IVa (CA-(HA-MRSA), WIS (CA-(HA-MRSA), Mu3 (hVISA),
and Mu50 (VISA) are standard strains. The plus (+) sign indicates the presence of the
peaks (S/N≧3), and the minus (-) sign denotes the absence of the peaks. 1 2 3 4 5 6 7 8 9 10 11 12 13 14 15 16 17 18 19 20
*Corresponding Author
Phone:+886-4-22052121-2761. E-mail:[email protected]
ACKNOWLEDGMENT
This work was supported by grants from the National Science Council (NSC
98-2320-B-039-032-MY3, NSC99-2113-M-039-004-MY2) and the China Medical
University Hospital (DMR-100-121, DMR-99-167), Taichung, Taiwan.
ABBREVIATIONS
CA-MRSA, community associated-methicillin-resistant Staphylococcus aureus;
HA-MRSA, hospital associated methicillin-resistant Staphylococcus aureus; VISA,
vancomycin-intermediate Staphylococcus aureus; MALDI-TOF MS, matrix-assisted
laser desorption/ionization time-of-flight mass spectrometry; ROC, receiver operating
characteristics; NCBI, National Center for Biotechnology Information; PSMα1,
phenol-soluble modulin alpha 1 peptide; PSMα2, phenol-soluble modulin alpha 2
peptide; FA, formic acid 1 2 3 4 5 6 7 8 9 10 11 12 13 14 15 16 17
REFERENCES
(1) Daum, R. S. N Engl j Med 2007, 357, 380-390.
(2) Chambers, H. F.; Deleo, F. R. Nat Rev Microbiol 2009, 7, 629-641.
(3) Lowy, F. D. N Engl J Med 1998, 339, 520-532.
(4) Chambers, H. F.; Deleo, F. R. Nature reviews Microbiology 2009, 7, 629-641.
(5) Weigel, L. M.; Clewell, D. B.; Gill, S. R.; Clark, N. C.; McDougal, L. K.;
Flannagan, S. E.; Kolonay, J. F.; Shetty, J.; Killgore, G. E.; Tenover, F. C. Science
2003, 302, 1569-1571.
(6) Kobayashi, N.; Wu, H.; Kojima, K.; Taniguchi, K.; Urasawa, S.; Uehara, N.;
Omizu, Y.; Kishi, Y.; Yagihashi, A.; Kurokawa, I. Epidemiol Infect 1994,113,
259-266.
(7) Hsieh, S. Y.; Tseng, C. L.; Lee, Y. S.; Kuo, A. J.; Sun, C. F.; Lin, Y. H.; Chen, J.
K. Mol Cell Proteomics 2008, 7, 448-456.
(8) Seng, P.; Drancourt, M.; Gouriet, F.; La Scola, B.; Fournier, P. E.; Rolain, J. M.;
Raoult, D. Clin Infect Dis 2009, 49, 543-551.
(9) Kaleta, E. J.; Clark, A. E.; Cherkaoui, A.; Wysocki, V. H.; Ingram, E. L.;
Schrenzel, J.; Wolk, D. M. Clin Chem 2011, 57, 1057-1067.
(10) Ho, C. M.; Hsueh, P. R.; Liu, C. Y.; Lee, S. Y.; Chiueh, T. S.; Shyr, J. M.; Tsao,
S. M.; Chuang, Y. C.; Yan, J. J.; Wang, L. S.; Wang, J. H.; Ho, M. W. Tien, N.; Lu, J.
J. Eur J Clin Microbiol Infect Dis 2010, 29, 383-389. 1 2 3 4 5 6 7 8 9 10 11 12 13 14 15 16 17 18 19 20
(11) Wang, W. Y.; Lee, S. Y.; Chiueh, T. S.; Lu, J. J. J Clin Microbiol 2009, 47,
3617-3623.
(12) Kondo, Y.; Ito, T.; Ma, X. X.; Watanabe, S.; Kreiswirth, B. N.; Etienne, J.;
Hiramatsu, K. Antimicrob Agents Chemother 2007, 51, 264-274.
(13) Boyle-Vavra, S.; Ereshefsky, B.; Wang, C. C.; Daum, R. S. J Clin Microbiol
2005, 43, 4719-4730.
(14) Grundmann, H.; Aires-De-Sousa, M.; Boyce, J.; Tiemersma, E. Lancet 2006,
368, 874-885.
(15) Suckau, D.; Resemann, A.; Schuerenberg, M.; Hufnagel, P.; Franzen, J.; Holle,
A. Anal Bioanal Chem 2003, 376, 952-965.
(16) Enright, M. C.; Robinson, D. A.; Randle, G.; Feil, E. J.; Grundmann, H.; Spratt,
B. G. Proc Natl Acad Sci U S A 2002, 99, 7687-7692.
(17) Wang, R.; Braughton KR, Kretschmer D, Bach TH, Queck SY, Li M, Kennedy,
A. D., Dorward, D. W.; Klebanoff, S. J.; Peschel, A.; DeLeo, F.R.; Otto, M. Nat Med
2007, 13, 1510-1514.
(18) Demirev, P. A.; Fenselau, C. Annu Rev Anal Chem (Palo Alto Calif) 2008, 1,
71-93.
(19) Ho, Y. P.; Reddy, M. Clin Chem 2010, 56, 525-536.
(20) Tao, L.; Yu, X.; Snyder, P. A.; Li, L. Anal. Chem. 2004, 76, 6609-6617.
(21) Du, Z.; Yang, R.; Guo, Z.; Song, Y.; Wang, J. Anal. Chem. 2002, 74, 5487-5491. 1 2 3 4 5 6 7 8 9 10 11 12 13 14 15 16 17 18 19 20
(22) Peter, L.; Drevinek, M.; Nattermann, H.; Grunow, R.; Maren Stämmler, M.;
Dieckmann, R.; Schwecke, T.; Naumann, D. Anal. Chem. 2010, 82, 8464–8475.
(23) Fagerquist, C. K.; Garbus, B. R.; Miller, W. G.; Williams, K. E.; Yee, E.; Bates,
A. H.; Boyle, S.; Harden, L. A.; Cooley, M. B.; Mandrell, R. E. Anal. Chem. 2010,
82, 2717–2725.
(24) Demirev, P. A.; Feldman, A. B.; Kowalski, P.; Lin, J. S. Anal. Chem. 2005, 77,
7455-7461.
(25) Wynne, C.; Fenselau, C.; Demirev, P. A.; Edwards, N. Anal Chem. 2009, 81,
9633-9642.
(26) Bernardo, K.; Pakulat, N.; Macht, M.; Krut, O.; Seifert, H.; Fleer, S.; Hünger, F.;
Krönke, M. Proteomics 2002, 2, 747-753.
(27) Hiramatsu, K.; Hanaki, H.; Ino, T.; Yabuta, K.; Oguri, T.; Tenover, F. C. J
Antimicrob Chemother 1997, 40, 135-136.
(28) Howden, B. P.; Davies, J. K.; Johnson, P. D.; Stinear, T. P.; Grayson, M. L. Clin
Microbiol Rev 2010, 23, 99-139.
(29) Drummelsmith, J.; Winstall, E.; Bergeron, M. G.; Poirier, G. G.; Ouellette, M. J
Proteome Res 2007, 6, 4690-4702.
(30) Swenson, J. M.; Anderson, K. F.; Lonsway, D. R.; Thompson, A.; McAllister, S.
K.; Limbago, B. M.; Carey, R. B.; Tenover, F. C.; Patel, J. B. J Clin Microbiol 2009,
47, 2013-2017. 1 2 3 4 5 6 7 8 9 10 11 12 13 14 15 16 17 18 19 20
(31) Wootton, M.; Howe, R. A.; Hillman, R.; Walsh, T. R.; Bennett, P. M.;
MacGowan, A. P. J Antimicrob Chemother 2001, 47, 399-403.
(32) Tenover, F. C.; Moellering, R. C. Clin Infect Dis 2007;44:1208-1215.
(33) Sancak, B.; Ercis, S.; Menemenlioglu, D.; Colakoglu, S.; Hascelik, G. J
Antimicrob Chemother 2005, 56, 519-523.
(34) Garnier, F.; Chainier, D.; Walsh, T.; Karlsson, A.; Bolmstrom, A.; Grelaud, C.;
Mounier, M.; Denis, F.; Ploy, M. C. J Antimicrob Chemoth 2006, 57, 146-149.
(35) Cui, L.; Ma, X. X.; Sato, K.; Okuma, K.; Tenover, F. C.; Mamizuka, E. M.;
Gemmell, C. G.; Kim, M. N.; Ploy, M. C.; El-Solh, N.; Ferraz, V.; Hiramatsu, K. J
Clin Microbiol 2003, 41, 5-14.
Table 1. Analyses S. aureus isolates by MALDI-TOF*.
MS
peaks(m/z)
No. of Isolates
MSSA HA-MRSA CA-MRSA hVISA VISA
109 ATCC 29213 185
NCTC
10442 N315 127 IVa WIS 8 Mu3 16 Mu50 1 2 3 4 5 6 7 8 9 10 11 12 13 14 15 16 17 18
1774.1 and 1792.1 101 + 15
-
-
121 + + 0-
1 -2287.3 and 2305.3 91-
91-
-
120 +-
5-
1 -1835.0 and 1863.0 11-
30-
-
26 + + 4 + 14 + *The numbers of isolates with or without the indicated peaks are shown. ATCC29213 (MSSA), NCTC10442 (HA-MRSA), N315 (HA-MRSA), IVa
(CA-MRSA), WIS (CA-(CA-MRSA), Mu3 (hVISA), and Mu50 (VISA) are standard
strains. The plus (+) sign indicates the presence of the peaks (S/N≧3), and the
minus (-) sign denotes the absence of the peaks. 1 2 3 4 5 6 7 8 9 10 11 12 13 14 15
For TOC only
1 2