471
Journal of Biomolecular Structure & Dynamics, ISSN 0739-1102 Volume 28, Issue Number 4, (2011) ©Adenine Press (2011)
*Phone: +1-617-353-7123
E-mail: [email protected]; ycc929@ MIT.EDU (C.Y.-C. Chen)
Chia-Hui Lin
1Tung-Ti Chang
2, 8Mao-Feng Sun
3, 8Hsin-Yi Chen
4Fuu-Jen Tsai
4,5Kun-Lung Chang
6Mark Fisher
7Calvin Yu-Chian Chen
4,7,8,9*
1Department of Chinese Medicine, China
Medical University Hospital, Taiwan
2Department of Chinese Pediatrics, China
Medical University Hospital, Taiwan
3Department of Acupuncture, China
Medical University Hospital, Taiwan
4Department of Bioinformatics, Asia
University, Taichung, 41354, Taiwan
5Department of Medical Genetics,
Pediatrics and Medical Research, China Medical University Hospital and College of Chinese Medicine, China Medical University, Taichung, 40402, Taiwan
6Department of Pharmacy, China
Medical University Hospital, Taichung, 40402, Taiwan
7Harvard-MIT Division of Health
Sciences and Technology, 77 Massachusetts Avenue, Cambridge, MA 02139, USA
Potent Inhibitor Design Against H1N1
Swine Influenza: Structure-based and Molecular
Dynamics Analysis for M2 Inhibitors from
Traditional Chinese Medicine Database
http://www.jbsdonline.com
Abstract
The rapid spread of influenza virus subtype H1N1 poses a great threat to million lives worldwide. To search for new anti-influenza compounds, we performed molecular dock-ing and molecular dynamics simulation to identify potential traditional Chinese medicine (TCM) constituents that could block influenza M2 channel activity. Quinic acid, genipin, syringic acid, cucurbitine, fagarine, and methyl isoferulate all have extremely well dock-ing results as compared to control amantadine. Further de novo drug design suggests that derivatives of genipin and methyl isoferulate could have enhanced binding affinity towards M2 channel. Selected molecular dynamics simulations of M2-derivative complexes show stable hydrogen bond interactions between the derivatives and M2 residues, Ser10 and Ala9. To our best knowledge, this is the first study on the anti-viral activity of the above listed TCM compounds.
Key words: H1N1; M2 proton channel; Docking; Molecular dynamics; Traditional Chinese medicine (TCM).
Introduction
The recent H1N1 influenza pandemic has attracted worldwide attention due to the high infection rate. Oseltamivir (Tamiflu) and zanamivir (Relenza), both of which have been effective in treating influenza A in the past, are recently found to be inef-fective against mutated strains (1). Therefore, there is an urgent need to search for new effective anti-viral compounds.
In addition to hemagglutinin and neuraminidase, the surface membrane of influenza virus A still consist a M2 proton channel. M2 is a homotetrameric protein that is constituted by an N-terminal periplasmic domain, a transmem-brane (TM) domain, and a C-terminal cytoplasm tail (2). This proton channel is activated by low pH environment in the endosome. The inflow of proton through
8Laboratory of Computational and Systems Biology, School of Chinese Medicine,
China Medical University, Taichung, 40402, Taiwan
9Computational and Systems Biology, Massachusetts Institute of Technology,
472
Lin et al.
M2 acidifies the interior environment of the virus, leading to the dissociation of viral matrix protein (M1) from viral RNA genome (2). The activation site of M2 protein is believed to be in the transmembrane domain, with the ionizable His37 acts as the pH sensor and the indole side chain of Try41 acts as a the channel gate (3, 4).
Amantadine and rimantadine are both commercial available admantane-based drugs used in the past for treating influenza A. However, the effectiveness of these drugs is now greatly debated due to the high number of admantane inhibitor resistant influenza viral strains (5, 6). Recently, two groups have simultaneously published their high-resolution structures of the M2 transmembrane domain in the presence admantane inhibitors.
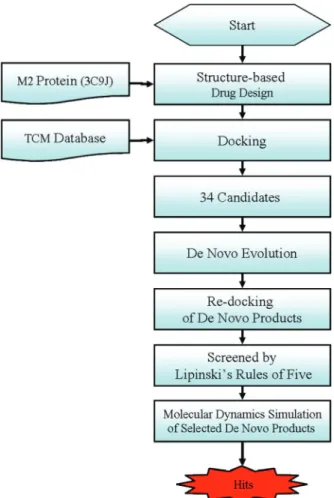
The main focus in this research is to discover potential natural compounds that can directly block the M2 proton channel from allowing entry of hydrogen ions. In recent years, computer-aided drug design (CADD) has been a promising strategy for identifying potential lead compounds and molecu-lar structural features that are related to biological activity. Structure-based investigations have been widely used to study ligand and receptor interaction and have been applied in drug designs (7-16). Molecular dynamics simula-tion, too, has been widely applied to investigate biological systems (17-31). In the past, our group has been a pioneer in developing new scoring func-tion (32) and also has successfully implemented CADD technology into development of new therapeutics (33-52). Thus, we hope to combine our expe-riences in structure-based drug design and molecular dynamics simulation to study M2 proton channel. An experiment scheme for this study is shown in Figure 1.
473
Potent Inhibitor Design
Against H1N1 Swine
influenza
Materials and MethodsDataset
We have created a small molecule database (http://tcm.cmu.edu.tw/) containing three-dimensional structures of compounds isolated from traditional Chinese medicine (TCM). These TCM compounds were obtained from extensive literature searches and were drawn into two-dimensional and three-dimensional forms via ChemBioOffice 2008 (CambridgeSoft Inc., Cambridge, MA, USA). Energy minimization of TCM compounds was performed using MM2 forcefield in ChemBioOffice.
The crystal structure of M2 proton channel was downloaded from Protein Data Bank (PDB code: 3C9J (53)). Amantadine presented in the protein crystal was taken out, but was re-docked back into M2 protein in subsequent steps. All water molecules and other non-biopolymer heteroatoms were removed.
Docking Screening
Docking was conducted in Discovery Studio v2.5 0.9164 (Accelrys Inc, San Diego, USA). Forcefield of Chemistry at Harvard Macromolecular Mechanics (CHARMm) was applied to both M2 protein and small molecules prior to docking process. LigandFit program of Discovery Studio was used for docking while scoring func-tions, Dock Score, LigScore1 (54), LigScore2 (54), PLP1 (55), PLP2 (56) and PMF (57), were employed for evaluating molecule binding affinity. Amantadine binding location was defined as binding site, and TCM compounds and amantadine were docked into it. The scoring function outputs for amantadine were used as control for filtering TCM compounds.
De Novo Evolution and Lipinski’s Rule of Five
TCM compounds with higher docking scores than amantadine were selected from the previous step. Their scaffolds were then modified and developed into deriva-tives in de novo evolution process. In de novo evolution, Ludi algorithm was employed to generate possible interaction sites within the ligand binding location. Fragments that can complement the receptor while also form favorable interaction with the Ludi interaction sites are fused or linked to the docked TCM ingredients. The generated derivatives were docked back into the M2 protein to examine their binding affinities. Lipinski’s Rule of Five was used to filter out compounds that may not be orally active.
Molecular Dynamics Simulation
The top docked TCM derivatives were selected for molecular dynamics simula-tions. The simulations were initiated from M2-derivative complex coordinates. All simulations were carried out with Discovery Studio v2.5. The CHARMm forcefield was applied to both protein and small molecules. The protein-ligand systems were solvated in a cubic box of water molecules (a total of 6056 water molecules) with explicit periodical boundary condition. All the protein and TCM atoms are at a distance equal or greater than 7 Å from the boundary. The particle-mesh Ewald (PME) method was used for electrostatics calculations (58). The time step was 1 fs, and the SHAKE algorithm was used to constrain bonds con-taining hydrogen. The frequency of velocity adjustment for each particle was set to every 50 steps.
Initially, the M2-derivative system underwent 500 steps of steepest descent mini-mization and 500 steps of conjugate gradient minimini-mization. The energy minimiza-tion step was followed by heating, equilibraminimiza-tion and producminimiza-tion. The whole system
474
Lin et al.
was heated from initial temperature of 50K to 310 K in 20 ps. The equilibration was run in310K for 100 ps without restrained. During production, the simulation was performed in NVT ensemble at 310 K with temperature coupling decay time of 5 ps. The production was run until the root mean square deviation (RMSD) of the whole protein-ligand complex reached a plateau. The snapshots from the produc-tion period were saved every 2.5 ps.
To evaluate protein and ligand conformation changes, RMSD was computed for the entire protein molecule using the starting structure as reference. Hydrogen bonding between the M2 protein and the TCM derivative was monitored and analyzed over the course of the simulation. The cutoff for hydrogen bonding interaction was set to 2.5 Å. Percentage of hydrogen bond occupancy was calculated as the number of hydrogen bond appearances over the number of conformations sampled during the molecular dynamics simulation.
Results and Discussion
Docking Screening
Docking and scoring of TCM compounds and amantadine enable us to evaluate docking conformations and binding affinity of these small molecules in M2. Of all the proposed admantane inhibitor binding sites and inhibitor mechanisms, the direct pore blocking strategy of amantadine, as supported by the crystal structure
Table I
The top 6 candidates docking results of M2 Protein.
Name DS* LigS1 LigS2 -PLP1 -PLP2 -PMF
Quinic acid 42.95 4.54 4.49 49.70 58.33 30.00 Genipin 42.18 3.69 4.81 47.67 47.84 44.14 Syringic acid 41.60 2.25 3.61 49.35 49.94 97.62 Cucurbitine 39.94 4.11 4.11 47.50 50.29 46.30 Fagarine 39.39 1.35 4.16 79.35 71.18 98.43 Methyl isoferulate 38.68 2.69 4.41 52.43 46.99 47.83 Amantadine 33.87 0.89 3.70 28.50 26.60 –2.90
The control, amantadine, is in gray shade. *Dock Score.
475
Potent Inhibitor Design
Against H1N1 Swine
influenza
used in this study, is the most well studied and recognized. Therefore, we chose the amantadine binding site as the TCM docking site. The outputs of scoring functions are shown in Table I. Only the top six TCM compounds, as ranked by Dock Score, are shown. Based on our past experiences, Dock Score has the highest positive correlation with compound bioactivity (32), and therefore, we used Dock Score for ranking purpose. LigScore1, LigScore2, PLP1, PLP2 and PMF are shown in Table I as additional references.
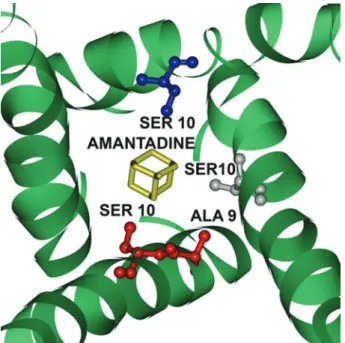
The control, amantadine, is a well example of the predictivity of scoring func-tions. The crystal structure used in our study (Figure 2), as well as NMR structure solved by Schnell and Chou (59), both confirmed that the M2 channel inner lining is highly hydrophilic and is energetically unfavorable for the hydro-phobic, adamantane-based amantadine. As reflected in scoring results, amanta-dine has relative low Dock Score, LigScore (which accounts for polar attraction), -PLP (which evaluates hydrogen bond interaction) and -PMF (which compute Helmholtz free interaction energies). In contrast, the top TCM compounds resulted from docking all contain hydrophilic groups that are more favorable for interacting M2 proton channel residues and, therefore, should have stronger hydrogen bond interaction. Judging by their scoring function outputs, these TCM compounds are hypothesized to have higher binding affinity for M2 protein. De Novo Evolution and Lipinski’s Rule of Five
From docking screening, a total of 34 compounds with Dock Score higher than amantadine were selected for de novo evolution, which generated 93 derivatives. These passed the Lipinski’s rule of five screening were re-docked back to M2 proton pore to evaluate docking conformations and scoring function outputs (shown in Table II).
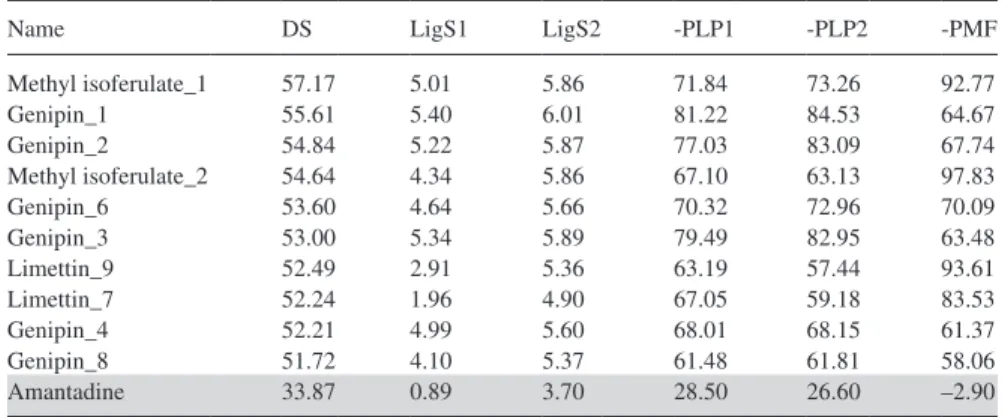
Table II
The top 10 derivatives from de novo evolution.
Name DS LigS1 LigS2 -PLP1 -PLP2 -PMF
Methyl isoferulate_1 57.17 5.01 5.86 71.84 73.26 92.77 Genipin_1 55.61 5.40 6.01 81.22 84.53 64.67 Genipin_2 54.84 5.22 5.87 77.03 83.09 67.74 Methyl isoferulate_2 54.64 4.34 5.86 67.10 63.13 97.83 Genipin_6 53.60 4.64 5.66 70.32 72.96 70.09 Genipin_3 53.00 5.34 5.89 79.49 82.95 63.48 Limettin_9 52.49 2.91 5.36 63.19 57.44 93.61 Limettin_7 52.24 1.96 4.90 67.05 59.18 83.53 Genipin_4 52.21 4.99 5.60 68.01 68.15 61.37 Genipin_8 51.72 4.10 5.37 61.48 61.81 58.06 Amantadine 33.87 0.89 3.70 28.50 26.60 –2.90
The control, amantadine, is in gray shade. *Dock Score.
O O
O HO
Methyl isoferulate_1 Genipin_1
N OH O O O OH HO HO
476
Lin et al.
The top 10 derivatives, which all have scoring results better than the control, consist of compounds from methyl isoferulate (constituents of Phellodendron amurense var. wilsonii (60)), genipin (constituents of Gardenia jasminoides fruit (61)) and limettin (constituents of Citrus (62)). Of the three, genipin is most well known as cross-linker in protein-linking (63). Past studies have also reported the anti-hepatitis B virus activity of genipin derivative (64). However, all three com-pounds have not been studied before for anti-influenza activity. To our best knowl-edge, this is the first study to investigate the anti-influenza potential of these three compounds.
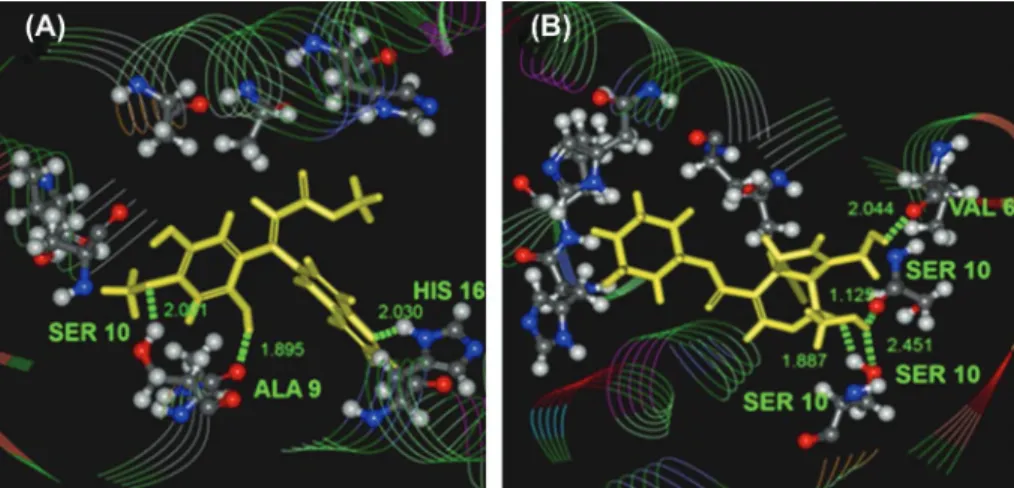
Two-dimensional structures of the top two TCM derivatives are shown in Figure 3, and their docking conformations are shown in Figure 4. These TCM derivatives differ from amantadine in containing more hydrogen bond donors and acceptors that could form interactions with hydrophilic residues of the M2 channel. However, similar to amantadine, all TCM derivatives still have hydrophobic substructures, such as cyclohexane, in addition to hydrophilic groups. For methyl isoferulate_ 1-M2 complex, hydrogen bond interactions can be seen between the ligand and protein residues, Ser10 and Ala9 (Figure 4(a)). A third hydrogen bond interaction
Methyl isoferulate_1 2 2.5 3 0 2 4 6 8 10 12 14 16 18 20 Time (ns) RMSD (Å) Genipin_1 1 1.5 2 2.5 3 0 5 10 15 20 25 30 35 40 Time (ns) RMSD (Å) (A) (B)
Figure 5: Root-mean-square deviation of M2-ligand complexes (A) methyl isoferulate_1 from 20 ns MD simulation and (B) genipin_1 from 40 ns MD simulation.
477
Potent Inhibitor Design
Against H1N1 Swine
influenza
is established between the quinoline group of ligand and His16 side chain (Figure 4(A)). For genipin_1-M2 complex, hydrogen bond interactions are mostly found between ligand and Ser10 (Figure 4(B)).
Molecular Dynamics Simulation
To further analyze protein-ligand interaction, we selected the top two de novo compounds for molecular dynamics simulation. The overall goal of this simu-lation step was to account for protein flexibility and movement that cannot be achieved in the docking simulation. For methyl isoferulate_1-M2 complex, the production step was run for 20 ns, and a plateau in whole molecule RMSD (2.6 Å) was reached after 4 ns of simulation (Figure 5(A)). Interestingly, the
Table III
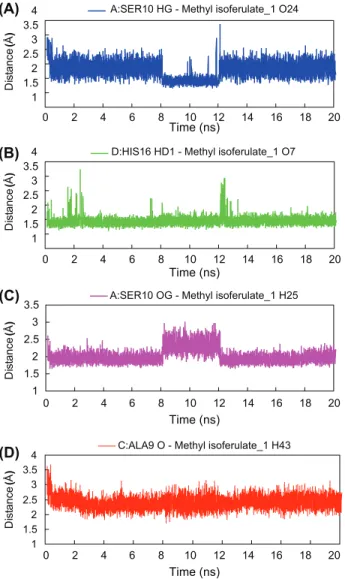
Summary of hydrogen bonds statistics after molecular dynamics simulation. Max. Distance Min. Distance Ave. Distance % of Occupancy A:SER10 HG-Methyl isoferulate_1 O24 3.846 1.668 2.282 73.09% D:HIS16 HD1-Methyl isoferulate_1 O7 3.715 1.624 1.942 98.54% A:SER10 OG-Methyl isoferulate_1 H25 2.990 1.659 2.018 99.98% C:ALA9 O-Methyl isoferulate_1 H43 3.661 1.697 2.402 72.06%
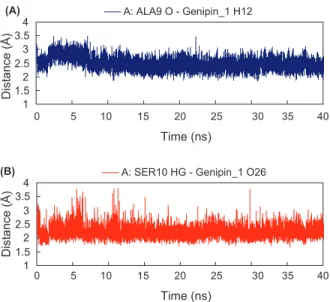
A: ALA9 O-Genipin_1 H12 3.485 1.832 2.494 55.64%
A: SER10 HG-Genipin_1 O26 3.814 1.672 2.211 92.89%
(A) 1 1.52 2.53 3.54 0 2 4 6 8 10 12 14 16 18 20 Time (ns) Time (ns) Time (ns)
A:SER10 HG - Methyl isoferulate_1 O24
(B) 1 1.52 2.53 3.54 0 2 4 6 8 10 12 14 16 18 20
D:HIS16 HD1 - Methyl isoferulate_1 O7
(C) (D) 1 1.5 2 2.5 3 3.5 0 2 4 6 8 10 12 14 16 18 20 Time (ns) 0 2 4 6 8 10 12 14 16 18 20 D ist an ce (Å ) D ist an ce (Å ) D ist an ce (Å ) D ist an ce (Å)
A:SER10 OG - Methyl isoferulate_1 H25
1 1.5 2 2.5 3 3.54
C:ALA9 O - Methyl isoferulate_1 H43
478
Lin et al.
genipin_1-M2 complex took a longer simulation time out of entire 40 ns pro-duction run to reach dynamics equilibrium (Figure 5(B)), but the complex sta-bilized at 2.3 Å, which deviated less than methyl isoferulate_1 complex from the starting crystal structure. These results suggest that the methyl isoferulate_1 complex undergoes a rather rapid conformational change compared to genipin_1 complex. We, therefore, hypothesiz that methyl isoferulated_1 can more effi-ciently induced M2 conformation changes, such as by interacting with key resi-due His16 to close the M2 channel.
We have analyzed the hydrogen-bond interactions and calculated the length of hydrogen bond for the two TCM derivative-M2 complexes. For methyl isoferu-late_1 complex, four hydrogen bonds are observed, with percent of occupancy over 50 of the entire simulation (Table III). The interaction between the pro-tonated nitrogen of His16 imidazole ring (chain D) and the carbonyl group of methyl isoferulate_1 is one of the most stable hydrogen bond interactions throughout the simulation with distance averaging 1.942 Å (Figure 6(B)). The interaction between hydroxyl group of methyl isoferulate_1 and of Ser10 side chain, however, is more interesting with noticeable changes during the period of 8-12ns, hinting a possible fluctuation in M2 chain A conformation at that time (Figure 6(A) and (C)). As for hydrogen bonding between carbonyl backbone of Ala9 (chain C) and methyl isoferulate_1, the distance appears to be largely fluctuating around 2.5 Å, suggesting substantial changes in M2 chain C. For genipin_1-M2 complex, two hydrogen bonds are observed (Table III). Their hydrogen bond distances are shown in Figure 7(A) and (B). The interacting pro-tein residues (Ala9 and Ser10) are similar to those observed in methyl isoferu-late_1 complex but with large fluctuation from the averaging distances. Based on the results from genipin_1 and methyl_isoferulate-M2 complex, it appears that interactions to Ala9 and Ser10 of M2 protein are important for inhibitory activity of the TCM derivatives.
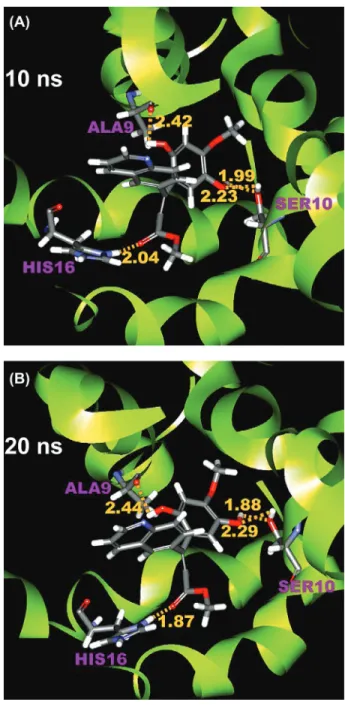
Snapshots from molecular dynamics simulations are shown in Figures 8 and 9 for methyl isoferulate_1 and genipin_1, respectively. A comparison between the poses obtained from docking and from molecular dynamics simulation shows that substantial changes in binding conformations have occurred. Initial docking conformation of methyl isoferulate_1 has a hydrogen bond interaction between the nitrogen of quinoline ring and protonated imidazole ring of His16. This inter-action, however, is later shifted to between the more electronegative carbonyl group of methyl isoferulate_1 and His16 (Figure 8(A)) and is later maintained to the end of simulation run (Figure 8(B)). For genipin_1, several hydrogen bond
(A) 1 1.52 2.53 3.54 A: ALA9 O - Genipin_1 H12 (B) 1 1.52 2.53 3.54 0 5 10 15 20 25 30 35 40 Time (ns) 0 5 10 15 20 25 30 35 40 Time (ns) Distance ( Å) Distance ( Å)
A: SER10 HG - Genipin_1 O26
479
Potent Inhibitor Design
Against H1N1 Swine
influenza
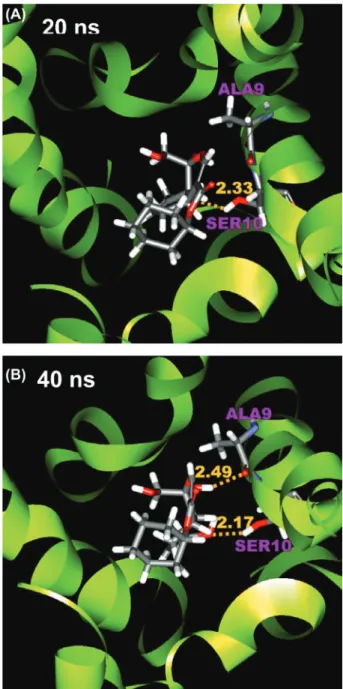
interactions of the ligand to Ser10 residues can be found after docking, but most interactions diminish after the simulation (Figure 9(A-B)). The hydrogen bond interaction of genipin_1 to Ala9 may be temporary interrupted at 20 ns (Figure 9(A)), but, as shown in Figure 7(A), this interaction is constantly fluctuating. These results suggest that the initial receptor-ligand interaction observed after docking can be limited due to the receptor rigid docking algorithm and that the conformations and interactions observed after simulation runs are more energeti-cally favored and should be better representation of derivative binding conforma-tion in the receptor.
Conclusion
We have performed docking and molecular dynamics simulation studies to search for TCM constituents that have potential M2 channel inhibitory activity. Our dock-ing simulation gives six TCM compounds that have better predicted binddock-ing affinity Figure 8: Conformation of methyl isoferulate_1-M2 complex at (A) 10 ns and (B) 20 ns. Protein resi-dues, Ala9 (chain C), Ser10 (chain A) and His16 (chain D), are labeled in purple. The length of hydro-gen bonds is shown in yellow.
480
Lin et al.
than the control, amantadine. Further, de novo simulation and docking of deriva-tives suggest that genipin, methyl isoferulate, and their derivaderiva-tives as possible M2 inhibitors. Methyl isoferulate_1 and genipin_1 form hydrogen bond interactions with M2 residues, Ala9 and Ser10, during their respective 20 ns and 40 ns molecu-lar simulation runs, suggesting that ligand interaction to these two residues could be critical for inhibitor activity.
Acknowledgements
The research was supported by grants from the National Science Council of Taiwan (NSC 99-2221-E-039-013-), China Medical University (CMU98-TCM, CMU99-S-02) and Asia University (CMU98-ASIA-09). This study is also supported in part by Taiwan Department of Health Clinical Trial and Research Center of Excellence (DOH99-TD-B-111-004) and Taiwan Department of Health Cancer Research Center of Excellence (DOH99-TD-C-111-005). We are grateful to the National Center of High-performance Computing for computer time and facilities.
Figure 9: Conformation of genipin_1-M2 complex at (A) 20 ns and (B) 40 ns. Protein residues, Ala9 (chain A) and Ser10 (chain A), are labeled in purple. The length of hydrogen bond is shown in yellow.
481
Potent Inhibitor Design
Against H1N1 Swine
influenza
ReferencesA. C. Hurt, J. Ernest, Y. M. Deng, P. Iannello, T. G. Besselaar, C. Birch, P. Buchy, 1.
M. Chittaganpitch, S. C. Chiu, D. Dwyer, A. Guigon, B. Harrower, I. P. Kei, T. Kok, C. Lin, K. McPhie, A. Mohd, R. Olveda, T. Panayotou, W. Rawlinson, L. Scott, D. Smith, H. D'Souza, N. Komadina, R. Shaw, A. Kelso, and I. G. Barr. Antiviral Res 83, 90-93 (2009). S. D. Cady, W. B. Luo, F. H. Hu, and M. Hong.
2. Biochemistry 48, 7356-7364 (2009).
G. Y. Chuang, D. Kozakov, R. Brenke, D. Beglov, F. Guarnieri, and S. Vajda.
3. Biophys J
97, 2846-2853 (2009).
M. Yi, T. A. Cross, and H. X. Zhou.
4. J Phys Chem B 112, 7977-7979 (2008).
N. A. Ilyushina, E. A. Govorkova, and R. G. Webster.
5. Virology 341, 102-106 (2005).
F. G. Hayden.
6. N Engl J Med 354, 785-788 (2006). E. D. Akten, S. Cansu, and P. Doruker.
7. J Biomol Struct Dyn 27, 13-25 (2009).
A. M. Andrianov.
8. J Biomol Struct Dyn 26, 445-454 (2009). A. M. Andrianov, and I. V. Anishchenko.
9. J Biomol Struct Dyn 27, 179-193 (2009).
G. Ompraba, D. Velmurugan, P. A. Louis, and Z. A. Rafi
10. . J Biomol Struct Dyn 27, 489-499
(2010).
M. T. Cambria, D. Di Marino, M. Falconi, S. Garavaglia, and A. Cambria.
11. J Biomol Struct
Dyn 27, 501-509 (2010).
E. F. F. da Cunha, E. F. Barbosa, A. A. Oliveira, and T. C. Ramalho.
12. J Biomol Struct Dyn
27, 619-625 (2010).
C. Meynier, F. Guerlesquin, and P. Roche.
13. J Biomol Struct Dyn 27, 49-57 (2009).
S. Mohan, J. J. P. Perry, N. Poulose, B. G. Nair, and G. Anilkumar.
14. J Biomol Struct Dyn 26,
455-464 (2009).
T. C. Ramalho, M. S. Caetano, E. F. F. da Cunha, T. C. S. Souza, and M. V. J. Rocha. 15.
J Biomol Struct Dyn 27, 195-207 (2009). J. Sille, and M. Remko.
16. J Biomol Struct Dyn 26, 431-444 (2009).
H. R. Bairagya, B. P. Mukhopadhyay, and K. Sekar.
17. J Biomol Struct Dyn 27, 149-158
(2009).
B. Jin, H. M. Lee, and S. K. Kim.
18. J Biomol Struct Dyn 27, 457-464 (2010).
C. Koshy, M. Parthiban, and R. Sowdhamini.
19. J Biomol Struct Dyn 28, 71-83 (2010).
F. Mehrnejad and M. Zarei.
20. J Biomol Struct Dyn 27, 551-559 (2010).
S. Roy and A. R. Thakur.
21. J Biomol Struct Dyn 27, 443-455 (2010).
A. Sharadadevi and R. Nagaraj.
22. J Biomol Struct Dyn 27, 541-550 (2010).
S. Sharma, U. B. Sonavane, and R. R. Joshi.
23. J Biomol Struct Dyn 27, 663-676 (2010).
Y. Tao, Z. H. Rao, and S. Q. Liu.
24. J Biomol Struct Dyn 28, 143-157 (2010).
M. J. Aman, H. Karauzum, M. G. Bowden, and T. L. Nguyen.
25. J Biomol Struct Dyn 28, 1-12
(2010).
J. F. Varughese, J. M. Chalovich, and Y. Li.
26. J Biomol Struct Dyn 28, 159-173 (2010).
J. P. Zhang.
27. J Biomol Struct Dyn 27, 159-162 (2009). L. H. Zhong, and J. M. Xie.
28. J Biomol Struct Dyn 26, 525-533 (2009).
A. Cordomi, and J. J. Perez.
29. J Biomol Struct Dyn 27, 127-147 (2009).
Y. Yuan, M. H. Knaggs, L. B. Poole, J. S. Fetrow, and F. R. Salsbury, Jr.
30. J Biomol Struct
Dyn 28, 51-70 (2010).
J. Wiesner, Z. Kriz, K. Kuca, D. Jun, and J. Koca,
31. J Biomol Struct Dyn 28, 393-403 (2010).
C. Y. C. Chen.
32. J Biomol Struct Dyn 27, 271-282 (2009).
H. J. Huang, K. J. Lee, H. W. Yu, H. Y. Chen, F. J. Tsai, and C. Y. Chen.
33. J Biomol Struct
Dyn 28, 187-200 (2010).
H. J. Huang, K. J. Lee, H. W. Yu, C. Y. Chen, C. H. Hsu, H. Y. Chen, F. J. Tsai, and C. Y. 34.
C. Chen. J Biomol Struct Dyn 28, 23-37 (2010). C. Y. Chen, and C. Y. C. Chen.
35. J Mol Graph Model 29, 21-31 (2010).
H. J. Huang, C. Y. Chen, H. Y. Chen, F. J. Tsai, and C. Y. C. Chen.
36. J Taiwan Inst Chem
Eng 41, 352-359 (2010). C. Y. C. Chen.
37. J Biomol Struct Dyn 27, 627-640 (2010). C. Y. C. Chen.
38. J Taiwan Inst Chem Eng 41, 143-149 (2010). C. Y. Chen, H. J. Huang, F. J. Tsai, and C. Y. C. Chen.
39. J Taiwan Inst Chem Eng 41, 8-15
(2010). C. Y. C. Chen.
40. J Mol Graphics Model 28, 261-269 (2009).
C. Y. Chen, Y. H. Chang, D. T. Bau, H. J. Huang, F. J. Tsai, C. H. Tsai, and C. Y. C. Chen. 41.
J Biomol Struct Dyn 27, 171-178 (2009).
C. Y. Chen, Y. H. Chang, D. T. Bau, H. J. Huang, F. J. Tsai, C. H. Tsai, and C. Y. C. Chen. 42.
Acta Pharmacol Sin 30, 1186-1194 (2009). C. Y. C. Chen.
43. J Taiwan Inst Chem Eng 40, 155-161 (2009). C. Y. C. Chen.
44. J Taiwan Inst Chem Eng 40, 55-69 (2009). C. Y. C. Chen.
45. J Taiwan Inst Chem Eng 40, 36-47 (2009). C. Y. C. Chen.
46. J Chin Inst Chem Eng, 39, 663-671 (2008). C. Y. C. Chen.
47. J Chin Inst Chem Eng, 39, 617-624 (2008). C. Y. C. Chen, Y. F. Chen, C. H. Wu, and H. Y. Tsai.
48. J Biomol Struct Dyn 26, 57-64
482
Lin et al.
C. Y. C. Chen.
49. J Chin Inst Chem Eng 39, 291-299 (2008). C. Y. C. Chen, G. W. Chen, and W. Y. C. Chen.
50. J Chin Chem Soc 55, 297-302 (2008).
Y. C. Chen and K. T. Chen.
51. Acta Pharmacol Sin 28, 2027-2032 (2007).
Y. C. Chen.
52. J Chin Chem Soc 54, 653-658 (2007).
A. L. Stouffer, R. Acharya, D. Salom, A. S. Levine, L. Di Costanzo, C. S. Soto, V. Tereshko, 53.
V. Nanda, S. Stayrook, and W. F. DeGrado. Nature 451, 596-599 (2008).
A. Krammer, P. D. Kirchhoff, X. Jiang, C. M. Venkatachalam, and M. Waldman.
54. J Mol
Graph Model 23, 395-407 (2005).
D. K. Gehlhaar, G. M. Verkhivker, P. A. Rejto, C. J. Sherman, D. B. Fogel, L. J. Fogel, and 55.
S. T. Freer. Chem Biol 2, 317-324 (1995).
A. L. Parrill, M. Rami Reddy, American Chemical Society. Division of Computers in 56.
Chemistry., and American Chemical Society. Meeting. Rational drug design: novel method-ology and practical applications. (American Chemical Society, 1999).
I. Muegge and Y. C. Martin.
57. J Med Chem 42, 791-804 (1999).
T. Darden and D. L. York.
58. J Chem Phys 98, 10089-10092 (1981).
J. R. Schnell and J. J. Chou.
59. Nature 451, 591-595 (2008).
Q. Ding, L. Huo, J. Y. Yang, W. Xia, Y. Wei, Y. Liao, C. J. Chang, Y. Yang, C. C. Lai, 60.
D. F. Lee, C. J. Yen, Y. J. Chen, J. M. Hsu, H. P. Kuo, C. Y. Lin, F. J. Tsai, L. Y. Li, C. H. Tsai, and M. C. Hung. Cancer Res 68, 6109-6117 (2008).
T. N. Chang, G. J. Huang, Y. L. Ho, S. S. Huang, H. Y. Chang, and Y. S. Chang.
61. Am J Chin
Med 37, 797-814 (2009).
E. Gorgus, C. Lohr, N. Raquet, S. Guth, and D. Schrenk.
62. Food Chem Toxicol 48, 93-98
(2010).
Y. H. Chang, J. S. Yang, J. L. Yang, C. L. Wu, S. J. Chang, K. W. Lu, J. J. Lin, T. C. Hsia, 63.
Y. T. Lin, C. C. Ho, W. G. Wood, and J. G. Chung. Biosci Biotechnol Biochem 73, 2589-2594 (2009).
M. Schuchmann and P. R. Galle.
64. Eur J Gastroenterol Hepatol 13, 785-790 (2001).
Date Received: August 12, 2010