行政院國家科學委員會專題研究計畫 成果報告
子計劃五:膠結不良沉積岩層之非破壞性探勘與監測(I)
計畫類別: 整合型計畫 計畫編號: NSC91-2211-E-009-027- 執行期間: 91 年 08 月 01 日至 92 年 07 月 31 日 執行單位: 國立交通大學土木工程學系 計畫主持人: 林志平 計畫參與人員: 湯士弘、鍾志忠 報告類型: 精簡報告 處理方式: 本計畫可公開查詢中 華 民 國 92 年 10 月 29 日
1
行政院國家科學委員會專題研究計畫成果報告
膠結不良沈積岩層之非破壞性探勘與監測
Non-destructive Site Characterization and Performance
Monitoring in Poorly Cemented Sedimentary Rock
計畫編號:NSC 91-2211-E-009-027
執行期限:91 年 8 月 1 日至 92 年 7 月 31 日
主持人:林志平 國立交通大學土木工程系
計畫參與人員:湯士弘 國立交通大學土木工程系
計畫參與人員:鍾志忠 國立交通大學土木工程系
一、中文摘要 膠結不良沈積岩層具有孔隙大、透水 性高、岩體強度遇水容易軟化等特性,構 築於此類地層之地工結構物常因軟岩之弱 化而產生滑動破壞。有鑑於此等地層之取 樣不易,工程性質不容易掌握,本計畫之 主要目的在研究以非破壞性之方法探勘軟 弱沈積岩之力學性質及以電磁波之方法監 測地工結構物於膠結不良沈積岩之表現, 並配合其他子計畫之物理模型及現地承載 試驗進行試驗材料之調查及破壞機制之監 測與研究。本研究計畫為整合型研究計畫 『膠結不良沉積岩層大地工程行為』其中 子計畫之一,擬以三年為期,本年度(第 一年)預定完成之工作項目包括(1)表面 波震測與折射震測結合之研究;(2)電磁 波與光纖監測之研發。本報告簡述本計畫 之執行成果。 關鍵詞:軟弱岩盤、時域反射法、表面波 譜法 AbstractPoorly cemented sedimentary rock (soft rock) has high porosity and hydraulic conductivity. Geotechnical failure often occurs in this kind of material as a consequence of the decrease of shear strength upon leaching. Considering the difficulty in obtaining undisturbed samples and determining engineering properties in soft rock, the main objectives of this project are to study non-destructive seismic methods to
investigate the mechanical properties of the material and electromagnetic techniques to monitor the performance of geotechnical structures in soft rock. These investigation and monitoring techniques will facilitate laboratory model and field loading tests in other projects to study the behavior and failure mechanisms of geotechnical structures in soft rock. This report briefly describes the study result of this year.
Keywords: Soft Rock, Time Domain
Reflectometry, Spectral Analysis of Surface Wave 二、計畫緣由與目的 膠結不良沈積岩之地層甚年輕,砂岩 孔隙大、透水性高,材料性質介乎土壤及 岩石間。由於取樣不易,早期對其力學性 質及行為甚難加以掌握。86 至 88 年間由潘 以文教授擔任總計畫主持人,結合不同專 長之研究人員,共同完成『極軟弱年輕砂、 頁岩層之力學行為』整合型研究計畫。其 探討之問題以軟弱(膠結不良)砂岩的力 性質及行為決定為主,包括:如何取得完 整不擾動的試體?如何獲得足具代表性之 岩石性質(包含自然及岩石之岩相組成, 單軸、三軸強度,剪力強度,應力-應變行 為,透水性,依時行為,砂頁岩界面的力 學特性)?其弱化機制如何?力學行為如 何?等。參與之人員研發出改良式之軟弱 岩石取樣與保存技術、適合軟弱岩石使用 之高壓傍壓儀試驗(pressuremeter)儀 器、多功能軟弱岩石孔內試驗裝置、改良
2 式之現地透水試驗方法、適合軟弱岩石使 用之高壓三軸試驗系統、軟岩用微流量控 制滲透儀、以及 suspension P-S Logging 現地波速量測技術之引進。該研究主要成 果為使用這些新開發或引進的試驗技術, 進行了一系列之現地取樣、試驗與室內之 試驗,提出了決定極軟弱岩石材料力學參 數之程序與數值模擬之方法,成果已在國 內外相關之學術期刊、研討會中發表,『多 功能軟弱岩石孔內試驗裝置』並已獲得中 華民國專利(發明第一三零四五八號)。 軟岩的基本力學性質及其量化之實驗 工具已於前期研究得到相當大之進展,但 地工結構物構築於此類地層之分析與設 計,在國內外相關文獻報導都很有限,仍 需進一步研究,為進一部落實並延續上述 學術研究成果,廖志中及黃安斌教授所主 持的『極軟弱岩石的大地工程行為』整合 性研究計劃於 89 年開始執行,由筆者延續 前期調查方法之研究,研發使用時域反射 (time domain reflectometry,TDR)與 表面波頻譜分析(spectral analysis of surface wave,SASW)之現地試驗技術來 決定軟弱岩石之層次、力學特性、以及地 層位移之監測,其他子計畫則針對地工結 構物中之深基礎、淺基礎、邊坡、隧道等 進行破壞機制之研究,最終的目標為建議 合理可用的調查方法、工程分析方法與模 式(承載力、邊坡穩定、隧道分析等等)、 施工之品管與監測方法等,目前主要研究 成果包括:人造軟岩製作及測試、基礎模 型試驗設備架設、實驗站初步調查、現地 實驗場址規劃、TDR 及表面波頻譜分析設備 建立及測試。本研究群希望再以三年時間 繼續朝最終目標邁進,以詳細、準確的工 址調查,光纖及 TDR 監測系統研發及量測, 結合模型及現地試驗深入探討膠結不良沈 積地層大地工程行為。目前規劃進行之子 計畫除本子計畫外,亦包括膠結不良沈積 岩層的深基礎行為、膠結不良沈積岩層的 淺基礎行為、膠結不良沈積岩坡之行為、 膠結不良沈積岩隧道開挖之物理模型及數 值分析研究、膠結不良沉積岩邊坡受地下 水之穩定影響等。 有鑑於現地試驗的耗時、耗費、困難 性,水對膠結不良沈積岩層工程行為的重 要影響,及工程地球物理與高科技產品(例 如,光纖監測器)於土木工程探勘與監測 的未來必然與需要性,本子計畫之主要研 究目的,在於以非破壞性之方法探勘膠結 不良沈積岩層之力學性質,及以電磁波及 光波之方法監測地工結構物於膠結不良沈 積岩之表現,並配合其他子計畫之物理模 型及現地承載試驗進行試驗材料之調查及 破壞機制之監測與研究。 三、結果與討論 非破壞性震波探勘 由於折射震測與表面波震測在施測上 具有高度相似性,本計畫成功結合折射震 測與表面波震測,使用相同設備(如圖 一),分別利用走時震測影像法(ray-tracing tomography ) 及 多 頻 道 表 面 波 分 析 (Muti-channel Analysis of Surface Wave) 推求地層之 P 波與 S 波之速度剖面,如圖 二所示。
在表面波震測方面,提出兩項新的頻 散曲線分析技術,分別稱為多頻道表面波 頻 譜 分 析 法 ( Multi-channel Spectral Analysis of Surface Wave,MSASW)及頻 率 - 速度轉換分析法(Frequency-Velocity Transform,f-v transform)[1,2,3]。這兩項 新的技術可改進傳統表面波譜法(SASW) 之缺點,並可於現地即時掌控訊號品質。 本研究亦探討並量化施測參數對於量測結 果之影響,理論上,時間空間域(t, x)為 連續且無窮之波場,但施測過程僅能得到 離散且有限之波場資料,訊號之離散化 (Digitization)與截短(Truncation)將使 得波場轉換產生映頻混擾(Aliasing)與洩 漏(Leakage)。在時域方面,由於目前資 料擷取系統之取樣率遠高於震源所能產生 之最高頻率,且常設有反頻率混擾濾波器 (Anti-aliasing filter),因此可避免頻率混 擾之產生,而取樣數目通常也能有足夠之 時間長度涵蓋脈衝訊號以避免頻率之洩 漏,若使用簡諧震動震源亦可施作時域視 窗(Time-domain windowing)已降低頻率 之洩漏。然而,空間上則受限於施測範圍 與受波器個數而無法如時間域一般避開空 間之映頻混擾及洩漏,使用較小之受波器
3 間距可增加波數(或波長)之範圍,但若 受波器之數目一定,則受波器越小,展距 越小,可能造成嚴重之波數洩漏問題,空 間域視窗(Space-domain windowing)雖然 可降低洩漏問題,但也會降低波數之解析 度。然而,由於在 f-x 域裡,波場隨空間之 變化為簡諧函數之線性組合,因此其空間 之映頻混擾在 f-k 域或 f-v 域所造成之峰值 具有一定之規則,可與頻散曲線區別,因 此對於受波器最小間距之要求可大幅放 寬,因此,可利用折射震測之資料進行表 面波之分析。 在折射震測方面,除與表面波分析結 合之外,本研究比較傳統折射震測分析之 方法與先進之走時震測影像法,傳統互換 法(Reciprocal Method)之地層結構推算較 為穩定,但其分析方法之基本假設為波速 層狀結構,無法反應波速之梯度,對於地 層結構較為複雜之情形較不適用。走時震 測影像之分析方法具有高度自由度可模擬 各種地層變化,但地層結構之反算分析較 不穩定,Tomography 反算分法之穩定性是 未來可以進一步研究的方向。此外,目前 表面波所得到之速度剖面為測線展距範圍 內地層之平均值,反算模式假設該範圍內 之地層為水平層狀地層進行分析,當地層 或地形變化較大時,其正確性與適用性將 受到質疑,後續將針對此一問題進行探 討,並研發高空間解析度之表面波震測 法,與折射震測走時影像法配合,量測地 層之二維 S 波及 P 波速度剖面。 圖一 折射與表面波震測設備 0 500 1000 1500 2000 2500 -25 -20 -15 -10 -5 0 Velocity (m/s) De p th ( m ) P-wave S-wave 圖二 由折射震測資料之初達波走時及表 面波分析量測地層 P 波及 S 波之速度剖面 電磁波監測 膠結不良沈積岩層之重要監測項目包 括變形、孔隙水壓、含水量等,傳統電子 主動式監測技術之耐久性與可靠度不佳, 本研究強調被動式電磁波監測技術之開 發。電磁波監測主要利用導波管(Wave guide)之設計及時域反射(TDR)之原理, 使其可感應錯動變形、伸縮變形、孔隙水 壓、及含水量等。TDR 所發送之電磁波為引 導波(Guided Wave),以同軸電纜將電磁波 引導至需要監測之地點。利用不同機制, 時域反射法可用於監測地層錯動、變位、 孔隙水壓等物理量。本研究顯著改良現有 錯動變形與水壓量測技術,並新開發 TDR 變位計[4,5]及雨量計,使得 TDR 監測系統 具備多種邊坡所需之監測功能,可使用同 一電子儀器及多工器同時進行多點,多功 能之監測,例如圖三所示之 TDR 邊坡監測 系統[5]。 目前 TDR 錯動變形監測主要在偵測及 定位滑動面,其滑動量之大小尚無法準確 量測,為進一步研究變形之量化分析,本 研究完成剪力變形標定盒之製作(圖四), 可模擬不同剪力帶寬度,進行各項監測影 響因子之標定試驗,將進一步研究同時量 化剪力帶寬度與變形量之可能性。 除上述之研發外,本年度配合其他子
4 計畫進行淺基礎與深基礎平面地形模型試 驗之監測作業,以光纖光柵感測器埋置於 基礎模型內監測材料於加載過程中之應變 變化,用以研究基礎於軟弱沈積岩中之行 為;為有效瞭解材料之破壞機制,同時佈 設迷你同軸纜線以 TDR 監測材料之錯動變 形,由於 TDR 沿著纜線之量測為連續性, 可有效偵測任何局部剪力帶之破壞機制。 由於現有之同軸纜線勁度較大,不適合模 型試驗內部之監測,本研究以軟性材料自 行製作較為柔性且容易變形之感測纜線。 TDR rain gage TDR Extensometer TDR TDR Data Acquisition TDR shear deformation TDR piezometer 圖三 TDR 邊坡監測系統示意圖 Coaxial Cable 圖三 符合現地受力與變形條件之剪力盒 圖四 同軸纜線受剪過程之斷面變形 四、計畫成果自評 本研究主要包含震波探測與電磁波監 測兩部分,兩部分均已達成預期目標,但 部分研究亦發掘新的問題,這些問題對於 後續之研究亦極具意義。本研究之成果對 於地質調查與監測具有高度的應用價值, 震波探測之研究成果已發表兩篇研討 會論文[1,2],並有一篇國際期刊論文審查 中[3];電磁波監測部分之研究成果已發表 一篇研討會論文[6],並有一篇論文[5]及 專利[4]審查中。此外,表面波施測與分析 之標準化及 TDR 改良式水壓監測等近期研 究成果也將陸續投稿至國際學術期刊。 五、參考文獻 [1] 林志平、張正宙、鄭孟雄(2002)," 以多頻道表面波量測地層之剪力波速", 2002 岩盤工程研討會論文集,民國 91 年。
[2] Lin, C.-P., Chang, C. C., Chang, T. S., and Cheng, M. S. (2003), " Shear-wave velocities from multi-station analysis of surface wave," 3rd International Symposium on Deformation Characteristics of Geomaterials, Lyon, France, September 22 - 24, 2003.
[3] Lin, C.-P., Chang, T.-S. (2003), "Multi-station Analysis of Surface Wave Dispersion," submitted to Soil Dynamics and Earthquake engineering.
[4]林志平、湯士弘(民國 91 年),"時域 反射伸縮計,專利申請。
[5] Lin, C.-P. and Tang, S.-H., "Development and calibration of a radar extensometer using time domain reflectometry," Geotechnical Testing Journal (in review).
[6] 林志平、湯士弘、葉志翔、楊培熙、盧
吉勇(2003),"TDR 山坡地監測系統之研
發",中華民國第十屆大地工程學術研討 會,中華民國 92 年。
5
附件:封面格式
行政院國家科學委員會補助專題研究計畫成果報告
※※※※※※※※※※※※※※※※※※※※※※※※※※
※ ※
※ 軟弱岩石之探勘與監測 ※
※ ※
※※※※※※※※※※※※※※※※※※※※※※※※※※
計畫類別:□個別型計畫 ■整合型計畫
計畫編號:NSC-91-2211-E-009-027
執行期間: 91 年 8 月 1 日至 92 年 7 月 31 日
計畫主持人: 林志平 國立交通大學土木工程系
共同主持人:
計畫參與人員:湯士弘 國立交通大學土木工程系
計畫參與人員:鍾志忠 國立交通大學土木工程系
本成果報告包括以下應繳交之附件:
□赴國外出差或研習心得報告一份
□赴大陸地區出差或研習心得報告一份
■出席國際學術會議心得報告及發表之論文各一份
□國際合作研究計畫國外研究報告書一份
執行單位:國立交通大學土木系
中 華 民 國 91 年 10 月 22 日
表 Y04
行政院國家科學委員會補助國內專家學者出席國際學術會議報告
90 年 10 月 13 日 報告人姓名 林志平 服務機構及職稱 國立交通大學,助理教授 時間 會議 地點 9/22/2003 ~ 9/24/2003 法國,里昂 本會核定 補助文號92-2914-I-009-050-A1
會議 名稱 (中文)第三屆地工材料變形特性國際學術研討會(英文)3rd International Symposium on Deformation Characteristics of Geomaterials
發表 論文 題目
(中文)多頻道表面波分析之剪力波速量測
(英文)Shear-wave velocities from multi-station analysis of surface wave
報告內容應包括下列各項: (見下頁) 一、參加會議經過 二、與會心得 三、考察參觀活動(無是項活動者省略) 四、建議 五、攜回資料名稱及內容 六、其他 附 件 三
表 Y04
第三屆地工材料變形特性國際學術研討會
國立交通大學土木工程學系 林志平 一、參加會議經過第三屆地工材料變形特性國際學術研討會(3rd International Symposium on Deformation Characteristics of Geomaterials)於 2003 年 9 月 22~24 日,在法國里昂市召開。該項會 議由國際土壤力學及大地工程學會(ISSMGE)授權由法國 Encole des TPE (Civil Engineering Department - DGCB) 主辦,大會主席為法國 Prof. H. D. Benedetto 教授。研討會論文集 共收錄超過 150 篇論文,與會人士約 200 人。
二、與會心得
此次研討會區分為 6 個主題及 Session,如下所述。 (1) Testing and apparatus
(2) Characterization I (small and medium strain behavior, anisotropy …) (3) Characterization II (large strain behavior, time effects)
(4) Integrated ground behavior
(5) Modeling (rheological, mathematical, mechanical models) (6) Case history and field or physical model measurements
每個 Session 一開始為 Keynote Lecture,共有六場精彩的 Keynote Lecture,此外由 Pfof. F. Tatsuoka 發表一特別演講 Jean Biarez's Lecture。由於擔任報告的學者專家對於地工 材料皆有多年的專研,因此大部分場次都十分精彩。除了聆聽這些內容充實的專題演講外, 又可與諸多學家面對面的請益並交換意見,可說是受益良多、不虛此行。 三、建議 此次研討會有許多日本學者參與,超過 30 人與會並發表數十篇論文,國內僅交通大學三位教 授參與。國內有許多相關研究成果,未來應該多參與國際學術交流,並爭取在國內舉辦國際 學術研討會,提升國內研究水準。 四、攜回資料名稱及內容 1. 論文集一冊 2. 論文集光碟(CD-ROM Proceedings)一片
Shear-wave velocities from multi-station analysis of surface wave
C.-P. Lin & T.-S. Chang
National Chiao Tung University, Hsinchu, Taiwan
M.-H. Cheng
Institute of Planning & Hydraulic Research, Water Resources Agency, Taiwan
ABSTRACT: Site characterization using surface waves is becoming more and more popular because of its advantages over intrusive methods. Multi-station methods are presented to recommend a better procedure to construct the experimental dispersion curve including data acquisition, test configuration, and data analysis. A method based on the linear regression of phase angles measured at multiple stations are proposed for de-termining data quality and filtering criteria. This method becomes a powerful tool for on site quality control in real time. Multi-channel recording permits single survey of a broad depth range, high levels of redundancy with a single field configuration, and the ability to adjust the offset, effectively reducing near field effect, far field effect, and other coherent noise introduced during recording. The effects of multiple modes and survey line parameters, such as source offset, receiver spacing, and total length of the survey line, are investigated. The parametric study results in a general guideline for the field data acquisition. A case study demonstrates how to easily deploy commonplace seismic refraction equipment to simultaneously record data for P-wave tomographic interpretation and multi-station analysis of surface wave.
1 INTRODUCTION
Traditionally in situ loading tests and laboratory tests have been employed for evaluating deformation properties of soils and rocks. Important develop-ments in the stress-strain behavior of geomaterials in the past decade, however, have closed the gap be-tween static and (very small strain) dynamic meas-urements of stiffness. As a result, seismic methods are increasingly used to measure the shear modulus G as part of site investigation. The use of seismic methods is attractive since they are not effected by sample disturbance or insertion effects and are capa-ble of sampling a representative volume of the ground even in difficult materials such as fractured rock or gravelly deposit. At shallow depths, surface seismic methods can determine stiffness-depth pro-files without the need for boreholes that makes the subsurface seismic methods (, such as down-hole and cross-hole methods) expensive and time con-suming. Refraction survey is such a method that is widely used in geotechnical site investigation. Re-cent developments in refraction tomography allow the refraction survey to determine 2-D stiffness pro-files (Pullammanappallil & Louie 1994). While P-wave refraction survey is quite effective, S-P-wave re-fraction survey may not provide the true S-wave ve-locity because of wave-type conversion in an area of non-horizontal layers (Xia et al. 1999a). Another
type of surface seismic method makes use of surface waves. Surface-wave methods exploit the dispersion nature of Rayleigh waves. Measurements of phase velocity of Rayleigh waves of different frequencies (or wavelengths) can be used to determine a veloc-ity-depth profile. The most common method used for obtaining the dispersion curve (a plot of phase velocity versus frequency or wavelength) is the spectral analysis of surface waves (SASW) (Nazarian & Stokoe 1984; Stokoe et al. 1988).
In the current SASW practice, the dispersion curve is obtained using a two-receiver test configu-ration and spectral analysis. The SASW method gave a great contribute for the spreading of surface wave tests, but it also shows some drawbacks in field test and data analysis procedures that can be improved upon. It has been demonstrated that errors may arise in experimental dispersion curves when usual SASW test and data analysis procedures are followed, in particular the phase unwrapping proce-dure. Unwrapping errors occur for sites where, across the frequency range used, there is a shift from one dominant surface wave propagation mode to an-other, a phenomenon termed 'mode jumping' (Al-Hunaidi 1992). Even without 'mode jumping', sources that contain significant energy in very low frequencies and receivers with very low natural fre-quency are necessary to avoid erroneous unwrapping of phase angles at low frequencies which will also
affect high-frequency measurements. Hence, the data acquisition system of a SASW test is typically different from that of a refraction survey although they share many things in common. Furthermore, the use of only a pair of receivers leads to the neces-sity of performing the test using several testing con-figuration and the so-called common receiver mid-point geometry. This results in a quite time-consuming procedure on site for the collection of all the necessary data and on data reduction for combin-ing the dispersion data points from records obtained at all spacings. Since many non-trivial choices need to be made based on the data quality and testing con-figuration, the test requires the expertise of an opera-tor and automation of the data reduction is difficult.
Other two-station methods using frequency-time analysis have been proposed (Al-Hunaidi 1994, Kar-ray & Lefebvre 2000). However, the trade-off be-tween the frequency and time resolution affects the result. Practical issues such as near field and at-tenuation also make the two-station methods diffi-cult to apply. Methods based on multi-channel data and wavefield transformation possess several advan-tages for surface wave analysis (Gabriels et al. 1987; Park et al. 1999; Foti 2000). This paper thoroughly discusses the methods of multi-station analysis of surface wave in different domains. A method using only the information of phase angles is proposed as an alternative or auxiliary method to the f-k trans-formation. The effects of multiple modes and sur-vey line parameters on the experimental dispersion curve based on multi-channel data are investigated. This study also demonstrates how to easily deploy commonplace seismic refraction equipment to simultaneously determine the P- and S-wave velocity profile using refraction tomography and multi-channel analysis of surface wave.
2 SPECTRAL ANALYSIS OF SURFACE WAVE 2.1 Surface wave representation
Neglecting material damping, the surface-wave signal u (, be it displacement, velocity, or accelera-tion) for a single mode observed at a distance x from the source and a particular frequency ω (=2πf) is written as
( )
S( ) ( )
A e j e jkxej t x t x u , = 1 ω ω −ψ − ω (1) v ∆ = ) (ω φwhere S(ω) is complex source spectrum, A(ω)exp(jψ) represents the complex excitation of surface waves for a point source; k is the wave num-ber whose reciprocal λ (= 2π/ k) is the wavelength. The wave number is related to the phase velocity v by the definition ω = kv. Equation 1 represents the wave propagation and decay of a single-mode
sur-face wave. The sursur-face wave which includes multi-ple modes is given by
( )
=( )
∑
( )
− ( + m x k j m jwt A e m m e S x t x u , 1 ω ω ψ ) (2)where the index m is the mode number. The pres-ence of multiple modes complicates the interpreta-tion of phase velocity. Equainterpreta-tion 2 can be written in the form of Equation 1 as
( )
S( ) ( )
A ej x ej tx t x
u , = 1 ω ' ω φ( ,ω) ω (3)
where A'(ω) is the effective magnitude function of excitation and φ(x,ω) is a composite phase function. The position of a given characteristic point of the harmonic wave (such for example a peak or a trough) is described by constant values of the phase:
const x
t−φ( ,ω)=
ω (4)
Hence differentiating with respect to time, the local phase velocity v(x) can be defined as
x x x v ∂ ∂ = ) , ( ) ( φω ω (5)
It is very important to note that since the Rayleigh wave velocity is a function not only of the frequency but also of the distance from the source, it is a local quantity.
2.2 Measurement of dispersion curve
Surface waves in a typical SASW test are generated by an impulsive source, detected by a pair of geo-phones, and recorded on an appropriate recording device. The signals are recorded for several shots to evaluate the signal-to-noise ratio (or data coher-ence). The difference between the phase angles of the two signals (∆φ = φ2-φ1)is equal to the phase
angle of the average cross power spectrum CSD(u1,u2):
(
)
[
( ), ( )]
) ( ) ( ) ( = 2 − 1 =AngleCSDu1 t u2 t ∆φ ω φ ω φ ω (6)Following Equation 5, the apparent phase velocities of different frequencies can be determined as
x a ∆ ) (ω ω (7) where ∆x is the geophone spacing. The actual phase
difference ∆φ increases with frequency. But the angle of the crosspower spectrum oscillates between -π and -π by definition. Thus, the angle of cross-power spectrum has to be un-wrapped before apply-ing it to Equation 7. This unwrappapply-ing process is of-ten a ticklish task. The correctness of unwrapping at high frequencies relies on that at low frequencies.
The energy generated by an impulsive source is band-limited, with low signal-to-noise ratio at very low and high frequencies. Geophones act as high-pass filters that damp the low-frequency components below the natural frequency of the geophones. Therefore, the signal-to-noise ratio of the signals is low below a particular frequency depending on the source and receiver characteristics. Consequently, unwrapping may be erroneous, especially for large geophone spacing since larger geophone spacing implies greater number of cycles in the phase spec-trum. Removing of these unwrapping errors is time consuming and depends on the analyst's judgment and experience. The natural frequency of geophones used for typical refraction survey is equal to or greater than 4.5 Hz, hence not suitable for SASW test. Wave Form Analyzer rather than typical seis-mograph is preferred because it has built-in spectral functions necessary for instantaneous inspection of the recorded data.
3 MULTI-STATION ANALYSIS OF SURFACE WAVE
3.1 Multi-station spectral analysis of surface wave (MSASW)
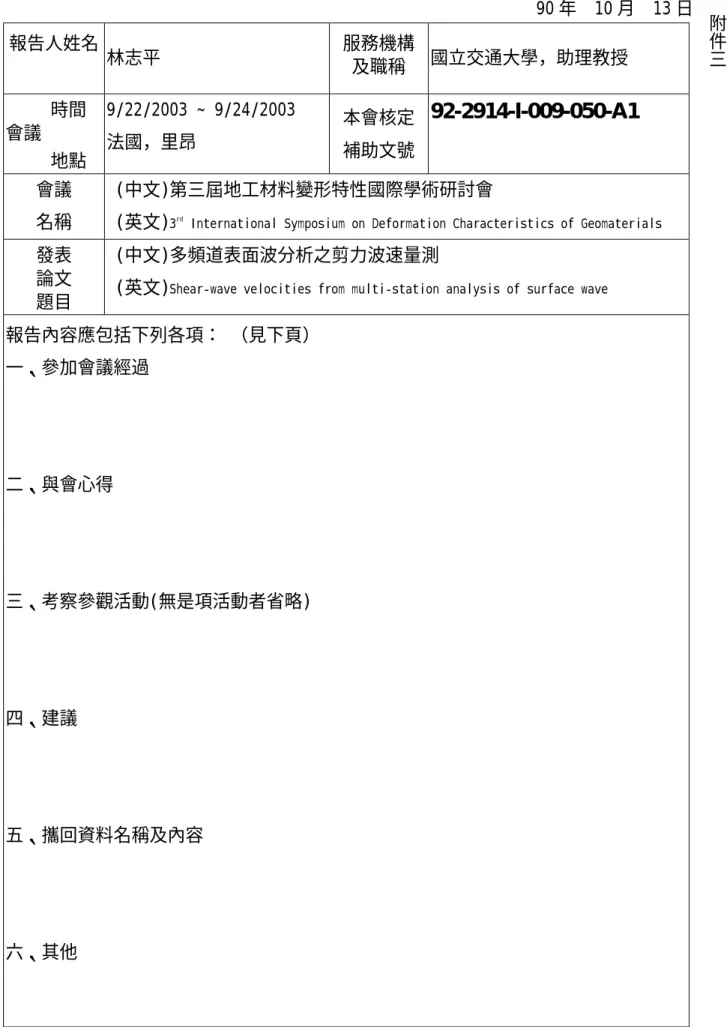
The SASW method uses a minimum number of sig-nals in space to determine the slope of φ(x) for Equa-tion 7. The phase angles are un-wrapped in fre-quency domain. Errors in estimating the phase difference transform directly into errors in phase ve-locity calculation. Better estimation of dispersion curve can be obtained based on a multi-station test configuration (Figure 1), in which receivers are lo-cated at several locations along a straight line and a different data reduction scheme is used. Consider a wavefield u(t,x) of a single-mode surface wave at a particular frequency, as shown in Figure 2 (v = 200 m/s and f = 10 Hz in this case). The wavefield is sampled (discretized) in both the time and space domain during data acquisition. The sampling rate in the time domain and space domain are ∆t and ∆x, respectively. The single-frequency wavefield is ob-tained experimentally using a vibratory source or from the Fourier decomposition of a broadband im-pulsive wavefield. The Fourier transform of the wavefield u(t,x) with respect to time produces U(f,x) with a modulo-2 π representation in the phase spec-trum. The phase angle can be un-wrapped in the space domain since it monotonically increases with the source-to-receiver offset x, as shown in Figure 3. The phase velocity is clearly seen as the ratio of the wavelength (λ) to the period (T) in the wavefield (Figure 2). It can be calculated numerically using Equation 5. The slope of φ(x) is determined by the linear regression of the data φ(xi). The data quality
can be evaluated by the coefficient of correlation (R2) of the regression analysis. This method for
de-termining the dispersion curve can be applied to both transient and stationary harmonic signals.
:Source
:Geophone
L x1 dx
1 2 N-1 N
Figure 1. A scheme of multi-station surface wave testing, in which x1 is the near offset, dx is the geophone spacing, and L
is the length of the survey line.
Figure 2. An example wavefield of a single-mode surface wave (f = 10 Hz, v = 200 m/s in this case).
Figure 3. An illustration of phase unwrapping in the space do-main for the multi-stationl spectral analysis of surface wave.
Figure 4. Amplitude spectrum of the f-k analysis. The wave number of the surface wave is identified at the peak value.
Alternatively, the phase velocity may be deter-mined by the f-k analysis (Gabriels et al. 1987). Figure 4 shows the amplitude spectrum of the Fou-rier transform of U(f,x) with respect to space. The wave number (k) of the surface wave can be identi-fied at the peak of the amplitude spectrum. The phase velocity is determined by the definition v = 2πf/k. The linear regression method (referred to as the MSASW method in this paper) is equivalent to the f-k transform method but differs in practice. The MSASW method uses only the information of the phase and does not require constant geophone spac-ing. Furthermore, the data quality can be evaluated and filtering criteria may be determined in the φ(xi)
plot. The advantage of f-k transform method is that the unfolding procedure is completely avoided. These two methods are used collaboratively in prac-tice. But this paper focused more on the discussion of MSASW method comparing to the conventional SASW method. The MSASW method measures the phase angles at several offsets from the source, φ(xi),
rather than just the phase difference ∆φ between two geophone locations. It does not require the geo-phones to be placed at equal distance. However, the geophone spacing should be less than half the de-sired shortest wavelength to avoid aliasing that may cause errors in phase unwrapping. The phase-unwrapping step is still inevitable in MSASW analysis. But the linear regression attenuates the ef-fect of possible phase-unwrapping errors because it's the slope that counts instead of the absolute value of phase difference. Moreover, unwrapping in space domain has an advantage that poor data at very low frequencies can simply be discarded without affect-ing the results at higher frequencies. This is impor-tant for automating the construction of the disper-sion curve.
3.2 Effects of higher modes
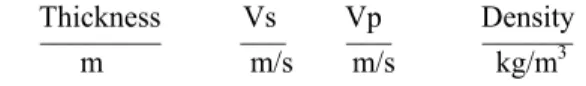
The number of available receivers limits the number of locations where the wavefield can be measured for a single shot. However, a wide range of source-to-receiver offsets can be covered by the walk-away test, as shown in Figure 5, in which the source is moved away from the receivers to increase the near offset. The phase angle increases linearly with the source-to-receiver offset for a single mode of surface wave. However, when there are multiple modes, φ(x) becomes non-linear. Consider the wavefield of a surface wave consisting of two modes (f = 10 Hz, v0 = 200 m/s, v1 = 400 m/s) as shown in
Figure 6. Figure 7 shows that φ(x) oscillates around the linear line of the dominant mode with an oscilla-tion wavelength equal to 2π/∆k, where ∆k = k0-k1.
The linear regression of the data φ(xi) represents φ(x)
of the dominant mode if the total length of the sur-vey line is long enough. It is possible to isolate
dif-ferent modes in the un-wrapped phase spectrum from the difference between the measured φ(x) and the regression line. However, f-k transform method is more effective in mode separation when more than two modes present. Figure 8 shows the ampli-tude spectrum of the f-k transform with two peaks indicating two different modes. Lower peaks in the amplitude spectrum may also be resulted from the leakage due to truncation of the infinite wavefield. The difference between the measured φ(x) and that of dominate mode can assist in determining whether the peak is due to the multiple modes or leakage. The ability to separate two modes depends on the length of the survey line (L) and how close these two modes are. The mode separation is possible when
k L
∆
>2π (8)
where ∆k is the difference in wave number for the two modes. The single peak in the f-k amplitude spectrum corresponds to the apparent velocity re-sulted from the two modes if the above criterion is not satisfied. This apparent phase velocity is equivalent to that obtained by the linear regression of φ(xi).
For a normally dispersive profile in which the fundamental mode dominates, φ(x) is a good linear function for each frequency and the apparent phase velocity is coincident with the fundamental mode. The experimental dispersion curve can be inverted for the shear wave velocity profile by considering only the fundamental mode. However, a higher mode or multiple modes dominate in some fre-quency range, especially for deposits with Vs
vary-ing irregularly with depth. (Tokimatsu et al. 1992). Figure 7 conceptually illustrates the effect of modal superposition on the apparent phase velocity. It is desirable to further investigate the effect of higher modes in the context of an inversely dispersive pro-file and MSASW.
Consider a shear wave velocity profile of regular stratification overlaid by a harder surface layer, as shown in Table 1, same as that considered by Foti (2000). Higher modes dominate in some frequency range in such a case. Synthetic seismograms are generated using the modal superposition of surface waves (Herrmann 2002) for source-to-receiver off-sets from 1m to 256 m on a 1-meter intervals. The sampling period of the synthetic seismograms is 0.002 sec and the number of data points is 1024. Body waves (near field effects) are not considered in the modal superposition to simplify the study of the effect of multiple modes.
Table 1. A system with a harder surface layer ______________________________________
Thickness Vs Vp Density ________ ___ ___ ______ m m/s m/s kg/m3
3 450 800 1800 5 350 600 1800 10 400 700 1800 ∞ 450 800 1800 ______________________________________ :Source :Geophone L (N-1)dx dx 1 2 N dx (N-1)dx
Figure 5. A scheme of walk-away testing procedure.
Figure 6. An example wavefield of a multi-mode surface wave (f = 10 Hz, v0 = 200 m/s and v1 = 400 m/s in this case).
Figure 7. Effects of multiple modes on the phase angle as a function of source-receiver offset. The phase velocities at 10 Hz for Mode 0 and Mode1 are 200 m/s and 400 m/s, respec-tively. The amplitude ratio of Mode 0 to Mode 1 is 6:4.
Figure 8. Amplitude spectrum of the f-k analysis of the multi-mode wavefield. The wave numbers of multiple multi-modes are identified at the peak value.
The synthetic data was analyzed by the MSASW method. Figure 9 shows the dispersion curves for a small offset range (L = 23 m) and a large offset range (L = 255 m). Also shown in Figure 9 are the Rayleigh modes. When the offset range is large enough, the resulting dispersion curve becomes piece-wise continuous curve with sudden jumping modes when different modes dominate at different frequencies. In cases where L is not long enough to obtain φ'(x) of the dominant mode, the resulting smooth curve represents the apparent dispersion curve of the test configuration, which typically has a smooth transition between modes. The dispersion curve obtained from the maximum peaks in the f-k spectrum is the same as that obtained by the linear regression of φ(xi). In addition, participating modes
can be identified using the f-k analysis when Equa-tion 8 is satisfied. In practice, the length of the sur-vey line is restricted by the available space, near field effect and attenuation. And it is not known a priori if L is long enough to obtain individual modes. Current practice in the inversion process utilizes only the fundamental mode. The model compatibil-ity between the experimental and theoretical disper-sion curve has to be considered in cases where the apparent dispersion curves do not coincide with the fundamental mode.
The synthetic data was also analyzed using the SASW method. The SASW test was simulated in-cluding the following geophone spacings: 1 m, 2 m, 4 m, 8 m, 16 m, 32 m, 64 m, 128 m. The usual fil-tering criterion (λ/3 < geophone spacing < 2λ) was applied to the constructed dispersion curves. The experimental dispersion curves obtained by the SASW method are also shown in Figure 9. The dis-persion curve segments obtained for different geo-phone spacings follow the trend of the apparent dis-persion curve obtained by first 24-channel MSASW. The scatter of the SASW data in this synthetic case is due solely to multiple modes. Different geophone spacings in a SASW test may produce quite different phase velocities at the same frequency even after the
filtering process. It should be noted that Equation 7 is a measure of the apparent phase velocity. The dispersion curve of the predominant mode is ob-tained only if one mode dominates. The filter crite-ria do not ensure the condition that the measured wavefield is comprised of only one mode; they merely mitigate the effects of near field and attenua-tion. The wide scatter of the data in the field may be attributed to multiple modes as much as to the noise. Combining the scattered data produced by different geophone spacings in a SASW test is an extra work that may result in extra uncertainty.
The fact that the apparent phase velocity is de-fined by the receiver locations relative to the source has to be emphasized in the case of multiple modes. Figure 10 shows the effect of near offset (x1) on the
apparent dispersion curves for a small offset range (L = 23 m). The dispersion curve obtained for x1 = 1
m differs from that for x1 = 20 m. No one is better
than the other, if near field and attenuation effects are not considerer. The frequency resolution ∆f is equal to 0.4883 in Figure 9. The results are shown for every 4∆f. To obtain phase velocities at fre-quencies of integer number, only the first 1000 points of the seismic records were used so that ∆f is equal to 0.5 Hz in Figure 10. The circles in Figure 9 and 10 represent the same multi-station testing configuration. The results are slightly different at frequencies around 60 Hz and 100Hz. These regions correspond to mode jumping and frequencies of low energy in the synthetic data. Also shown in Figure 10 are the results of the SASW analysis for ∆f = 0.5 Hz. The segments of dispersion curves are more scattered in this case. The results for geophone spacing 2m and 4m even fall out of the plotting range. The SASW method is more sensitive to noise and mode jumping, especially in the phase unwrap-ping procedure. Unwrapunwrap-ping the phase angles in the space domain is more robust than unwrapping in the frequency domain. The synthetic data shows no dif-ference in the apparent velocities obtained by linear regression and f-k analysis.
4 EXPERIMENTAL STUDY 4.1 Effects of survey line parameters
In practice, the available testing space, source char-acteristics, near field effect, and attenuation restrict the range of source-to-receiver offsets where φ(x) can be measured accurately for a particular fre-quency. Hence, the apparent velocity in a MSASW test is determined from the average slope of φ(x) over some source-to-receiver offsets, where φ(xi)
varies smoothly with xi. The selection of the proper
offset range is analogous to the filtering criteria in the SASW test. However, the filtering process in the SASW test is applied to the constructed dispersion curve, in which the high-frequency values may have
already been contaminated by the poor data at low frequencies due to near field effect or low signal-to-noise ratio at low frequencies.
To avoid spatial aliasing, geophone spacing (dx) should not be greater than half the shortest wave-length, which is approximately equal to the mini-mum definable thickness. The MSASW method does not require a long survey line for normally dis-persive profiles. Although a long survey line is de-sirable to identify individual modes in Rayleigh waves when multiple modes participate, it is often impractical and it is not known a priori how long is long enough. A short survey line may be acceptable for multi-mode surface waves if the location-dependent apparent dispersion curve is taken into consideration in the inversion process. Therefore, it is possible to obtain the dispersion curve for the de-sired frequency range with a single test configura-tion. Experiments were conducted at a test site to investigate the effect of near offset (x1) on
multi-station measurements. Twenty four geophones were deployed on a 1 m interval with the near offset rang-ing from 10 to 30 m. The seismograph is a 24-channel OYO McSeis-SX. The geophones are OYO Geospace model GS-11D vertical velocity trans-ducer, having a natural resonant frequency of 4.5 Hz. A 6-kg sledgehammer was used as the impul-sive source. 0 20 40 60 80 100 120 350 360 370 380 390 400 410 420 Frequency,Hz P h a s e v e lo c ity ,m /s Rayleigh modes MS A S W (L=23m) MS A S W (L=255m) S A S W
Figure 9. Effect of L on the measured dispersion curve (x1 = 1m; dx =1m)
0 20 40 60 80 100 120 350 360 370 380 390 400 410 420 Frequency,Hz P h a s e v e lo c ity ,m /s Rayleigh modes MS A S W (X 1=1m) MS A S W (X 1=20m) S A S W
Figure 10. Effect of near offset on the measured dispersion curve (dx = 1m; L=23 m)
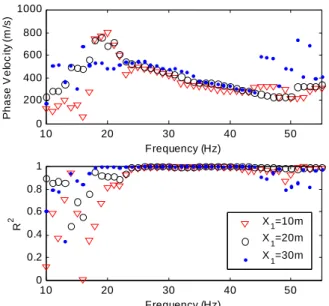
Figure 11 shows the measured dispersion curve and R2 for near offset 10m, 20m, and 30m. Higher modes dominate at frequencies greater than 50 Hz as shown in Figure 11 for x1 = 10 m. The interference
of higher modes at frequencies above 50 Hz is con-firmed by the f-k analysis. Because of undesirable near-field effects, Rayleigh waves can only be treated as horizontally traveling plane waves after they have propagated a certain distance from the source point (Richart et al. 1970). Plane-wave propagation of surface wave does not occur in most cases until the near offset (x1) is greater than half the
maximum desired wavelength. Acceptable data ex-tends to lower frequencies as near offset increases as expected, as shown in Figure 11. However, there is a mitigation of near field effects on the dispersion curve estimation by the linear regression of multi-station data. The measurable frequency also de-creases as near offset inde-creases. Although it is gen-erally true that surface wave is much more energetic than body waves, the high-frequency (short-wavelength) components lose their energy quite rap-idly because they normally propagate through the shallowest veneer of the surface where attenuation is most significant. Contamination by body waves be-cause of attenuation of high-frequency ground roll at longer offsets is referred to as the far field effect (Partk et al. 1999). This effect limits the highest frequency at which phase velocity can be deter-mined.
Near field and far field effects affect the measur-able frequency range for each test configuration (Figure1). If a greater range of frequency is of in-terest, a wide range of offsets can be obtained by a walk-away test. And the optimum offset range for each frequency can be selected from the plot of
φ(xi). This filtering process improves the data
accu-racy and further extends the measurable frequency range. However, different locations of the geo-phones used to determine the phase velocity for each frequency should be taken into account in the case
of multiple modes. The source characteristic, back-ground noises, and geological conditions also play important roles in the measurable frequency range. The MSASW analysis can be performed in real time on site for quality control. Results like Figure 11 can be obtained instantaneously after the data acqui-sition. Necessary adjustments to the testing proce-dure can then be made.
4.2 MSASW interpretation of refraction data
The same type of geophones used for body-wave surveying can be used for MSASW tests. The field configuration of a MSASW test is similar to that for body-wave surveying with only a slightly different criterion for selecting the optimum field configura-tion and acquisiconfigura-tion parameters. In many cases the surface wave analysis can be performed coincident with or as a by-product of the body-wave surveying. An example is presented herein to show how to ana-lyze the same refraction surveying data with P-wave refraction tomography and MSASW method to si-multaneously estimate the P- and S-wave velocity profile. A P-wave refraction survey was conducted in a project involving the investigation of a fault near the Science and Technology Park in Hsinchu, Taiwan. The same equipment described above was used in this project. Twenty-four geophones were deployed on a 5 m interval. Seven shots were gen-erated to obtain wide ray coverage for the tomogra-phy analysis with 5 shots inside the survey line and two end shots outside the survey line. During the classical refraction tests using impact sources, the recording time was increased in order to detect Rayleigh waves. The traveltime tomography analy-sis using the commercial software SeisOptProTM
Version 1.0 utilized all data from the seven shots. The resulting P-wave tomogram justifies the as-sumption of horizontal layering of the subsurface for the surface wave analysis. The data generated by the shot near the first geophone was used for surface wave analysis. Figure 12 presents the experimental dispersion curve and R2 of the linear regression. A higher mode dominates at frequencies above 27 Hz. The part of experimental dispersion curve between 7 and 27 Hz is identified as the fundamental mode and used for data inversion. A non-linear inversion is made with the method developed by Xia et al. (1999b). The velocity profile obtained from the re-fraction tomography analysis provides Vp values in
the inversion process. The inverted shear wave and compression wave velocity profiles are shown in Figure 13. This example demonstrates how one can effectively obtain P- and S-wave simultaneously from a single seismic survey using traveltime tomo-graphy and MSASW technique.
10 20 30 40 50 0 200 400 600 800 1000 Frequency (Hz) P h as e V e lo c it y ( m /s ) 10 20 30 40 50 0 0.2 0.4 0.6 0.8 1 Frequency (Hz) R 2 X 1=10m X 1=20m X 1=30m
Figure 11. Experimental dispersion curves and R2's for
differ-ent near offsets (dx =1 m and L = 23 m).
5 10 1 5 20 2 5 30 2 00 3 00 4 00 5 00 6 00
Fre que ncy (Hz)
P h a s e V e lo c it y ( m /s ) 5 10 1 5 20 2 5 30 0 0 .5 1
Fre que ncy (Hz)
R
2
Figure 12. Experimental dispersion curve and R2 obtained by
MSASW analysis of a refraction surveying data.
Figure 13. The S- and P-wave velocity profiles of the refrac-tion test site.
5 CONCLUSION
This study is aimed at discussing the multi-station analysis of surface wave to recommend a better pro-cedure to construct the experimental dispersion curve including data acquisition, test configuration, and data analysis. The multi-station spectral analy-sis of surface wave (MSASW) and f-k transform method utilize commonplace seismic refraction equipment for data acquisition and a test configura-tion similar to body-wave surveying. The multi-station methods solve the problems encountered in the traditional SASW test. The MSASW method is based on the linear regression of phase angles meas-ured at multiple stations, in which data quality can be evaluated and filtering criteria can be determined. It is a power tool for on site quality control in real time. When used together with f-k transform, MSASW selects the proper range of offsets for con-structing the dispersion curve and assist in multiple mode identification.
The effects of multiple modes on multi-station measurements are investigated and the criterion of mode separability is discovered. The length of sur-vey line required to separate two modes is inversely proportional to the difference in wave number. The experimental dispersion curve represents the loca-tion-dependent apparent dispersion curve for multi-mode surface waves when the survey line is not long enough. The modal compatibility between the ex-perimental and theoretical dispersion curve needs to be considered in the inversion process. In practice, the available testing space, source characteristics, near field effect, and attenuation restrict the range of source-to-receiver offsets where the phase angles can be measured accurately for each frequency. A walk-away test plus the filtering process gives the best coverage of frequencies. The linear regression mitigates the near field effects. It is often possible to obtain the dispersion curve for the desired fre-quency range with a single test configuration. A case study demonstrates how to analyze classical re-fraction data with P-wave rere-fraction tomography and MSASW method to simultaneously estimate the P- and S-wave velocity profiles.
6 REFERENCES
Al-Hunaidi, M. O. (1992), "Difficulties with Phase Spectrum Unwrapping in SASW Nondestructive Testing of Pave-ments," Canadian Geotechnical Journal, 29, pp. 506-511. Al-Hunaidi, M. O. (1994), "Analysis of Dispersed Multi-mode
Signals of the SASW Method using Multiple Filter/Cross Correlation Technique," Soil Dynamics and Earthquake Engineering, 13, pp. 13-24.
Foti, S. (2000), "Multistation Methods for Geotechnical Char-acterization Using Surface Waves,", Politecnico di Torino, Ph.D. Dissertation.
Karray, M. and Lefebvre, G. (2000), "Identification and Isola-tion of Multiple Methods," Geophysical Methods in Con-struction, Geotechnical Special Publication No. 108, ASCE, pp. 80-94.
Nazarian, S., and Stokoe, II K. H. (1984), "In situ Shear wave velocities from Spectral Analysis of Surface Waves,” Proc. 8th
Conf. on Earthquake Eng. - S. Francisco, Vol. 3, pp. 38~45.
Gabriels, P., Snieder, R., and Nolet, G. (1987), "In situ Meas-urements of Shear-wave Velocity in Sediments with Higher-Mode Rayleigh Waves," Geophysical Prospecting, 35, pp. 187-196.
Herrmann (2002), "Computer Programs in Seismology,"An Overview of Synthetic Seismogram Computation, Ver. 3.20, Saint Louis University, Missouri (USA).
Park, C. B., Miller, R. D., and Xia, J. (1999), "Multichannel Analysis of Surface Waves," Geophysics, Vol. 64, No. 3, pp. 800-808.
Pullammanappallil, S. K., and Louie, J. N. (1994), "A General-ized Simulated-Annealing Optimization for Inversion of First Arrival Times," Bulletin of the Seismological Society of America, Vol. 84, No. 5, pp. 1397-1409.
Richart, F. E., Hall, J. R., and Woods, R. D. (1970), "Vibra-tions of Soils and Founda"Vibra-tions," Prentice-Hall, Inc.
Stokoe, II K. H., Nazarian, S., Rix, G. J., Sanchez-Salinero, I., Sheu, J. and Mok, Y. (1988), "In situ Seismic Testing of Hard-to-sample soils by Surface Wave Method," Earthq. Eng. and Soil Dyn. II-Recent Adv. in Ground-motion Eval. - Park City, pp. 264-277.
Tokimatsu, K. Tamura, S. and Kojima, H. (1992), "Effects of Multiple Modes on Rayleigh Wave Dispersion Characteris-tics," Journal of Geotechnical Engineering, ASCE, Vol 118, No. 10, pp. 1592-1543.
Xia, J. Miller, R. D., and Park, C. B. (1999a), "A pitfall in shallow shear-wave refraction surveying," SEG 1999 Ex-panded Abstracts.
Xia, J. Miller, R. D., and Park, C. B. (1999b), "Estimation of Near-surface Shear-wave Velocity by Inversion of Rayleigh Waves," Geophysics, 64, pp. 691-700.