行政院國家科學委員會專題研究計畫 成果報告
自來水管網決策支援系統
計畫類別: 個別型計畫 計畫編號: NSC93-2211-E-009-020- 執行期間: 93 年 08 月 01 日至 94 年 07 月 31 日 執行單位: 國立交通大學環境工程研究所 計畫主持人: 高正忠 計畫參與人員: 李沛濠 報告類型: 精簡報告 報告附件: 出席國際會議研究心得報告及發表論文 處理方式: 本計畫可公開查詢中 華 民 國 94 年 10 月 17 日
行政院國家科學委員會補助專題研究計畫
■ 成 果 報 告
□期中進度報告
自來水管網決策支援系統
計畫類別:■ 個別型計畫 □ 整合型計畫
計畫編號:NSC 93 - 2211 - E - 009 - 020 -
執行期間: 93 年 8 月 01 日至 94 年 7 月 31 日
計畫主持人:
高 正 忠
共同主持人:
計畫參與人員: 李 沛 濠
成果報告類型(依經費核定清單規定繳交):■精簡報告 □完整報告
本成果報告包括以下應繳交之附件:
□赴國外出差或研習心得報告一份
□赴大陸地區出差或研習心得報告一份
■出席國際學術會議心得報告及發表之論文各一份
□國際合作研究計畫國外研究報告書一份
處理方式:除產學合作研究計畫、提升產業技術及人才培育研究計畫、
列管計畫及下列情形者外,得立即公開查詢
□涉及專利或其他智慧財產權,□一年□二年後可公開查詢
執行單位:
中 華 民 國 九十四 年 十 月 日
一、摘要 本研究結合數個模式及公開原碼地理資訊工具發展基於制水閥分區之決策分析支援系 統,以輔助工程人員或決策者快速分析自來水管網系統的損壞影響。該系統以 depth-first 演算法判識自來水管網中的制水閥分區,並以線上地理資訊介面呈現判識結果。亦發展另 ㄧ個 depth-first 演算法判識會影響下游分區供水而增加損壞影響缺水量的關鍵分區。藉由所 建立的制水閥分區輔助管網,可有效的分析單一或多管線損壞事件的損壞影響缺水量及其 影響範圍。關閉損壞分區所造成的供水影響是以 EPANET2 模式模擬。本研究並應用三重 自來水管網案例示範所發展的各項輔助分析工具與系統的實用性及可行性,所發展的系統 可輔助管理發生在單一或多制水閥分區的損壞管線,縮減維修時程。此外,由於集水區會 影響水源的供水穩定度與品質,有必要建立一些指標了解集水區的狀況,因此嚐試結合所 發展之各項工具建立一個雛型系統,以作為未來發展集水區永續指標系統之依據。 關鍵詞:決策支援系統、制水閥分區、自來水管網、環境系統分析、集水區永續指標系統
Abstract: A segment-based analysis system is developed, using several models and an open
source Web geographic information system (GIS) toolkit, to assist a manager or engineer in analyzing the vulnerability of a water distribution network (WDN). Valve-enclosed segments of a WDN can be efficiently identified by the system using a depth-first search algorithm and illustrated by the Web-GIS. Critical segments, whose failures can cause a significant impact on downstream segments and associated water supply, are identified by the other depth-first search algorithm. With the auxiliary network established from the identified segments, the impact of one or multiple pipe failures can be practically evaluated and the area affected by each failure event can be rapidly delineated. The impacts of segment failures on water distribution are simulated by EPANET2. A case study for a local WDN is implemented to illustrate the applicability of the developed system. The system is able to effectively assess the segment-based vulnerability of a WDN and to improve the management and responsive actions for single or multiple segment failures. To assure the upstream catchment of a WDN being able to continuously supply stable and safe water, a prototypical index system is also developed in this study to evaluate the environmental sustainability of a catchment.
Keywords: Decision support system; segment; valve; water distribution network; network
analysis; environmental systems analysis; environmental sustainability index system; algorithm. 二、前言與研究目的
In order to provide consumers with a safe, potable and stable supply of water, a water distribution network (WDN) must be properly maintained. However, the frequency of network failures for a WDN increases as its pipes age, and subsequently a significant amount of valuable drinking water may be wasted. Therefore, identification for vulnerable portions of a WDN is important for improving the management efficiency in reducing the impacts caused by failed pipes. Conventionally, analyses for WDNs generally regarded each pipe as an independent unit (Fujiwara and Li, 1998; Shamir and Howard, 1979). However, independent pipes exist only when there are valves on both ends of the pipe that can isolate peripheral water supply during an event of damage, so that maintenance or replacement can be undertaken. Although the design guideline proposed by Mays (2000) suggests placement of valves at both ends of each pipe, most old or even new local water distribution systems have not installed so many valves because of
budget limitations. As Walski (1993) discussed, for actual systems in the real world, this type of network does not exist. When there is damage to a pipe, it is necessary to close off all peripheral valves in order to perform maintenance. Consequently, the damage does not merely impact the failed pipe; rather, the impact extends to areas which are isolated by closed valves, as well as the neighboring water supply. As a result, if the impact analysis is based only on independent pipes, it may lead to the scope of impact being underestimated. Therefore, analyses of WDNs are suggested to be implemented based on valve-enclosed segments instead of individual pipes.
三、文獻回顧
The idea that water distribution network analyses should consider the influence of valve-enclosed segments in the system was proposed as early as in 1987 by Walski (1987). Walski (1993) also defined that if a segment linked with other segments by only one pipeline was regarded as a critical one. The moment damage occurs to such a critical segment, there is an impact not only on the water supply for that segment, but also on other connected downstream supply, making the scope of the impact much greater. Although valve-enclosed and critical segments may be manually identified from a network plot, this manual method, in a large system, is inconvenient, tedious and prone to error, especially for a complex WDN. Walski (1993) suggested a breath-first search method to find critical segments. The searching procedure is, however, tedious for storing trees emanating from each junction, and might be time-consuming for a large WDN. Two depth-first searching algorithms were therefore developed in this study to effectively identify valve-enclosed and critical segments, respectively.
As pointed out by Mays (2000), analysis for a WDN should not consider only the topology of the network but also the hydraulic effects. The analysis for the vulnerability in a WDN based only on valve topology without hydraulic effects is not practical. The segments that not directly cut off by a failed segment may still be influenced hydraulically. Hydraulic analyses are generally simulated by mathematical models. EPANET2 developed by U.S. EPA (Rossmann, 2000) is one of such models that is widely used and is able to perform extended-period simulation of hydraulic movement in a WDN. The EPANET2 model is thus integrated into the system for hydraulic simulation of failure events, to complete a comprehensive analysis for the vulnerability of a WDN.
A geographic information system (GIS) is an efficient spatial data management and analysis tool for WDNs to facilitate the evaluation of results obtained from alternative optimization strategies (Taher and Labadie, 1996). GeoTools, an open source GIS tool, provides sufficient functions to manipulate GIS data and was thus used to construct a user-friendly operation interface for the developed system.
Previous studies had proposed various optimization models for improving WDN management and operation, but those models are usually too complex to be applied to real WDNs. A decision support system integrating optimization and hydraulic simulation models with a user-friendly interface is an efficient tool to overcome this difficulty (Taher and Labadie, 1996; Huang et al., 1995; Goulter, 1992). Although Taher and Labadie (1996) and Huang et al. (1995) have integrated optimization models and GIS to determine network routing and design, no proper DSS is available to facilitate analyses and management for failure events in WDNs. A DSS
integrates the depth-first segment identification algorithms, EPANET2, and a GIS interface implemented by GeoTools has thus been developed to analyze failure events and to present the analyzed results visually to improve the efficiency of failure management.
四、研究方法
System Architecture
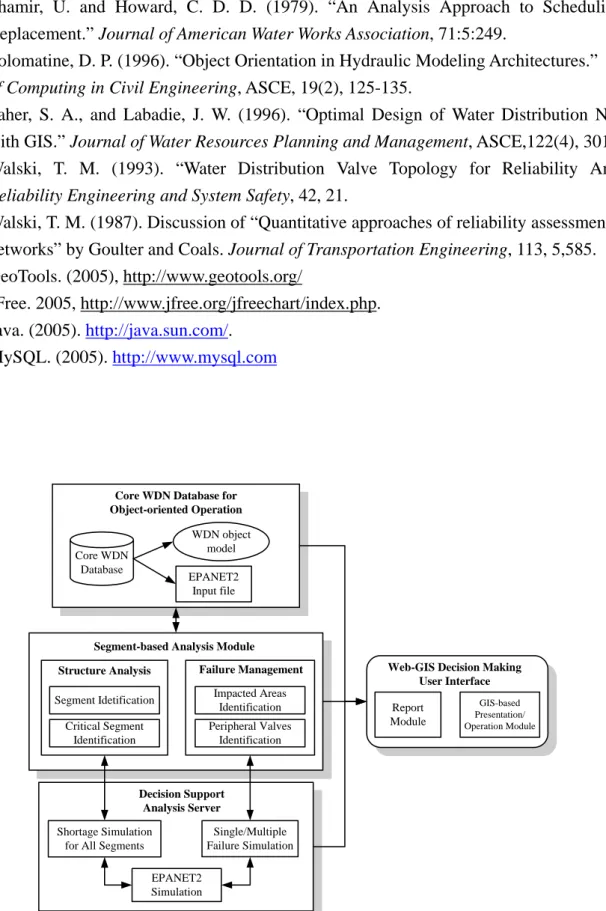
The proposed system is intended to assist an engineer in analyzing the structure of a WDN system and improving the efficiency of pipe failure management. As the system architecture illustrated in Fig. 1, the developed Web-GIS system includes four major components: (1) a core database for storing and retrieving the information of WDN instruments or objects; (2) a segment-based analysis module for WDN structure analysis and failure management; (3) a decision support analysis server for simulating failure events and sending back results to the user; and (4) a friendly Web-GIS user interface for WDN presentation and analysis. These components are briefly described below, while major approaches or functions are described in detail in later sections.
Core WDN Database for Object-oriented Operation
WDNs are generally complex and an appropriate data structure is desired to present a network in a way that can facilitate subsequent analyses (Solomatine, 1996). The topology of a WDN, presenting connections between pipes and junctions, and hydraulic settings of network components are required for further analyses. A core WDN database has therefore been developed by using MYSQL (MySQL, 2005), a relational database tool. The structure of data tables are designed according to the properties of associated objects defined in the developed object-oriented software written in Java computer language (Java, 2005). WDN components such as a pipe, a valve, a node, a segment and a storage tank with related attributes are expressed as individual objects, and a large WDN object is constructed to consist of these component objects. The object-oriented model derived from the model proposed by Solomatine (1996) is adopted herein to construct a system module for working with varied analysis tools. With the database and internal object-oriented module, the hydraulic properties and behaviors can be encapsulated into related WDN objects and the data for a WDN can be handled through an object-oriented interface designed using JDBC (Java, 2005). Related analysis tools can be thus effectively modularized with specific functions to handle WDN objects. The developed system provides a function to convert the WDN objects into a formatted EPANET2 input file for hydraulic simulation. Input files for other hydraulic simulation or analysis tools can be created by adding additional functions using the object-oriented interface, if desired. The object-oriented modularization can significantly improve the flexibility and extensibility of the system.
Segment-based Analysis Module
An analysis module has been developed for identifying both valve-enclosed and critical segments and implementing failure analyses. Critical segments, as described by Walski (1993), are those segments, once failed, can cut off water supply for downstream segments. They are
generally difficult to be manually identified from a complex WDN plot. This module implements the algorithms for identification of valve-enclosed and critical segments, converts the original WDN into an auxiliary network in which each node represents an identified segment, and identifies the impacted areas and peripheral valves for single or multiple failed pipes for further impact analyses. Results with spatial properties are presented by a Web-GIS interface with geo-referenced map layers for intuitive interpretation.
Decision Support Analysis Server
The shortage impacts caused by failures in segments are simulated by EPANET2, a mathematical hydraulic model developed by Rossman (2000). A decision support analysis server providing hydraulic simulation functions for shortage and failure has been developed. The server can implement multi-thread executions for different hydraulic simulations independently and allows to serve multi-users at the same time. Once the server receives simulation requests from users, the associated simulations are invoked. The simulations are implemented by a program written in C language with the toolkit provided by EPANET2 to improve the computational efficiency. Simulation results are stored in formatted files and sent back to the user. All results can be presented by geo-referenced map layers by the Web-GIS interface or statistical charts for further interpretation.
This client-server structure of the analysis system is implemented with the Java Socket to establish a communication channel between both client and server sides. To balance the responsive time and computational burden, simple analyses such as segment identification are performed on the client side, and complicated ones that require simulation models are executed on the server side computer. The efficiency of decision analyses can be thus enhanced.
Web-GIS Decision Analysis Interface
A typical decision analysis procedure for WDNs usually requires intensive interaction to check spatial information and analysis results. A decision analysis interface is thus established to assist an engineer or analyst in interpreting results and implementing various analyses efficiently. A GIS-based presentation and operation module developed using GeoTools is embedded in the interface to present complex WDNs by geographic map layers that are easy to visualize and follow. The Web-GIS module can be used to perform various spatial decision analyses. A report module with functions to generate tabular reports and statistical charts, using JFreeChart (JFree, 2005), is also provided to present non-spatial data or to illustrate data in different ways to facilitate decision analyses.
Identification of Segments
To effectively analyze a WDN, a pipe-based WDN is transformed into an auxiliary network in which each node presents an identified segment. Identifying all valve-enclosed segments in a WDN manually is usually tedious and tends to be error. A computer program implementing a depth-first search algorithm has thus been developed to facilitate segment identification. The program begins at any unvisited node in the studied network and creates a stack to store nodes to be identified by the function TraverseANode for the current segment. Function TraverseANode searches for each pipe connected to the currently visited node. If the object connected to the
other side of the pipe is a valve, the valve is marked as the boundary of the segment. If the object is an end node, it is stored into the stack. If the object is an unvisited node, Function
TraverseANode is called recursively with the unvisited node. The traversing procedure is halted
until all recursive calls to the function are returned and nodes stored in the stack forms a newly identified segment. The searching procedure is repeated until all nodes are traversed, and the auxiliary network is constructed with all identified segments.
Identification of Critical Segments
Critical segments can block the water distribution to downstream segments and thus cause greater impact while failed. Identification of this kind of segments is necessary for effective WDN management. Therefore, a computer program applying the depth-first search algorithm adopted from Horowitz et al. (1993) has been developed to identify critical segments. The program begins from the root segment, the segment with the water supply source node. Segment level (SLn) and connection (Cn) numbers, representing the search sequence and the connection relationship between segments respectively, are assigned to each segment and both are initially set to be –1. Function TraverseAndAssignNumber sets both SLn and Cn for each currently visited segment to be GLnum, which increases by one in each call to the function, recursively. The function then traverses each segment adjacent to the currently visited segment. If the adjacent segment has not been visited, the function is called recursively. While all subsequent segments are recursively traversed by the function, the Cn for current segment is set to be the smaller one of the Cn of current segment and the Cn of the adjacent segment. If the adjacent segments have been visited, the Cn for current segment is set to be the minimum of the Cn of the current segment and the SLn of the adjacent segment. This traversing and assigning procedure repeats until all segments are visited and all associated SLn’s and Cn’s are determined. Then, any segment whose SLn less than or equal to the Cn of any subsequent segment is a critical segment. For a segment whose SLn is larger than Cn, it implies that there exists a link able to connect back to any segment traversed before the segment, i.e. multiple paths exists and the removal of the segment can not break the network, and thus it is not a critical segment.
Failed Segment Identification
A failed pipe has to be isolated for repairing by closing the peripheral valves. Manual identification of the peripheral valves and associated failed segments is tedious from a complex WDN. A procedure derived from the aforementioned segment identification algorithm is applied to identify the peripheral valves that can isolate the segment including the failed pipe. The derived procedure is the same as the function TraverseANode and starts from one end of the failed pipe and implements the TraverseANode function until the associated segment is identified. While multiple failed events occur simultaneously in a WDN, associated failed segments can be identified by applying the derived procedure repeatedly for each failed pipe. The computer program developed for implementing the identification procedure is integrated into the segment-based analysis module of the system for improving the impact evaluation of a failed event.
Vulnerability Analysis
If a failed event occurs inside a critical segment, the water supply to downstream segments is shut off and the shortage is propagated to those affected downstream segments. The closure of a failed segment, either a general or critical segment, will cause, in addition to the complete shortage for the segment, the impact on the entire network in terms of water pressure, which results in decrease or shortage of water supply. The degree of the impact varies with the place where the affected segment is located. Hydraulic impacts are therefore simulated to analyze the vulnerability of a network. The EPANET2 model is used to simulate node water pressure under the normal condition and possible failed events. The hydraulic impacts for nodes in all segments are then determined based on the water pressure difference between before and after isolating the failed segment. If the simulated pressure, although affected by a failed event, of a node is still larger than the pressure required for full water supply, there is no shortage at the node; if the simulated pressure is smaller than the minimum required pressure, there is no supply at the node and thus results in complete shortage of water for the consumers served by the node. While the simulated pressure is in the range between that required for full supply and the minimum required pressure, the following rational equation proposed by Wagner et al. (1988) is adopted to estimate the reduced water supply.
c H H H H Q m s m d ⎟⎟ • ⎠ ⎞ ⎜ ⎜ ⎝ ⎛ − − = 2 / 1 (1)
where Qd is the estimated supply for the node, H is the pressure obtained using EPANET2 for the system after shutting down failed segments; Hm is the minimum head pressure value
required to supply water at the node, Hsis the node head pressure for full supply; and c is the
node water demand. Using the equation to calculate the sum of the differences between desired demand and reduced water supply at all nodes, the overall shortage impact for closing each segment can be determined. A computer program applying the simulation procedure described above has been developed and integrated into the system for computing the accumulated shortage impacts caused by closing each individual segment.
五、結果與討論
To demonstrate the developed system, the system is applied to analyze the WDN in the Sanchung area of Taipei City. This network supplies 382,934 households and its daily average water demand is 128,850 CMD. The total length of pipeline is 5,834,572 meters, including 6,040 pipes, 8,550 nodes and 2,766 valves. Drinking water is transported by large main pipelines and distributed via small pipelines to households.
System Interface
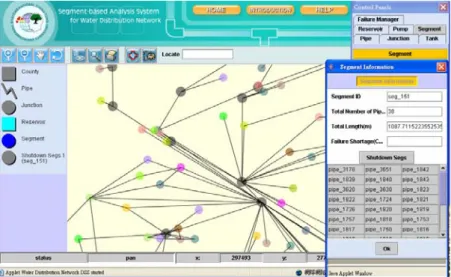
All the instruments in the Sanchung WDN, including junctions, pipes, tanks, reservoirs, and pumps, are stored and presented by separate GIS layers, as shown in Fig. 2. Clickable toggle icons are provided on the left of the system interface to hide or show those GIS layers and
associated labels. The floating control window located on the right of the system interface presents the information of instruments. A specific instrument can be located and associated information can be queried by the control window. For users to look up any part of the network structure, the network diagram can be magnified, minimized, and moved by using the map querying tools located on the menu bar. The map of the network can also be clicked to query the information of a specific network instrument with mouse, and the query result is shown in an information window as illustrated in Fig. 2.
Network Vulnerability
To analyze the topology of a WDN, the original complex network is converted into a segment-based auxiliary network by the aforementioned identification program embedded in the system. Segments which consist of pipes enclosed by surrounding valves are symbolized by circles in different colors for the user to locate the comprised pipes in each segment. The connections among segments are represented by black lines.
Critical segments are also identified and expressed by larger darker circles. The number of connected lines for a segment determines how critical the segment is. The more the number of connected lines suggests that there are more adjacent segments connected to the segment and there might be more water distributed through the segment to other parts of the WDN. This kind of segments is more critical if it includes also any main distribution pipe of a WDN. Critical segments are usually difficult to manually identify from the original complex WDN with numerous pipes and irregular locations of valves. Even with the segment auxiliary network, it is still difficult to identify those critical segments from a network plot. The developed system can rapidly generate the auxiliary network with critical segments being efficiently identified and is expected to significantly facilitate the analysis for the network vulnerability.
The potential impacts of failed events occurred in segments can be preliminarily analyzed according to the topology of the segments. Once a critical segment is shutdown, the affected area is expanded to the downstream segments connected to it. For instance, there are 7 segments affected by closing segment 151. Those affected downstream segments are usually tedious to manually identify from a segment network plot with complicate connectivity and the developed system can effectively overcome this difficulty.
Hydraulic impacts for failed events at segments are simulated and evaluated by the EPANET model. Based on the simulation results, areas that are not completely shutdown but affected by a failed event are identified and the associated water shortages are computed. The results obtained from the hydraulic modeling simulations are showed as a bar chart for the overall shortage impact of each segment and associated shortage values ranked and listed in a Report window. Several segments have a significantly large shortage impact more than 100,000 CMD, such as segments 0, 1, and 7. These segments include main distribution paths to deliver water from the supply source to other parts of the WDN and need to be carefully maintained. The results are depicted as a histogram for the numbers of segments with shortage impacts in specified intervals. Two obvious peaks can be observed from the histogram that indicates the numbers of segments with large and small shortage impact. The segments with large shortage impact can be rapidly identified by clicking a button provided by the developed system. These segments are mainly critical segments with main pipes or located in main distribution paths
between the supply source and the other parts of a WDN. Those segments with small shortage impact are mostly located in the end pipes connected to some households and affect only the supplied demand of the households while they are closed for maintenance. With the provided function to identify critical segments, the developed system can facilitate the reliability analysis of a WDN. For example, if new pipes are going to build, how effective of the pipes for reducing the number of critical segments can be a good indicator for evaluating the improvement of the network reliability.
Keelung River Basin ESI System
To assist the engineer in evaluating the management quality of the upstream catchment to supply water to a WDN, a sustainability index system is to be established. A prototypical index system integrates various environmental sustainability indexes (ESIs) has been developed in this study. The index system, as illustrated in Fig. 3, presents five major ESIs for Keelung River Basin in northern Taiwan. The five ESIs include two water quality related ESIs for BOD and SS, one composite index of PSI for air pollution, and two municipal solid waste related indexes for waste generation and recycling. The map, shown in the center of the system, is displayed using open source GIS toolkits and is used as the graphical interface for the user to select a desired location to view regional ESI values. The ESI values and related information are illustrated by a bar chart and a radar chart in popup windows with a photograph and description of the selected location. The index system is intended to provide information for evaluating the management quality and environmental sustainability of the river basin supplying water to a WDN.
六、成果自評 本計畫成果符合原進度規劃。所建立的自來水管網輔助分析管理系統,可有效率的分 析制水閥分區損壞所造成的影響,且結合管網水力模式模擬分析、Web-GIS 及統計圖表, 讓使用者能掌握缺水影響範圍及程度,亦可作為分析管網可靠度的重要依據。所提出的演 算法及工具,可有效判識制水閥分區、關鍵分區及建立輔助管網,讓自來水事業工程人員 迅速掌握管線損壞影響,並判別出損壞影響區域及其週遭制水閥所在位置,以有效提升管 線維修管理的效率。本研究亦以實例示範應用該系統於實際管網系統的可行性。而嘗試建 立的集水區永續指標系統,則可有效呈現集水區域的各指標變化情形,以輔助評估集水區 管理的品質及擬定合理的供水策略。 七、參考文獻
1. Fujiwara, O. and Li, J., (1998). “Reliability Analysis of Water Distribution Networks in Consideration of Equity, Redistribution, and Pressure-Dependent Demand.” Water Resources
Research, 34, 7, 1834.
2. Goulter, I.C. (1992). “Systems Analysis in Water-Distribution Network Design: From Theory to Practice.” Journal of Water Resources Planning and Management, ASCE, 113(3), 238-248. 3. Huang, P.-Y., Diekmann, J. E., and Fenis, S. M. (1995). “Pipeline Planning System.” Journal
of Computing in Civil Engineering, ASCE, 9(2), 134-140.
4. Mays, L.W. (2000). Water Distribution Systems Handbook, McGraw-Hill, New York.
Environmental Protection Agency, Cincinnati, Ohio.
6. Shamir, U. and Howard, C. D. D. (1979). “An Analysis Approach to Scheduling Pipe Replacement.” Journal of American Water Works Association, 71:5:249.
7. Solomatine, D. P. (1996). “Object Orientation in Hydraulic Modeling Architectures.” Journal
of Computing in Civil Engineering, ASCE, 19(2), 125-135.
8. Taher, S. A., and Labadie, J. W. (1996). “Optimal Design of Water Distribution Networks with GIS.” Journal of Water Resources Planning and Management, ASCE,122(4), 301-311. 9. Walski, T. M. (1993). “Water Distribution Valve Topology for Reliability Analysis.”
Reliability Engineering and System Safety, 42, 21.
10. Walski, T. M. (1987). Discussion of “Quantitative approaches of reliability assessment in pipe networks” by Goulter and Coals. Journal of Transportation Engineering, 113, 5,585.
11. GeoTools. (2005), http://www.geotools.org/ 12. JFree. 2005, http://www.jfree.org/jfreechart/index.php. 13. Java. (2005). http://java.sun.com/. 14. MySQL. (2005). http://www.mysql.com GIS-based Presentation/ Operation Module Shortage Simulation for All Segments
Single/Multiple Failure Simulation EPANET2 Input file EPANET2 Simulation
Segment-based Analysis Module
Report Module
Web-GIS Decision Making User Interface Core WDN Database for
Object-oriented Operation WDN object model Decision Support Analysis Server Structure Analysis Segment Idetification Critical Segment Identification Impacted Areas Identification Peripheral Valves Identification Failure Management Core WDN Database
Fig. 2. System interface of the developed system for presenting and analyzing a WDN