Y. M. Huang
Department of Mecfianical Engineering National Taiwan University Taipei, Taiwan, Repubiic of Ctiina
On the General Evaluation of
Customer Requirements During
Conceptual Design
Customer requirements must be satisfied for a product to succeed in the market. Evaluation of customer requirements plays an important role during the conceptual design phase of various design methodologies. However, since customer requirements are continuously revised during design processes, much effort, time, and money are required. Twenty items are recommended to organize customer requirements and enhance efficiency. The relative importance of these recommended items, without regard to the product, is evaluated by using the pairs comparison method. The weighting factors for all recommended items are then calculated. The relative impor-tance of the items shows that safety, quality, environment and performance are the most important. The relative importance and the weighting factors of the items from this study suggest that their use in the process during preliminary or lead time conceptual design of various design methods can assist with cost and time reductions.
Introduction
Most design methodologies used for product design start from recognizing the need for a product (Cross, 1994) (Jones, 1982) (Sage, 1977). A market survey of customer requirements that have to be satisfied is an integral part of the conceptual design process. Completion of such a survey would help determine whether a product is accepted by consumers. Furthermore, not completing a proper evaluation of customer requirements can lead to market failure. Such cases are particularly common for products of small companies.
Once the relative importance of customer requirements are evaluated, a comparison of these customer requirements will yield weighting factors. Bench marking is then completed and scores are given to the existing products. Preferred products with a relatively higher score can be used as references for a new potential design. Customer requirements are then converted into engineering requirements. The relationship of the engi-neering requirements and customer requirements are evaluated and a score can be given indicating no relation, minor relation, major relation, or a complete relation. Thereafter, the targets of the design are set and specifications of the design are prepared according to the Ullman method (Ullman, 1992).
Based on customer requirements, Krick (1969) and Pahl and Beitz (1996) extended or changed the original task, expecting promising solutions. The overall functional structure, functional structure and sub-functional structure based on the extension of the original task are generated. The physical effect, physical principle, form design, and solution principle for each sub-function are established. Combined solution principles are eval-uated based on customer requirements, and the four top bined solution principles are determined. The variants of com-bined solution principles are evaluated based on the weighting factors of the customer requirements. The first priority of these four combined solution principles is determined and followed by embodiment design and detail design (Pahl and Beitz, 1996). The evaluation methods during conceptual design can be di-vided into two groups, the ordinal methods and the cardinal methods. The ordinal methods include: the pairs comparison method (Saaty, 1990) (Saaty, 1991), datum rule method (Pugh, 1991), rank-ordering method (Edwards and Newman, 1982),
Contributed by the Design Theory and Methodology Committee for publication in the JOURNAL OF MECHANICAL DESIGN. Manuscript received June 1996; revised Oct. 1998. Associate Technical Editor: D. L. Thurston.
majority rule method (Blair and Pollak, 1983) and lexicograph-ical rule method (French, 1971). The most famous and simplest method is the pairs comparison method. The datum rule method is a quantitative evaluation method that is an improved method over the majority rule method. The lexicographical rule method considers the importance of evaluation criteria to the design goal. The cardinal methods include the VDI2225 method pro-posed by the Society of German Engineers and the use value analysis method (Pahl and Beitz, 1996).
Although it is encouraged to have a complete list of customer requirements before conceptual design, there may be too many requirements to allow the relative importance and the weighting factors of customer requirements to be obtained in practical practice. Customer requirements are often modified, revised, or even changed during practical conceptual design to reach a final set. In addition, because customer requirements are expressed in natural terms, such as "fast," "good," "beautiful," and "light," determination of the relative importance and the weighting factors of customer requirements can be difficult, time consuming and costly. However, they are critical during the conceptual design phase of some design methods. Typically, without knowing the relative importance of customer require-ments, the bench marking process in the Ullman method, deter-mination of the top four combined solution principles and the first priority among these four combined solution principles in the Pahl and Beitz method can not be done. It is impossible to have a good survey of customer requirements before the conceptual design and physical configuration of a product deter-mined. Therefore, the relative importance and the weighting factors of customer requirements can not be pursued in an effi-cient manner. In other words, use of the design methodologies during conceptual design becomes a technical problem. One reason for this problem may be associated with the difficulty in obtaining a prime example with a complete process of a practical design.
The purpose of this study is to present some recommended items to organize customer requirements, to survey the relative importance of these items, and to determine the weighting fac-tors of these items. By conducting this investigation, a proce-dural path for conceptual design of the Pahl and Beitz method as well as the Ullman method may be developed.
Method of Approach
The list of customer requirements is expected to be as com-plete as possible during the market survey. However, one should
Table 1 Customer requirements of a product Specification for (name of a product) Change Date M D W Remark: Requirements 1. Energy 2. iUlaterial 3. Signal 4. Embodiment 5. Performance 6. Utilization 7. Safety 8. Ergonomics g. Manufacturing 10. Quality 11. Assembly 12. Operation 13. Maintenance 14. Profit 15. Schedule 16. Motion 17. Load 18. Transport 19. Esthetics 20. Environment Manager: Page Responsible Person Original Date:
note that such a list typically undergoes modification and/or revision during conceptual design. In order to keep customer requirements in a well-organized order for further comparison and evaluation, twenty modified items obtained from Pahl and Beitz are recommended as presented in Table 1 (Pahl and Beitz, 1996). All customer requirements should be written for the appropriate recommended items given in Table 1. The meaning and content of these twenty recommended items are provided in Table 2.
Many evaluation methods can be used to determine the rela-tive importance of customer requirements during preliminary conceptual design. If the pairs comparison method is used, two customer requirements are compared to each other to determine the relative importance. There are N X (N - 1 )/2 comparisons if there are N customer requirements. Table 3 is used in the survey for comparison to obtain the relative importance of rec-ommended items. The numbers I through 20 represent the twenty recommended items. Each recommended item in the column is compared with the recommended items in rows. The positive sign is used in Table 3 if the recommended item in the column is more important than that in the row. Otherwise, a negative sign is used. Only the boxes below the diagonal from the top left corner to the bottom right corner have to be filled. The symbol S represents the total number of positive signs in each column. S is then divided by 190, the total number of comparisons, to obtain the weighting factor W of this recom-mended item for each survey sheet. The weighting factor of each recommended item is finally obtained from the average value of all survey sheets.
Result
Five hundred persons participated in the survey. No specified product was mentioned during the survey. The reasons for
con-ducting the survey as well as for comparison of the twenty recommended items without a specified product name were explained to all participants. They were asked not to focus on any particular product but only on the intuitive comparison of these twenty recommended items. A sample result of survey sheet is shown in Table 4.
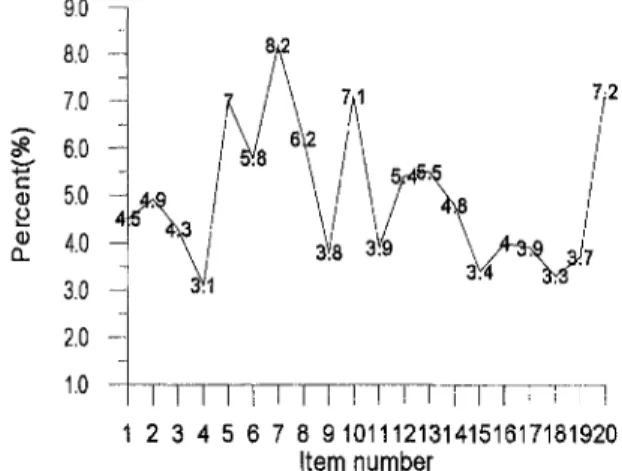
The distribution of the total survey for the relative importance of these twenty items is given in Fig. 1. The male distribution and the female distribution of survey are shown in Figs. 2 and 3, respectively. The survey distributions of people with a graduate degree, a college degree and a high school diploma are presented in Figs. 4, 5 and 6, respectively. The survey distributions of people of 18, 19, 20, 21, 22, 24 to 26, 30 to 39, and 40 to 49 years are given in Figs. 7, 8, 9, 10, 11, 12, 13 and 14, respectively. The relative importance sequence and the weighting factors of these twenty recommended items are pro-vided in Table 5.
Discussion
During comparisons to obtain the relative importance of cus-tomer requirements, the box located in the ith column and the i'th row is blank because there is no comparison for the recom-mended item itself. The sign in the box located in the I'th column
Table 2 The meaning and content of recommended items of customer requirements
Items Meaning and content
Energy Type (heating, cooling, power), state, input, output, conversion, storage, loss, efficiency
Material Type (gas, liquid, solid), state, phase, input, output, flow, storage, conversion, property (strength, stiffness, elasticity)
Signal Type (vision—flash, light; audio display—sound; smell, taste—flavor; touch—temperature; feeling—humidity, pressure), input, output, conversion, control
Embodiment Dimension (height, width, length, thickness, space, diameter, clearance, tolerance, surface condition, spatial fitness), arrangement, connection, clearness of layout
Performance Type (fast—acceleration or speed; less— consumption; accuracy, high, reliable— reliability), function, logic
Utilization Life (fatigue, endurance)
Safety Type (direct protection, indirect protection, warning signal and label), environmental safety, liability (warranty), regulations and standards Ergonomics Operation (type, position, location and condition),
man and device interface, anthropometry Manufacturing Type (grinding, milling, drilling, shaving, heat
treat), factory facility (limitation, capability, process, method, tool), wastage, lubrication, quantity
Quality Control, assurance (testing, inspection, measuring, method, facility)
Assembly Process, special regulation, tool, sitting, foundation Operation Safe, smoothness, quietness, comfort, ease, special
uses
Maintenance Ease, fast, service intervals, inspection, clean, repair, replacement, tool
Profit Investment, cost (manufacturing, tool), depreciation, unit price
Schedule Date (development period, planning, production, delivery)
Motion Type (linear, rotational, direction), kinematics, kinetics, dynamics (displacement, velocity, acceleration, jerk), resonance
Load Type (force, torque, bending, shearing, friction), direction, magnitude, frequency, deformation Transport Type, method, limitation, lifting gear, condition of
dispatch
Esthetics Type, shape, brightness, color, appearance Environment Type, limited material, limited condition, recycling
Table 3 The comparison sheet 1 2 3 4 5 6 7 6 9 10 11 12 13 14 16 16 17 18 19 20 S W (%) 1 2 3 4 5 a 7 8 9 10 11 12 13 14 16 16 17 18 19 20
Table 4 A sample of survey result
1 2 3 4 6 6 7 8 9 10 11 12 13 14 15 16 17 18 19 20 S W (%) ' -* + -+ + -+ + + + * ^ 4.7 2 + + + • + -* • + + + * + + 11 6.8 ' -+ -+ - t -+ + + * + -a 4.2 ' -• • -' ' -+ 1 0,5 ' * + + + + -+ + -+ + + + "*" + + * + 16 8.4 ' + * * + -+ -+ + + + + + + + + -15 7.9 7 + + ^ * + * + + * + + + + + "^ * * 19 10 8 + + + + + + + * + + + * + + * 14 7.4 9 • + -* • + " + + * e 3.2 10 + + + + + + -+ + + + + + + + + + * "*" 18 9.5 11 + + + * * -5 2,6 12 + "*" + + + + + + * + + + 12 6.3 13 + "^ * + -+ + + + + + + + + 13 6.8 14 + -+ + -+ + -+ + + + * • 10 5.3 15 ' 4 - -I-2 1.1 16 -+ -+ + -+ + * * • ' 3.7 17 -+ -+ + + -4 2.1 IS -0 0 19 -+ -+ -+ 1.6 20 + + "*" + + + + + + + + " • • " * + * + 17 8.9 c (U y (U c (D a. T T " T T T T T T I i I I" I I I I I T l 1 2 3 4 5 6 7 8 9 1011121314151617181920 Item number Fig. 1 The distribution of total survey
T~[ " r T T T T T ' T T ' T T ' T TT'"rT"T1 1 2 3 4 5 6 7 8 9 1011121314151617181920
Item number Fig. 2 The distribution of male survey
I I I i M M ! ! I I I I i I I i 1 2 3 4 5 6 7 8 9 1011121314151617181920
Item number Fig. 3 The distribution of female survey
and theyth row is opposite to that in the box located in the/th column and the /th row. Therefore, the number of the compari-son can be reduced 50%, from 190 to 95, and only the boxes below the diagonal from the top left corner to the bottom right corner have to be filled. The boxes above the diagonal can be filled with the aid of a computer that also calculates the weighting factors of recommended items.
Appreciation for participation was expressed to all study par-ticipants. The survey distributions are presented for people of
18, 19, 20, 21, 22 years, respectively, because people from ages
9,0 8,0 7,0 H g . 6.0 c ^ 4.0 01 5,0 ^ 4 ^ I
I 4.0 - \j
3.0 ^ 3^1 2.0 1,0 r T i n ~ T T " T T T T T T T " r T T ^ " l ~ ! 1 2 3 4 5 6 7 8 9 1011121314151617181920 Item numberFig. 4 The survey distribution of people with a graduate degree
c
a.
I I I I M I I I I I 1 ! I I i " n 1 2 3 4 5 6 7 8 9 1011121314151617181920
Item number
Fig. 7 Tlie survey distribution of people of 18 years
1 2 3 4 5 6 7 8 9 1011121314151617181920 Item number
Fig. 5 The survey distribution of people with a college degree
9,0 8,0 7,0 6.0 5,0 4,0 3,0 H 2,0 c 2 a. 1,0 1 I I I I M 1 I M i I I I I ! I I 1 2 3 4 5 6 7 6 91011121314151617181920 Item number
Fig. 6 The survey distribution of people with a high school diploma
18 to 22 years have a very high capability for consumption. The relative importance of recommended items shows that safety, quality, environment and performance are the most important considerations from the total survey. It is interesting to find that safety is the most important recommended item for all ages except for people of 19 years.
A value of 1 is filled in Table 3 if the recommended item in the column is more important than that in the row during comparisons in many other evaluation methods. Otherwise, a value of 0 is filled. However, the values of 1 and 0 are less
0) y a. CD a. I I I I I I I T 1 1 I M I I I I I I 1 2 3 4 5 6 7 8 9 1011121314151617181920 Item number
Fig. 8 The survey distribution of people of 19 years
! I I i~rrrTT'TT~rT~rr
1 2 3 4 5 6 7 8 9 1011121314151617181920 Item number
Fig. 9 The survey distribution of people of 20 years
intuitive than the positive and negative signs. In addition, only the number of Is or the positive signs are summed after the survey. Therefore, it is recommended that the number of Os or negative signs be omitted in future surveys to facilitate the summation of 1 s or positive signs.
The relative importance and the weighting factors are critical, important and necessary during conceptual design. It is imprac-tical to determine all of the relative importance and weighting factors of customer requirements because of the variant nature of customer requirements during practical conceptual design. Although the result obtained in this study may not be applied exactly for a specified product, it provides a time and cost efficient way to complete conceptual design for the Pahl and Beitz method as well as the Ullman method.
T T T ' T T X T T I I I I I rV
1 2 3 4 5 6 7 8 9 1011121314151617181920
Item number
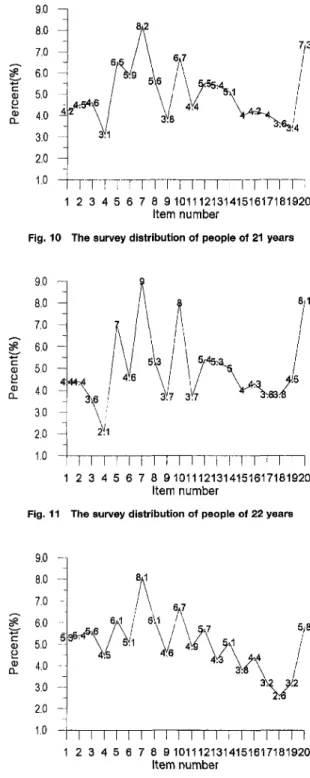
Fig. 10 The survey distribution of peopie of 21 years
S2
I
9.0 8.0 7.0 6,0 5.0 4,0 3.0 2.0 1.0 "T"! ! i I T"T"T"TT"rTTn"n""""~i~i 1 2 3 4 5 6 7 8 9 1011121314151617181920 Item numberFig. 13 Tlie survey distribution of people of 30-39 years
0)
y
Q-1 2 3 4 5 6 7 8 9 Q-10Q-1Q-1Q-12Q-13Q-14Q-15Q-16Q-17Q-18Q-1920 Item number
Fig. 11 The survey distribution of people of 22 years
a. 9.0 8,0 7,0 6,0 5,0 4,0 3,0 2,0 1,0
1 i I ! r 1 "1 -n-r7-r-T" TTT T I ^ I
1 2 3 4 5 6 7 8 9 1011121314151617181920 Item numberFig. 14 The survey distribution of people of 40-49 years
Q.
Table 5 The relative importance sequence and tlie weigliting factors of the recommended items
I I I I I I I I I I I I J I I J I I I
1 2 3 4 5 6 7 8 9 1011121314151617181920
Item number
Fig. 12 The survey distribution of people 24-26 years
Therefore, the weighting factors of customer requirements obtained in this study are recommended for preliminary evalua-tion during conceptual design. A meaningful market survey for the specified product is recommended in order to complete the required evaluation once the configuration of product is deter-mined. The customer requirements are suggested to be divided into three classes, such as "Must," "Demand" or "Wish". "Must" customer requirements must be satisfied. Otherwise, the product design is not acceptable. "Demand" customer re-quirements should be satisfied if possible. Though ' 'Wish'' cus-tomer requirements should be satisfied, a product not meeting "Wish" customer requirements is still acceptable. Customer requirements are divided into two classes, such as "Demand" and "Wish" in the Pahl and Beitz method and the Cross method (Pahl and Beitz, 1996) (Cross, 1994). All customer
require-Item 7. Safety 10. Quality 20. Environment 5. Performance 8. Ergonomics 6. Utilization 13. Maintenance 12. Operation 2. Material 14. Profit 1. Energy 3. Signal 16. Motion 9. Manufacturing 11. Assembly 17. Load 19. Esthetics 15. Schedule 4. Embodiment 18. Transport Weighting factor (%) 8.0 7.0 7.0 6.8 6.0 5.8 5.3 5.3 5.0 4.9 4.6 4.5 4.1 4.0 4.0 3.9 3.6 3.5 3.4 3.3
ments are included to obtain the relative importance. Customer requirements are also divided into three classes, such as
"Must," "Demand" and "Wish" in the Ullman method (Ull-man, 1992). However, "Must" customer requirements are not included to calculate the weighting factors. In this study, it is recommended that "Wish" customer requirements not be included in the comparison of the relative importance of cus-tomer requirements. The relative importance of cuscus-tomer re-quirements are calculated based only on "Must" and
mand'' customer requirements to reduce the number of compar-isons and, therefore, design cost and time.
Acknowledgment
The author would like to express his sincere thanks to the National Science Council of the Republic of China for the Grant NSC86-2212-E-002-058 for funding this investigation and to Grant D. Huang for comments and revisions made on this manu-script.
References
Blair, D. H., and PoUak, R. A., 1983, "Ration Collective Choice," Scientiiic American, 249.2, pp. 7 6 - 8 3 .
Cross, N., 1994, Engineering Design Method-Strategies for Product Design, John Wiley & Sons, Inc.
Edwards, W., and Newman, J. R., 1982, Multi-attribute Evaluation, Beverly Hills, Sage Publications.
French, M. J., 1971, Conceptual Design for Engineers, Second Edition, Springer-Verlag, pp. 352-370.
Jones, J. C , 1982, Design Methods: Seeds of Human Futures, 9th edition, John Wiley & Sons Inc., pp. 377-383.
Kiick, E. v., 1969, An Introduction to Engineering and Engineering Design, 2nd Edition, New York, John Wiley & Son, Inc.
Pahl, G., and Beitz, W., 1996, Engineering Design—A Systematic Approach, Edited by Wallace, K., Springer-Verlag.
Pugh, S., 1991, Total Design: Integrated Methods for Successful Product
Engi-neering, Addison Wesley, pp. 74-86.
Saaty, T. L., 1990, "How to Make a Decision: The Analytic Hierarchy Pro-cess," European Journal of Operational Research 48/1, pp. 9-26.
Saaty, T. L., 1991, Prediction, Projection, and Forecasting, Kluwer Academic Publishers, pp. 17-18.
Sage, A. P., 1977, Methodology for Larger Scale Systems, New York, McGraw-Hill, pp. 353-373.
Ullman, D. G., 1992, The Mechanical Design Process, McGraw-Hill, Inc.
(Contents continued)
145 MEDIATOR: A Resource Adaptive Feature Recognizer that Intertwines Feature Extraction and Manufacturing Analysis
D. M. Gaines, F. Castafio, and C. C. Hayes
159 A Procedure for Upgrading an Electronic Control Diesel Fuel Injection System by Considering Several Engine Operating Regimes Simultaneously
B. Kegl
TECHNICAL BRIEFS
166 Mass Center of Planar Mechanisms Using Auxiliary Parallelograms A. Gokce and S. K. Agrawal
169 Synthesis of Stationary Cams L.-I. Wu and P.-H. Fang
172 Geometric Design of Roller Gear Cam Reducers D. M. Tsay, N. J. Huang, and B. J. Lin
BOOK REVIEW
176 Mechanical Engineering Handbooli, by Frank Kreith .
NOTICES
14 Change of address form
. Reviewed by Edward B. Magrab