Competition of Two Host Species for a Single-Limited
Resource Mediated by Parasites
Sze-Bi Hsu
Department of Mathematics,
National Tsing-Hua University
Hsinchu, Taiwan
&
I-Fan Sun
Department of Life Science and
Center of Trophical Ecology and Biodiversity
Tung-Hai University
Abstract:
In this paper we consider a mathematical model of two host species competing for a
single-limited resource mediated by parasites. Each host population is divided into susceptible and infective population. We assume that species 1 which has the smallest break-even concentration, outcompetes species 2 when there is no parasite. We analyze the model by finding the conditions for the existence of various equilibria and doing their stability analysis. The bifurcation diagram shows that species 1 still outcompetes species 2 when the contact rate β of the species 1 is small 1
regardless of the contact rate β of the species 2. However if 2 β is large enough, both of species 1 1 and species 2 coexist either in the form of equilibrium or in periodic oscillation..
Key words: multi-host, mathematical model, parasite, competition, resource.
INTRODUCTION In ecology, ecologists are interested in understanding how and to what extent, interspecific interactions influence community structure, species coexistence and biodiversity. In the past two decades, people investigate the potential importance of parasites and pathogens in
determining the outcomes trophic interaction and community process. In the paper (Hatch & et. 2006 ) the authors give a review about the recent research on how parasites influence competitive and predatory interaction between the species they infect. In this paper we shall investigate a
mathematical model of two host species competing for a single-limit resource mediated by parasites. Especially we focus on the question: can infection produces coexistence of species. When there is no infection mediated by parasites, it is a well-known fact that only the species with the smallest break-even concentration survives (Hsu 1978, Herbert et. 1956, Powell 1958, Hsu et 1977, Smith & Waltman 1994). With the infection by parasites we show that it is possible to have coexistence of two species if the contact rate β of surviving species is large enough. We shall find conditions for 1 the existence of various equilibria and do their stability analysis. A bifurcation diagram is presented with contact rates β β1, 2 as two bifurcation parameters. We also present a bifurcation diagram by using input concentration R(0)of the nutrient as a bifurcation parameter.
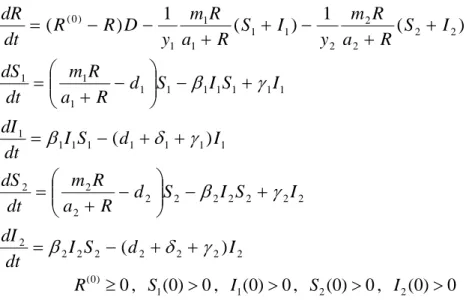
The model
The model of two hosts competing for a single-limited resource mediated by parasites leads to the differential equations 2 2 2 2 2 2 2 2 2 2 2 2 2 2 2 2 2 2 1 1 1 1 1 1 1 1 1 1 1 1 1 1 1 1 1 1 2 2 2 2 2 1 1 1 1 1 ) 0 ( ) ( ) ( ) ( 1 ) ( 1 ) ( I d S I dt dI I S I S d R a R m dt dS I d S I dt dI I S I S d R a R m dt dS I S R a R m y I S R a R m y D R R dt dR γ δ β γ β γ δ β γ β + + − = + − ⎟⎟ ⎠ ⎞ ⎜⎜ ⎝ ⎛ − + = + + − = + − ⎟⎟ ⎠ ⎞ ⎜⎜ ⎝ ⎛ − + = + + − + + − − = (1) 0 ) 0 ( ≥ R , S1(0)>0, I1(0)>0, S2(0)>0, I2(0)>0
Here we assume that each host population is divided into susceptible and infectious hosts; these are designated S, I. R is the concentration of resource. The rest of the model’s parameters are defined in table 1.
Table 1 Definition of parameters used in the model Parameter Definition
) 0 (
R input concentration of nutrient R
D dilution rate
i
y yield constant of i-th host
i
m maximum growth rate of i-th host
i
a half-saturation constant for i-th host
i
d death rate of i-th host
i
δ per capita additional mortality of i-th host when infected with parasite
i
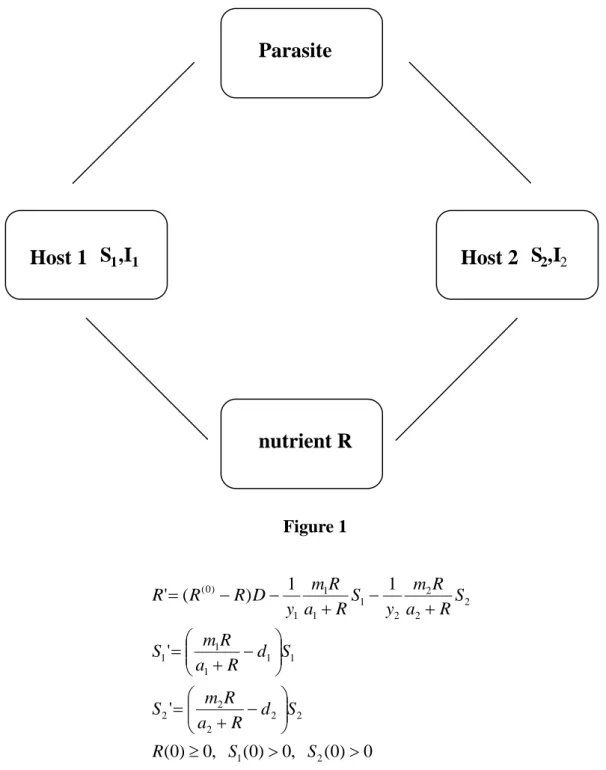
Figure 1
Host 1
S
1,
I
1nutrient R
Parasite
Host 2
S
2,
I
2 Figure 1When there is no parasites, the infective populationI1(t),I2(t)satisfy I1(t)≡0, I2(t)≡0. Then the system (1) becomes 0 ) 0 ( , 0 ) 0 ( , 0 ) 0 ( ' ' 1 1 ) ( ' 2 1 2 2 2 2 2 1 1 1 1 1 2 2 2 2 1 1 1 1 ) 0 ( > > ≥ ⎟⎟ ⎠ ⎞ ⎜⎜ ⎝ ⎛ − + = ⎟⎟ ⎠ ⎞ ⎜⎜ ⎝ ⎛ − + = + − + − − = S S R S d R a R m S S d R a R m S S R a R m y S R a R m y D R R R (2)
If the maximal growth rate m is less than or equal to the death rate i d of the i-th host, then i
0 ) (t →
Si as t→∞, i.e. the i-th host cannot survive. Assume the break-even concentration of the
i-th host 0 1 ) / ( − > = i i i i d m a λ ,i=1,2.
If the break-even concentration λi is greater than the input concentration R(0) then the i-th host species goes to extinction due to the fact that input concentration R(0) is too small to support the survival of i-th host speciesS (Hsu 1978, Smith and Waltman 1994). Thereafter we assume that i
0<λ1<λ2 <R(0) (H) Under assumption (H), we conclude that 1st host species S1 outcompetes the 2nd host species S2 (Hsu 1978, Smith and Waltman 1994) and the solutions R(t), S1(t), S2(t) satisfy
0 ) ( lim ) ( ) ( lim ) ( lim 2 1 1 1 ) 0 ( * 1 1 1 = − = = = ∞ → ∞ → ∞ → t S d Dy R S t S t R t t t λ λ
Equilibria and Their Stability Analysis of (1):
In the followings, we state the results for the existence of equilibria and their stability analysis. The proofs are deferred to Appendix. Under the assumption (H), the equilibrium E1 =(λ1,S1∗,0,0,0) of system (1) always exists. The equilibrium E1 is locally asymptotically stable if
β1S1∗−(d1+δ1+γ1)<0 (3) If 1 1 −( 1+ 1+ 1)>0 ∗ δ γ βS d (4) then E1 is unstable.
If the instability condition (4) holds then the equilibrium 1 (ˆ1,ˆ1,ˆ1,0,0)
1 R S I EI = exists, where R , ˆ1 1 ˆ S , I satisfy ˆ1 1 1 1 1 1 ˆ d 0 S δ γ β + + = > (5) 1 1 1 1 1 1 1 1 1 ˆ ˆ ( )ˆ 0 ˆ m R d S d I a R δ ⎛ ⎞ − = + > ⎜ ⎟ + ⎝ ⎠ ) ˆ (∴ R1 >λ1 (6) 1 1 1 1 1 1 1 1 1 1 1 1 1 1 ) 0 ( ˆ ˆ ˆ ˆ ˆ 1 ) ˆ ( S d R a R m R a R m y D R R ⎟⎟ ⎟ ⎟ ⎟ ⎠ ⎞ ⎜⎜ ⎜ ⎜ ⎜ ⎝ ⎛ + + + + = − δ δ (7)
It can be proved that if
1
1I
E is locally asymptotically stable then
We note that under condition (8),
1
1I
E may be a stable or an unstable equilibrium. If Rˆ1 >λ2 (9) then 1 1I E is unstable.
It can be proved that if the instability condition (9) holds then the equilibrium ) 0 , ~ , ~ , ~ , ( 2 1 1 2 2 11 S I S EI = λ exists, where 1 1 1 1 1 1 ˆ ~ β γ δ + + = =S d S (10) and 2 ~ S , ~I satisfy 1 ~ 1 1 ~1 0 2 1 2 1 1 1 1 ⎟⎟ > ⎠ ⎞ ⎜⎜ ⎝ ⎛ − + + = d S a m d I λ λ δ (11) ~ ( ) 1 ~ 0 1 1 1 2 1 2 1 1 2 1 2 1 1 2 ) 0 ( 2 2 2 > ⎥ ⎥ ⎥ ⎥ ⎦ ⎤ ⎢ ⎢ ⎢ ⎢ ⎣ ⎡ ⎟ ⎟ ⎟ ⎟ ⎠ ⎞ ⎜ ⎜ ⎜ ⎜ ⎝ ⎛ + + + ⎟⎟ ⎠ ⎞ ⎜⎜ ⎝ ⎛ + − − = δ δ λ λ λ λ λ d a m S a m y D R d y S (12)
If E1I12 is locally asymptotically stable then
β2S~2 −(d2 +δ2+γ2)<0 (13) We note that under condition (13), E1I12 may be a stable or an unstable equilibrium.
If
β2S~2 −(d2 +δ2+γ2)>0 (14) then E1I12 is unstable.
It can be shown that if the instability condition (14) holds then the equilibrium ) , , , , ( 1 1 2 2 2 11 2 R S I S I EI I = exists where 1 1 1 1 1 1 ˆ β γ δ + + = =S d S (15) 2 2 2 2 2 2 ˆ β γ δ + + = =S d S (16)
1 1 0 1 1 1 1 1 ⎟⎟> ⎠ ⎞ ⎜⎜ ⎝ ⎛ − + + = d R a R m d I δ (∴ R >λ1) (17) 1 2 0 2 2 2 2 2 ⎟⎟> ⎠ ⎞ ⎜⎜ ⎝ ⎛ − + + = d R a R m d I δ (∴ R >λ2) (18) R satisfies ⎟ ⎟ ⎟ ⎟ ⎠ ⎞ ⎜ ⎜ ⎜ ⎜ ⎝ ⎛ + + + + + ⎟ ⎟ ⎟ ⎟ ⎠ ⎞ ⎜ ⎜ ⎜ ⎜ ⎝ ⎛ + + + + = − 2 2 2 2 2 2 2 2 2 1 1 1 1 1 1 1 1 1 ) 0 ( 1 1 ) ( δ δ δ δ d R a R m S R a R m y d R a R m S R a R m y D R R (19)
It is difficult to determine the local stability of
2 12
1I I
E .
We verify it by extensive numerical simulation. We conjecture that Hopf bifurcation may occurs and there exists periodic solutions in some parameter range.
Bifurcation Analysis:
The equilibrium E1 =(λ1,S1∗,0,0,0) is locally stable if (3) holds. We rewrite (3) as 1 1 ) 0 ( 1 1 1 1 1 1 ) ( ) ( ˆ Dy R d d λ γ δ β β − + + = < (20) When β1>βˆ1, the equilibrium E1 is unstable and the equilibrium 1 (ˆ1,ˆ1,ˆ1,0,0)
1 R S I
EI = exists. If
1
1I
E is locally stable then (8) holds. However, if (8) holds then
1
1I
E may be locally stable or unstable. It can be shown in the Appendix that (8) can be rewritten as
D R d d a m a m y ( ) 1 ~ 2 ) 0 ( 1 1 1 1 1 1 2 1 2 1 2 1 2 1 1 1 1 λ γ δ δ δ λ λ λ λ β β − + + + ⎟⎟ ⎠ ⎞ ⎜⎜ ⎝ ⎛ + + + = < (21) and 1 1 ~ ˆ β β < .
If the instability condition for
1
1I
E β1>β~1 holds, then the equilibrium
1
1I
E is unstable and the
equilibrium )1 2 ( 2,~1,~1,~2,0
1 S I S
EI = λ exists. If 1 2
1 I
E is locally stable then (13) holds. However if
(13) holds then the equilibrium E1I12 may be locally stable or unstable. It can be shown in the Appendix that (13) can be rewritten as
⎟⎟ ⎠ ⎞ ⎜⎜ ⎝ ⎛ − < 1 3 2 1 2 β β A A A (22)
where ) ( 2 2 2 2 2 1= d +δ +γ y d A (23) D R A2 =( (0)−λ2) (24) ⎟⎟ ⎠ ⎞ ⎜⎜ ⎝ ⎛ + + + + + + = 1 2 1 2 1 1 1 1 1 1 2 1 2 1 1 3 1 δ λ λ δ γ δ λ λ a m d d a m y A (25)
We note that the vertical asymptote of the curve
⎟⎟ ⎠ ⎞ ⎜⎜ ⎝ ⎛ − = 1 3 2 1 2 β β A A A is 1 2 3 1 ~ β β = = A A .
If the instability condition for E1I12
⎟⎟ ⎠ ⎞ ⎜⎜ ⎝ ⎛ − > 1 3 2 1 2 β β A A A
holds then the equilibrium
) , , , , ( 1 1 2 2 2 11 2 R S I S I
EI I = exists. It is difficult to prove the local stability of
2 12
1I I
E analytically. In the Figure 2, using β1,β2 as bifurcation parameters, we plot a bifurcation diagram. It shows that the Hopf bifurcation occurs and there are periodic oscillation for some parameter ranges.
In region I, the equilibrium E1 is locally stable. In region II, the equilibrium
1
1I
E exists, E1 is unstable.
In region III, the equilibrium 1 2
1 I E exists, E1, 1 1I E are unstable.
In region IV, the equilibrium
2 12 1I I E exists, E1, 1 1I E , 1 2 1 I E are unstable. Figure 2 Figure 3
In Figure 3 our numerical simulation study shows there is a Hopf bifurcation curve H in the region IV. For (β1,β2) inside the curve H, the region V, E1I12I2 is unstable and periodic oscillation occur
(See Figure 4). R vs T S1 vs T I1 vs T ) 0 ( R = 10 D = 0.4 1 1 = m m2 =3 1 1 = a a2 =2 5 . 0 1 = d d2 =2 5 . 0 1 = δ δ2 =0.4 1 . 0 1 = γ γ2 =0.001 S2 vs T I2 vs T 4 1 = y y2 =2 Figure 4
The time series for β1 =60,β2 =20.
Under the basic assumption (H), species 1 outcompetes species 2 when there is no infection by the parasites. When the contact rate β1 satisfies 0<β1<βˆ1 regardless of magnitudes of the species 2’s contact rate β2, the species 1 still outcompetes the species 2 and there is no infection
population of species 1. If we increase β1 such that βˆ1<β1<β~1, then regardless of the
magnitudes of β2 species 1 still outcompetes species 2, but there is some infective population for the species 1 in this case. For β1 >β~1, species 1 and species 2 coexist. For the parameters β1, β2 if the point
(
β1,β2)
is under the curve1 2 1 3 2 1 ( ) ( ) A f A A β β β = = −
in the β β1− 2 plane, then species
susceptible population. If
(
β1,β2)
is above the curve β2 = f(β1)in the β β1− 2 plane then species 1 and species 2 both with infective population coexists in the steady state . For(
β1,β2)
in the region V, species 1 and species 2 both with infective population coexist in the form of periodic oscillation.If we vary the input concentration R(0) and fix the other parameters then from (20), (21), (22) it follows that ) 0 ( 1 1 1 1 1 1 1 ) 0 ( 1 1 ˆ ) ( ˆ R Dy d d R < + + + = ⇔ < β γ δ λ β β . ) 0 ( 1 1 1 2 1 2 1 2 1 2 1 1 1 1 1 1 2 ) 0 ( 1 1 ~ ) ( ~ R d a m a m Dy d R = + ⎟⎟ ⎠ ⎞ ⎜⎜ ⎝ ⎛ + + + + + + < ⇔ < δ δ λ λ λ λ β γ δ λ β β ) 0 ( 1 2 2 2 2 2 ) 0 ( ) 0 ( 1 3 2 1 2 ) ( ~ R Dy d d R R A A A ⇔ < + + + = ⎟⎟ ⎠ ⎞ ⎜⎜ ⎝ ⎛ − < β γ δ β β
From the hypothesis (H), we have Rˆ(0)<R~(0)<R(0). The bifurcation diagram is the following Figure 5:
Thus in order to have coexistence of species 1 and species 2, we need to have large input concentration R(0) i.e. R(0) >Rˆ(0).
Discussion:
In this paper we study the competition of two host species for a single-limited resource mediated by parasite. Our basic assumption is
0<λ λ1< 2 <R(0) (H)
In the absence of infection λ λ1, 2 are the break-even concentration for species 1 and species 2 respectively. We note that the break-even concentration λiof ith species is
( ) 1 i i i i a m d λ = − Figure 5
If mi ≤ or di 0<R(0) < then the i-th species goes to extinction ( Hsu 1978). That is, if the λi maximal growth rate m is less than or equal to the death rate i d or the input concentration i R(0) is too small to support the ith species, then the ith species goes to extinction. Thus we only consider the case that 0< <λi R(0).Under the assumption (H) the competitive exclusion principle holds and species 1 which has the smallest break-even concentration, wins the competition (Hsu 1978). Next we consider the case that the infection is mediated by parasite. The equilibrium
*
1 ( ,1 1, 0, 0, 0)
E = λ S is asymptotically stable if (3) holds. We may rewrite (3) as (0) 1 1 1 0 1 1 1 1 1 ( ) ( ) 1 ( ) R Dy R d d β λ δ γ − = < + + (26)
where (R0 1) is the basic reproduction number of the infection for species 1. From (26) it is easy to see that with d fixed if the contact rate 1 β1 or the input concentration R(0) is small or the additional death rate δ1 or the recovery rate γ1 of the infective population of species 1 are large then species 1 still wins the competition independent of the contact rate β2 of species 2 and species 1 contains only susceptible population. When the basic reproduction number (R0 1) is greater than 1, the equilibrium E becomes unstable and a new equilibrium 1
1
1I (ˆ1, ˆ1, , 0, 0)ˆ1 E = R S I
bifurcates. From (20), (R0 1) > is equivalent to 1 β1>βˆ1. If the instability condition (9) holds, not only
1
1I
E is unstable but also the new equilibrium
1
1 2I ( 2, 1, ,1 2, 0)
E = λ S I S% % % bifurcates. We note that the instability condition (9) is equivalent to condition β1> % .where β1 β% is defined in (20). 1 When βˆ1<β1< %β1, there are two equilibria, namely E and 1
1 1I E E is unstable and 1 1 1I E is either stable or unstable. In this case competitive exclusion principle still holds. The susceptible and infective population of species 1 either go to positive steady state or sustain oscillation when
1
1I
E is stable or unstable. To explain the biological meaning , we rewrite βˆ1 <β1 < %β1 as follows:
1 2 1 2 1 (0) 1 1 1 1 1 1 2 2 2 1 (0) 1 1 (0) 1 2 1 1 2 1 1 1 ( ) ( ) ( ) ( ) ˆ ˆ ( ) ( ) ( ) m m d d R a a h R Dy R d d λ δ λ δ γ λ λ λ β β β β λ λ λ δ + + + − + + = < < = = − − + % (27) where 1 1 1 (0) 1 1 1 (0) 1 1 1 ( ) ( ) ( ) ( ) ( ) m m R a a h R d d λ δ λ λ λ λ λ λ δ + − + + = − +
It is easy to verify h( ) 1λ1 = by the definition of break-even concentration λ1.and h( )λ is increasing in λ , ( 0 ) lim ( ) R h λ→ − λ = +∞ . Let * 1 ( )
h λ =β forβ1>βˆ1. Then (24) implies that
* (0)
2 R
λ <λ < ,i.e. the gap between λ1 and λ2 is large. In this case the species 2 is a weaker competitor. Hence competitive exclusion principle still holds.
If β1> % thenβ1 *
1 2
λ λ< <λ and
1
1I
E becomes unstable and equilibrium
1
1 2I
E bifurcates. Biologically it says that if the gap between λ1 and λ2 is small then species 2 can coexist with species 1. Ifβ1> % and β1 1 2 3 2 1 ( ) A A A β β < − (28)
then there are three equilibria, namely
1 1
1, 1I , 1 2I
E E E ;
1
1, 1I
E E are unstable and
2
1I 2
E is either stable or unstable.. From (23),(24),(25) we may rewrite (28) as follows:
1 2 1 2 1 (0) (0) 2 1 2 1 2 2 2 1 (0) 1 0 1 1 1 1 0 12 2 2 2 2 ( ) 1 [( ) ][ ( ) ( ) 1 ( ) m m a R a y R D R R d d R d d λ λ δ λ λ λ β λ λ δ δ γ ⎛ ⎞ + ⎜ + ⎟ − + ⎝ ⎠ − − − + = < + + Or (0) 2 2 2 0 1 2 0 12 0 1 2 2 2 2 ( ) (( ) ( )) ( ) 1 ( ) ( ) y R D R h R R d d β λ λ δ γ − − = < + + (29) where (R0 12) is the basic reproduction number of the infection of species 2 under the condition that the infection outbreaks for species 1. In order to have (R(0))12 > we need 0
(R0 1) >h(λ2) (30) i.e., the basic reproduction number of infection of species 1 is large enough to have the infective population of species 1.Assume (30) holds. If either the contact rate β2 is small or the additional death rateδ2, recovery rate γ2 of species 2 are large, then (29) holds. Thus the disease does not outbreak for species 2. In this case we have coexistence for species 1 and species 2. Species 1 has both susceptible and infective populations, species 2 has only susceptible population. Either the populations go to a steady state if
1
1 2I
E is stable or sustain periodic oscillation if
1 1 2I E is unstable. If β1> % and β1 1 1 3 2 1 ( ) A A A β β > − (31)
then the equilibrium
1
1 2I
E becomes unstable and a new equilibrium
1 2
1 2I I
E bifurcates. Thus there
are four equilibria, namely
1 1 1 2
1, 1I , 1 2I , 1 2I I
E E E E ;
1 1
1, 1I , 1 2I
E E E are unstable and
1 2
1 2I I
E is either stable or unstable. We may rewrite (31) as
(R0 12) > (32) 1 From the expression of (R0 12) in (29), if the contact rate β2 or the input concentration R(0) is large then (32) holds thus the disease outbreak for species 2 and we have coexistence for species 1 and species 2. Both of them have infective populations. Either the populations go to a steady state if
1 2
1 2I I
E is stable or sustain periodic oscillation if
1 2
1 2I I
E is unstable.
Appendix
In Appendix we discuss the existence of equilibria
1
1I
E , E1I12, E1I12I2 and their relations
with the instability of E1, E , 1I1 E1I12 respectively. First we note that the equilibrium ) 0 , 0 , 0 , , ( 1 1 1 ∗ = S
E λ of system (1) always exists. The variational matrix of the system (1) at ) , , , , (R S1 I1 S2 I2 E = is ⎥ ⎥ ⎥ ⎥ ⎥ ⎥ ⎦ ⎤ ⎢ ⎢ ⎢ ⎢ ⎢ ⎢ ⎣ ⎡ = 55 54 45 44 41 33 32 23 22 21 15 14 13 12 11 0 0 0 0 0 0 0 0 0 0 ) ( a a a a a a a a a a a a a a a E J where ) )( ( ' 1 ) )( ( ' 1 2 2 2 2 1 1 1 1 11 f R S I y I S R f y D a =− − + − + ) ( 1 1 1 12 f R y a =− ) ( 1 1 1 13 f R y a =− ) ( 1 2 2 14 f R y a =− ) ( 1 2 2 15 f R y a =− 1 1 21 f '(R)S a = 1 1 1 1 22 (f (R) d ) I a = − −β 1 1 1 23 =−βS +γ a 1 1 32 I a =β ) ( 1 1 1 1 1 33 =βS − d +δ +γ a 2 2 41 f '(R)S a = 2 2 2 2 44 (f (R) d ) I a = − −β 2 2 2 45 =−β S +γ a 2 2 54 I a =β ) ( 2 2 2 2 2 55 =β S − d +δ +γ a R a R m R f + = 1 1 1( ) , R a R m R f + = 2 2 2( )
The variational matrix J(E1) of system (1) at equilibrium E1 =(λ1,S1∗,0,0,0) is ⎥ ⎥ ⎥ ⎥ ⎥ ⎥ ⎥ ⎦ ⎤ ⎢ ⎢ ⎢ ⎢ ⎢ ⎢ ⎢ ⎣ ⎡ + + − − + + − + − − − − − − − = ∗ ∗ ∗ ∗ ) ( 0 0 0 0 ) ( 0 0 0 0 0 ) ( 0 0 0 0 0 ) ( ' ) ( 1 ) ( 1 ) ( ' 1 ) ( 2 2 2 2 2 1 2 1 1 1 1 1 1 1 1 1 1 1 2 2 2 2 1 1 1 1 1 1 1 1 1 γ δ γ λ γ δ β γ β λ λ d d f d S S S f R f y R f y y d y d S f y D E J
The eigenvalues of J(E1) are 0 ) ( 2 2 2 1=− +δ +γ < μ d 0 ) ( 1 2 2 2 = f λ −d < μ (by (H)) ) ( 1 1 1 1 1 3 β δ γ μ = ∗− + + d S 4
μ and μ5 are the eigenvalues of
⎥ ⎥ ⎥ ⎦ ⎤ ⎢ ⎢ ⎢ ⎣ ⎡− − − ∗ ∗ 0 ) ( ' ) ( ' 1 1 1 1 1 1 1 1 1 1 S f y d S f y D λ λ
which characteristic polynomial is
∗ ∗ + + + = 1 1 1 1 1 1 1 1 1 ) ( ' )) ) ( ' 1 ( ( ) ( f S y d S f y D
g μ μ μ λ λ . Then Reμ4,Reμ5 <0. Thus E1 is locally stable if 0μ3< i.e. β1S1∗ <d1+δ1+γ1 and E1 is unstable if μ3 >0, i.e. β1S1∗ >d1+δ1+γ1.
Next we shall show that if E1 is unstable then the equilibrium 1 (ˆ,ˆ1,ˆ1,0,0)
1 R S I
EI = exists
whereRˆ ,S , ˆ1 I satisfy (5), (6), (7). From (6), (7) we have the following Figure 6. ˆ1
Sinceλ1<Rˆ, from Figure 6 we have 1 1 1 1 1 (0) 1 1 1 1 1 1 1 1 1 1 ˆ ( ) m a m S R D y a d λ δ λ λ λ λ δ ⎛ ⎞ + ⎜ + ⎟ ⎝ ⎠ < − + + (0) 1 1 1 1 1 1 1 1 ( ) d d R D y δ γ λ β + + ⇔ < − 1 1 1 1 1 δ γ β > + + ⇔ ∗ d S
Thus instability of E1 implies the existence of E . The variational matrix of (1) at 1I1
) 0 , 0 , ˆ , ˆ , ˆ ( 1 1 11 R S I EI = is 1 1 1 1 1 1 2 2 1 1 1 2 2 1 1 1 1 1 1 1 1 1 1 1 2 2 2 2 2 2 1 ˆ ˆ ˆ 1 ˆ 1 ˆ 1 ˆ 1 ˆ '( )( ) ( ) ( ) ( ) ( ) ˆ ˆ ˆ ˆ '( ) 0 0 ˆ ( ) ˆ 0 0 0 0 ˆ 0 0 0 ( ) 0 0 0 0 ( ) I D f R S I f R f R f R f R y y y y y I f R S S S J E I f R d d γ β γ β γ δ γ ⎡− − + − − − − ⎤ ⎢ ⎥ ⎢ ⎥ ⎢ ⎥ − − + ⎢ ⎥ = ⎢ ⎥ ⎢ ⎥ ⎢ ⎥ ⎢ − ⎥ ⎢ ⎥ − + + ⎢ ⎥ ⎣ ⎦ The eigenvalues of ( ) 1 1I E J are 0 ) ( 2 2 2 1=− +δ +γ < μ d 2 2 2 = f (Rˆ)−d μ
and μ3, μ4, μ5 are eighenvalues of the 3×3 matrix
⎥ ⎥ ⎥ ⎥ ⎥ ⎥ ⎥ ⎦ ⎤ ⎢ ⎢ ⎢ ⎢ ⎢ ⎢ ⎢ ⎣ ⎡ + − − − − + − − 0 ˆ 0 ˆ ˆ ˆ ˆ ) ˆ ( ' ) ˆ ( 1 ) ˆ ( 1 ) ˆ ˆ )( ˆ ( ' 1 1 1 1 1 1 1 1 1 1 1 1 1 1 1 1 1 1 1 I S S I S R f R f y R f y I S R f y D β γ β γ
which characteristic polynomial is μ3+a1μ2 +a2μ+a3=0 where )) ˆ ˆ )( ˆ ( ' 1 ( ˆ ˆ 1 1 1 1 1 1 1 1 f R S I y D S I a =γ + + +
) ˆ ( ˆ ) ˆ ( 1 ˆ ) ˆ ( ' ) ˆ ˆ ))( ˆ ( ' 1 ( ˆ ˆ 1 1 1 1 1 1 1 1 1 1 1 1 1 1 1 1 2 β β γ γ + + + + − = f R I S y S R f I S R f y D S I a )) ˆ ˆ )( ˆ ( ' 1 )( ˆ ( ˆ ˆ ˆ ) ˆ ( ' ) ˆ ( 1 1 1 1 1 1 1 1 1 1 1 1 1 1 1 1 3 f R S I y D S I I S R f R f y a = β +β β −γ + +
From Routh-Hurwitz criterion,
1
1I
E is locally stable if a1a2 > . It is rather difficult to verify this a3 condition. In order to simplify the computation, we consider the case γ1 =0 to justify the
condition a1a2 > . When a3 γ1=0, a1a2 > becomes a3
)) ˆ ˆ )( ˆ ( ' 1 ( ˆ ˆ ˆ ˆ ) ˆ ( ' ) ˆ ( 1 ] ˆ ˆ )) ˆ ( 1 ˆ ) ˆ ( ' ))[( ˆ ˆ )( ˆ ( ' 1 ( 1 1 1 1 1 1 1 1 1 1 1 1 1 1 1 1 1 1 1 1 1 1 1 1 1 1 I S R f y D S I I S R f R f y S I R f y S R f I S R f y D + + + > + + + β β β β β 1 1 1 1 1 1 ˆ ) ˆ ˆ )( ˆ ( ' 1 I I S R f y D+ + >β ⇔ 1 1 1 1 1 1 1 1 1 1 ) 0 ( ) ˆ ( ˆ ) ˆ ( ) ˆ ( ) ˆ ( ' ) ˆ ( S f R d d d R f R f R f D R R D = − + − > − + ⇔ δ β Substitute R a R m R f ˆ ˆ ) ˆ ( 1 1 1 + = , 2 1 1 1 1 ) ˆ ( ) ˆ ( ' R a a m R f +
= into above, it follows that
) ˆ ( ˆ ˆ 1 1 1 ) 0 ( 1 ⎟ −λ ⎠ ⎞ ⎜ ⎝ ⎛ − > + R D d m R R a R If D≥(m1−d1), then 1 1I
E is locally stable. For the case D<(m1−d1), if Rˆ< Rˆ* then
1
1I E is
locally stable; if Rˆ > Rˆ∗ then
1
1I
E is unstable with 1-dimensional unstable manifold where R ˆ*
is the unique positive root of 1 1 ( 1) ) 0 ( 1 ⎟ −λ ⎠ ⎞ ⎜ ⎝ ⎛ − = + R D d m R R a R .
We note that μ2 <0 if and only if Rˆ <λ2. We shall prove that the instability condition Rˆ >λ2 implies the existence of the equilibrium 1 2 ( 2,~1,~1,~2,0)
1 S I S EI = λ . From (12), if S~2 >0 then ⎟ ⎟ ⎟ ⎟ ⎠ ⎞ ⎜ ⎜ ⎜ ⎜ ⎝ ⎛ + + + ⎟⎟ ⎠ ⎞ ⎜⎜ ⎝ ⎛ + > − 1 1 1 2 1 2 1 1 2 1 2 1 1 2 ) 0 ( 1 ˆ ) ( δ δ λ λ λ λ λ d a m S a m y D R .
implies the existence of the equilibrium E1I12.
The variation matrix of (1) at 1 2 ( 2,~1,~1,~2,0)
1 S I S EI = λ is ⎥ ⎥ ⎥ ⎥ ⎥ ⎥ ⎥ ⎥ ⎥ ⎥ ⎦ ⎤ ⎢ ⎢ ⎢ ⎢ ⎢ ⎢ ⎢ ⎢ ⎢ ⎢ ⎣ ⎡ + + − + − + − − − − − − − − + − − = ) ( ~ 0 0 0 0 ~ 0 0 0 ~ ) ( ' 0 0 0 ~ 0 0 0 ~ ~ ) ) ( ( ~ ) ( ' ) ( 1 ) ( 1 ) ( 1 ) ( 1 ~ ) ( ' 1 ) ~ ~ )( ( ' 1 ) ( 2 2 2 2 2 2 2 2 2 2 2 1 1 1 1 1 1 1 1 2 1 1 2 1 2 2 2 2 2 2 2 1 1 2 1 1 2 2 2 2 1 1 2 1 1 2 11 γ δ β γ β λ β γ β β λ λ λ λ λ λ λ λ d S S S f I S I d f S f f y f y f y f y S f y I S f y D E J I The eigenvalues of ( 1 2) 1 I E
J is μ1 =β2S~2−(d1+δ1+γ1) and μ , 2 μ3, μ , 4 μ5 which are eighenvalues of the 4× matrix 4
⎥ ⎥ ⎥ ⎥ ⎥ ⎥ ⎦ ⎤ ⎢ ⎢ ⎢ ⎢ ⎢ ⎢ ⎣ ⎡ + − − − − − − − + − − = 0 0 0 ~ ) ( ' 0 0 ~ 0 0 ~ ~ ) ) ( ( ~ ) ( ' ) ( 1 ) ( 1 ) ( 1 ~ ) ( ' 1 ) ~ ~ )( ( ' 1 2 2 2 1 1 1 1 1 1 1 1 2 1 1 2 1 2 2 2 2 1 1 2 1 1 2 2 2 2 1 1 2 1 1 S f I S I d f S f f y f y f y S f y I S f y D M λ β γ β β λ λ λ λ λ λ λ
It is difficult to verify all eigenvalues of the matrix M have negative real parts by Routh-Hurwitz criterion. In fact E1I12 may be stable or unstable, we note that μ1<0 if and only if
2 2 2 2 2 ~ β γ δ + + <d
S . It can be shown that the instability condition for (E1I12), μ1 >0 ⇔
2 2 2 2 2 ~ β γ δ + + > d
S implies the existence of the equilibrium 1 2 ( , 1, 1, 2, 2)
2 1 R S I S I EI I = . From (14) - (18), R satisfies R >λ2 >λ1 and ( ) 1 1 ( ) 2 2 2 2 2 2 2 2 2 1 1 1 1 1 1 1 1 1 ) 0 ( R h d R a R m S R a R m y d R a R m S R a R m y D R R = ⎟ ⎟ ⎟ ⎟ ⎠ ⎞ ⎜ ⎜ ⎜ ⎜ ⎝ ⎛ + + + + + ⎟ ⎟ ⎟ ⎟ ⎠ ⎞ ⎜ ⎜ ⎜ ⎜ ⎝ ⎛ + + + + = − δ δ δ δ .
From the following Figure 7 We have 2 2 2 1 1 1 2 1 2 1 1 2 1 2 1 1 2 ) 0 ( 1 1 ) ( d S y d a m S a m y D R + ⎟ ⎟ ⎟ ⎟ ⎠ ⎞ ⎜ ⎜ ⎜ ⎜ ⎝ ⎛ + + + + > − δ δ λ λ λ λ λ . Thus 2 2 2 2 2 2 1 1 1 2 1 2 1 1 1 1 1 2 1 2 1 1 2 ) 0 ( 1 1 ) ( β γ δ δ δ λ λ β γ δ λ λ λ > + + ⎟ ⎟ ⎟ ⎟ ⎠ ⎞ ⎜ ⎜ ⎜ ⎜ ⎝ ⎛ + + + + + + − − d d y d a m d a m y D R . ) ( 1 3 2 1 2 β β A A A − > where ( 2 2 2) 2 2 1= d +δ +γ y d A D R A ( 2) ) 0 ( 2 = −λ ⎟⎟ ⎠ ⎞ ⎜⎜ ⎝ ⎛ + + + + + + = 1 2 1 2 1 1 1 1 1 1 2 1 2 1 1 3 1 δ λ λ δ γ δ λ λ a m d d a m y A Figure 7
Literature Cited
S. B. Hsu 1978 Limiting behavior for competing species SIAM J. Applied Math. 34, 760-3
D. Herbert, R. Elsworth, and R. C. Telling 1956 The Continuous culture of bacteria; a theoretical and experimental study Journal of Canadian Microbiology 14, 601-22
E. O. Powell 1958 Criteria for the growth of contaiminants and mutants in continuous culture Journal of General Microbiology 18, 259-68
S. B. Hsu, S. P. Hubbell and P. Waltman A mathematical theory for single nutrient competition in continuous cultures of micro-organisms SIAM Journal on Applied Mathematics 32, 366-83
H. Smith and P. Waltman The Theory of Chemostat Cambridge Press 1994
Melanie J. Hatcher, J. T. A. Dick and A. M. Dunn, How parasites affect interaction between competitors and predators, Ecology Letters (2006) 9:1253-1271