Characteristics and prevalence of KRAS, BRAF, and PIK3CA mutations in colorectal
cancer by high-resolution melting analysis in Taiwanese population
Li-Ling Hsieh
a,c, Tze-Kiong Er
a,c, Chih-Chieh Chen
d, Jan-Sing Hsieh
e, Jan-Gowth Chang
a,f, Ta-Chih Liu
a,b,f,⁎
a
Division of Molecular Diagnostics, Department of Laboratory Medicine, Kaohsiung Medical University Hospital, Kaohsiung, Taiwan
bDivision of Hematology and Oncology, Department of Internal Medicine, Kaohsiung Medical University Hospital, Kaohsiung, Taiwan c
Graduate Institute of Medicine, College of Medicine, Kaohsiung Medical University, Kaohsiung, Taiwan
d
Institute of Bioinformatics and Systems Biology, National Chiao Tung University, Hsinchu, Taiwan
e
Department of Surgery, Kaohsiung Medical University Hospital, Kaohsiung, Taiwan
f
Institute of Clinical Medicine, College of Medicine, Kaohsiung Medical University, Kaohsiung, Taiwan
a b s t r a c t
a r t i c l e i n f o
Article history: Received 17 April 2012
Received in revised form 27 April 2012 Accepted 28 April 2012
Available online 8 May 2012 Keywords: Colorectal cancer KRAS gene BRAF gene PIK3CA gene Direct sequencing High-resolution melting
Background: The identification of KRAS, BRAF, and PIK3CA mutations before the administration of anti-epidermal growth factor receptor therapy of colorectal cancer has become important. The aim of the present study was to in-vestigate the occurrence of KRAS, BRAF, and PIK3CA mutations in the Taiwanese population with colorectal cancer. This study was undertaken to identify BRAF and PIK3CA mutations in patients with colorectal cancer by high-resolution melting (HRM) analysis. HRM analysis is a new gene scan tool that quickly performs the PCR and iden-tifies sequence alterations without requiring post-PCR treatment.
Methods: In the present study, DNAs were extracted from 182 cases of formalin-fixed, paraffin-embedded (FFPE) colorectal cancer samples for clinical KRAS mutational analysis by direct sequencing. All the samples were also tested for mutations within BRAF V600E and PIK3CA (exons 9 and 20) by HRM analysis.
Results: The results were confirmed by direct sequencing. The frequency of BRAF and PIK3CA mutations is 1.1%, and 7.1%, respectively. Intriguingly, we found that nine patients (4.9%) with the KRAS mutation were coexistent with the PIK3CA mutation. Four patients (2.2%) without the KRAS mutation were existent with the PIK3CA mutation. Two patients (1.1%) without the KRAS mutation were existent with the BRAF mutation.
Conclusions: In the current study, we suppose that HRM analysis is rapid, feasible, and powerful diagnostic tool for the detection of BRAF and PIK3CA mutations in a clinical setting. Additionally, our results indicated the prevalence of KRAS, BRAF, and PIK3CA mutational status in the Taiwanese population.
© 2012 Elsevier B.V. All rights reserved.
1. Introduction
Colorectal cancer (CRC) is the third most frequent tumor worldwide, with >70,000 new cases per year for both sexes in the United States[1]. Similarly, CRC is the third leading cause of cancer deaths in both sexes in the Taiwanese population[2]. Recently, significant improvements have been made in patient survival, after metastasis development, by im-proving new therapies. Anti-EGFR-targeted therapies with monoclonal antibodies such as cetuximab and panitumumab are a successful strate-gy for the treatment of metastatic CRC or after the failure of convention-al chemotherapy. These agents bind the epidermconvention-al growth receptor (EGFR) on tumors cells and then block the downstream intracellular signaling pathways. One member of this pathway is KRAS and much ev-idence shows that the patients with KRAS mutations do not benefit from
the addition of cetuximab or panitumumab to standard chemotherapy
[3]. Therefore, KRAS mutation testing should be performed in all indi-viduals with advanced CRC refractory tofirst-line regimens to identify which patient's tumors will not respond to the expensive monoclonal antibody inhibitors of EGFR.
KRAS encodes a membrane-associated GTPase that is an early player in many signal transduction pathways. KRAS acts as a molecular on/off switch that recruits and activates proteins that are necessary for the propagation of growth factor and other receptor signals, such as c-Raf and PI 3-kinase. When activated, KRAS is involved in the dephosphory-lation of GTP to GDP, after which it is turned off. The rate of GTP to GDP conversion can be dramatically accelerated by an accessory protein of the guanine nucleotide activating protein (GAP) class, for example, RasGAP[4]. In CRCs, KRAS point mutations occur early in the adenoma– carcinoma sequence and are believed to contribute to the growth and in-creased atypia of adenomas[5]. Activating mutations of the KRAS gene have been widely studied as markers for cancer prognosis. These gene mutations, principally in codons 12 and 13, occur in approximately one-half of CRCs, and population-based studies have suggested that the muta-tions might be associated with some tumor phenotypes[6]. Recently, ⁎ Corresponding author at: Division of Molecular Diagnostic, Department of Laboratory
Medicine, Kaohsiung Medical University Hospital, 100 Shih-Chuan 1st Rd., Kaohsiung, Taiwan.
E-mail address:d730093@cc.kmu.edu.tw(T.-C. Liu).
0009-8981/$– see front matter © 2012 Elsevier B.V. All rights reserved. doi:10.1016/j.cca.2012.04.029
Contents lists available atSciVerse ScienceDirect
Clinica Chimica Acta
high-resolution melting (HRM) analysis has been applied for use in the screening for the KRAS mutation in CRC[7].
BRAF, a member of the RAF gene family (BRAF, ARAF1, and RAF1), encodes a serine–threonine protein kinase that is a downstream ef-fector of activated KRAS. Mutated BRAF activates a signaling cascade involving proteins in the mitogen-activated protein kinase system, resulting in cell proliferation[8]. Approximately 15% of CRC have the BRAF mutation and this is relevant to poor prognosis[9]. The hotspot mutation is the T-to-A transversion at nucleotide 1796 causing V600E. This mutation is predisposed to the inhibition of apoptosis and also aids in increasing invasiveness[10]. Meanwhile, KRAS and BRAF muta-tions are mutually exclusive in CRC[11]. This suggests that they occur in different tumor types and might have different outcomes. On the other hand, studies showed that the BRAF V600E mutation confers resis-tance to EGFR monoclonal antibodies in patients with chemotherapy-refractory KRAS-wild-type metastatic CRC[12]. Moreover, a part of CRC patients without in KRAS and BRAF mutations fails to respond to anti-EGFR therapy, and this may be due to mutations in the PIK3 gene.
The PIK3s are a family of lipid kinases that are grouped into classes with a different structure and substrate preference [13]. PIK3Ks are heterodimeric kinases that are involved in the control of cellular growth, transformation, adhesion, and also apoptosis[14]. Several studies showed that the p110α isoform which is encoded by PIK3CA is mutated in ap-proximately 15–18% of CRCs[15,16]. In CRCs, more than 80% of PIK3CA mutations occur in either exon 9 or exon 20[11].
HRM analysis is rapidly becoming the most important mutation-scanning methodology that allows mutation mutation-scanning and genotyping without the need for costly labeled oligonucleotides. It is a closed-tube method, indicating that PCR amplification and subsequent analysis are sequentially performed in the well, making it more convenient than other scanning methodologies. Recently, we have used this method of genotyping and mutation scanning[7,17,18]. The aim of this study was to understand the KRAS, BRAF, and PIK3CA gene status in a Taiwanese co-hort of CRC patients using direct DNA sequencing and HRM analysis. 2. Materials and methods
2.1. Sample preparation and DNA extraction
The specimens consisted of 182 formalin-fixed, paraffin-embedded (FFPE) colorectal adenocarcinomas submitted for clinical KRAS muta-tional analysis. All samples were tested for BRAF V600E and PIK3CA mu-tations within exon 9 and exon 20. FFPE samples were deparaffinized and air dried, subsequently, DNA was isolated using the proteinase K and QIAamp® mico DNA extraction kit (QIAGEN) according to the man-ufacturer's protocol.
2.2. Design of primers for HRM assay
A good amplicon design is essential for obtaining robust and repro-ducible HRM analysis. The difference between wild-type and heterozy-gote curves becomes smaller and more difficult to differentiate when the product length increases. Besides, extra care is needed to design PCR reactions that avoid primer dimers and non-specific amplification in HRM analysis.
DNA samples were amplified for the KRAS regions, including codons 12 and 13, using primers according to the previously published works
[7]. The 153 bp PCR products with a single band were resolved on 2% agarose gels and visualized after staining with ethidium bromide. The cycling conditions for KRAS codons 12 and 13 involved a 35-cycle PCR program (denaturation at 96 °C for 10 s; annealing at 50 °C for 5 s; and elongation at 60 °C for 4 min). Mutation status was determined by direct sequencing.
The set of primers for HRM, specific for BRAF V600E and PIK3CA exon 9 and exon 20, were designed while fulfilling the requirements of the LightCycler® 480 System Gene Scanning Assay. All the amplicons were
designed to be smaller than 300 bp. In the present study, the three pairs of primers for HRM analysis were selected using Primer3 software
(Table 1). Appropriate primers were named as H1–H6 as shown in
Table 1. All the primers synthesized were all of standard molecular biol-ogy quality (Protech Technolbiol-ogy Enterprise Co., Ltd, Taiwan).
2.3. The HRM technique
PCR reactions were carried out in a 10μl final volume using the LightCycler ® 480 High-Resolution Melting Master (Reference 04909631001, Roche Diagnostics) 1 × buffer– containing Taq poly-merase, nucleotides and the dye ResoLight– and 20 ng DNA. The primers and MgCl2were used at a concentration of 0.25μM and 2.5 mM,
respec-tively, for identifying the mutation status of BRAF V600E, PIK3CA exon 9, and exon 20.
The HRM assays were conducted using the LightCycler® 480 Instru-ment (Roche Diagnostics) provided with the software LightCycler® 480 Gene Scanning Software Version 1.5 (Roche Diagnostics).
The PCR program required a SYBR Green Ifilter (533 nm), and it con-sisted of an initial denaturation–activation step at 95 °C for 10 min, followed by a 45-cycle program (denaturation at 95 °C for 15 s, annealing at 60 °C or 62 °C (Table 1) for 15 s, and elongation at 72 °C for 15 s with reading of thefluorescence; acquisition mode: single). The melting pro-gram included three steps: denaturation at 95 °C for 1 min, renaturation at 40 °C for 1 min, and subsequent melting that consists of a continuous fluorescent reading of fluorescence from 60 to 90 °C at the rate of 25 ac-quisitions per °C.
2.4. Gene scanning
The melting curve analysis performed by the Gene Scanning Soft-ware consists of three steps: normalization of melting curves, which involves equaling to 100% of the initialfluorescence and to 0% of the fluorescence remnant after DNA dissociation: shifting of the tempera-ture axis of the normalized melting curves to the point where the entire double-stranded DNA is completely denatured: and,finally, the genera-tion of difference plots, allowing the capture of the differences in melt-ing profile between the reference sample curves from the test samples. If the shape of the melting curves is not similar to each other, then we will confirm it by direct DNA sequencing to prevent a false negative result. Furthermore, an analysis of the melting curves with a high-sensitivity set-ting of 0.5 was carried out by Gene Scanning Software (the default sensi-tivity setting of the Gene Scanning Software is 0.3.).
2.5. Direct sequencing
To confirm the results of HRM analysis, sequencing analysis was also performed in all samples. After HRM analysis, the samples were purified using a PCR-M™ clean-up system (VIOGEN, Sunnyvale CA 94086, U.S.A.). The PCR products generated after HRM were directly sequenced. The se-quence reaction was performed in afinal volume of 10 μl, including 1 μl of the purified PCR product, 2.5 μM of one of the PCR primers, 2 μl of the ABI PRISM terminator cycle sequencing kit v3.1 (Applied Biosystems)
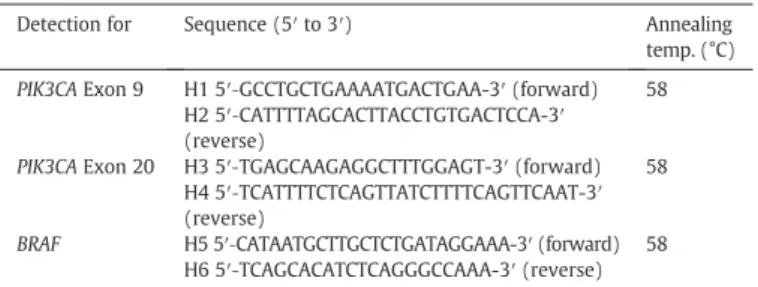
Table 1
Primers use for HRM analysis of BRAF and PIK3CA gene mutation.
Detection for Sequence (5′ to 3′) Annealing
temp. (°C) PIK3CA Exon 9 H1 5′‐GCCTGCTGAAAATGACTGAA-3′ (forward) 58
H2 5′‐CATTTTAGCACTTACCTGTGACTCCA-3′ (reverse)
PIK3CA Exon 20 H3 5′‐TGAGCAAGAGGCTTTGGAGT-3′ (forward) 58 H4 5′‐TCATTTTCTCAGTTATCTTTTCAGTTCAAT-3′ (reverse)
BRAF H5 5′‐CATAATGCTTGCTCTGATAGGAAA-3′ (forward) 58 H6 5′‐TCAGCACATCTCAGGGCCAAA-3′ (reverse)
and 2μl 5× sequence buffer. The sequencing program is a 25-cycle PCR program (denaturation at 96 °C for 10 s; annealing at 50 °C for 5 s; and elongation at 60 °C for 4 min). The sequence detection was performed in the ABI Prism 3130 Genetic Analyzer (Applied Biosystems) according to standard protocols.
3. Results
3.1. Mutational status
KRAS mutations were detected in 61 patients (33.5%) by direct se-quencing. In particular, only 2 (P14 and P15) patients harbor BRAF mutations, and all these were KRAS wild-type tumors, as shown in
Table 2. None of the 61 CRC patients with KRAS mutations harbors a con-comitant mutation in BRAF. Intriguingly, concon-comitant PIK3CA and KRAS mutations were observed in 9 patients (P1~P7, P12, and P13), as shown inTable 2. On the other hand, 4 patients (P8~P11) harbor PIK3CA muta-tions, and all these were KRAS wild-type tumors, as shown inTable 2. The frequency of KRAS, BRAF, and PIK3CA mutational status is summarized inFig. 4.
3.2. Application of HRM analysis for the PIK3CA mutation analysis in co-lorectal samples by HRM analysis
The normalized and temperature-shifted difference plots, the melt-ing profile obtained from CRCs carrying mutation of the PIK3CA muta-tion in exon 9 were shown inFig. 1(A). Each mutation (c.1634G> C, c.1633G > A, and c.1633A > G) could be readily and accurately identified in the difference plot curves. Sequencing analysis was performed in all samples using the same PCR products after melting analysis. As previ-ously described, the results of the HRM analysis were confirmed by Table 2
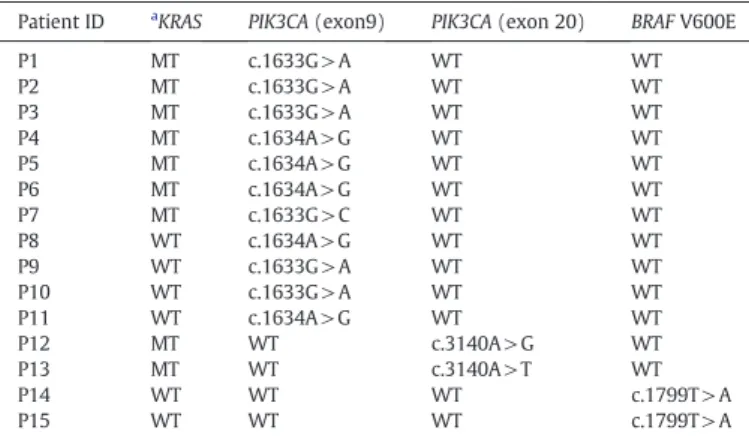
Mutational status of 15 patients detected by HRM analysis and confirmed by direct DNA sequencing for the BRAF and PIK3CA genes.
Patient ID aKRAS PIK3CA (exon9) PIK3CA (exon 20) BRAF V600E
P1 MT c.1633G > A WT WT P2 MT c.1633G > A WT WT P3 MT c.1633G > A WT WT P4 MT c.1634A > G WT WT P5 MT c.1634A > G WT WT P6 MT c.1634A > G WT WT P7 MT c.1633G > C WT WT P8 WT c.1634A > G WT WT P9 WT c.1633G > A WT WT P10 WT c.1633G > A WT WT P11 WT c.1634A > G WT WT P12 MT WT c.3140A > G WT P13 MT WT c.3140A > T WT P14 WT WT WT c.1799T > A P15 WT WT WT c.1799T > A
aKRAS mutation was identified by direct sequencing WT: wild-type MT: mutant.
Fig. 1. Representative cases of PIK3CA gene (exon 9) detection in patients with CRC using HRM analysis.(A) The normalized and temperature-shifted difference plot for the mutation screening of PIK3CA gene (exon 9). Sequencing results confirm the (B) wild-type and the presence of the PIK3CA gene (exon 9) mutation: (C) c.1634G > C, (D) c.1633G> A, (E) c.1633A > G.
direct sequencing. The electropherograms of representative patients with WT samples and the PIK3CA mutation in exon 9 were shown in
Fig. 1(B)–(D).
In addition, the normalized and temperature-shifted difference plots, the melting profile obtained from CRCs carrying the PIK3CA muta-tion in exon 20 were shown inFig. 2(A). Each mutation (c.3140A> G and c.3140A > T) could be readily and accurately identified in the differ-ence plot curves. The electropherograms of the representative patients with WT samples and the PIK3CA mutation in exon 20 were shown in
Fig. 1(B)–(C).
3.3. Application of HRM analysis for the BRAF V600E mutation analysis in colorectal samples by HRM analysis
The normalized and temperature-shifted difference plots, the melt-ing profile obtained from CRCs carrying mutation of the BRAF V600E mutation were shown inFig. 3(A). The mutation (c.1799T > A) could be readily and accurately identified in the difference plot curves. Se-quencing analysis was performed in all samples using the same PCR products after melting analysis. As previously described, the results of HRM analysis were confirmed by direct sequencing. The electrophero-grams of the representative patients with WT samples and the BRAF V600E mutation were shown inFig. 3(B)–(C).
4. Discussion
Nowadays, mutation analysis of definite genes has already been in-corporated in the treatment of CRC patients. Therefore, the demand for a fast and reliable diagnostic tool is increasing. The aim of this study was to develop a sensitive test that allows the molecular characterization of hotspot mutations in BRAF and PIK3CA genes. In this study, we have suc-cessfully established a diagnostic strategy by HRM analysis for identifying the BRAF and PIK3CA mutations of 182 CRC patients in southern Taiwan. On the other hand, we demonstrate the distribution of KRAS, BRAF and PIK3CA gene mutations in a Taiwanese population.
HRM is rapidly gaining acceptance as the most important mutation scanning methodology. It is a closed-tube method, indicating that PCR amplification and subsequently analysis are sequentially performed in the well. This makes it more convenient than other scanning methodolo-gies. The differences between the WT and heterozygote curves become smaller and more difficult to differentiate when the product length in-creases[19]. In fact, all of the heterozygous mutants are easily identified from their melting curves. Heterozygotes were easily identified because heteroduplexes altered the shape of the melting curves[19]. These differ-ences are best visualized using difference plots because slight differdiffer-ences in curve shape and melting temperature (Tm) become obvious. Moreover,
direct sequencing was still the gold-standard methodology in most clin-ical laboratories to detect and confirm gene mutation. However, direct
Fig. 2. Representative cases of PIK3CA gene (exon 20) detection in patients with CRC using HRM analysis.(A) The normalized and temperature-shifted difference plot for the mu-tation screening of PIK3CA gene (exon 20). Sequencing results confirm the (B) wild-type and the presence of the PIK3CA gene (exon 20) mumu-tation: (C) c.3140A>G, (D) c.3140A>T.
sequencing is rarely sensitive below 10% mutant allele frequency, which corresponds to a threshold of 25% tumor cells that are heterozygous for a mutation[20,21]. Earlier, we had demonstrated that the analytical sensitivity was 5% for screening of the KRAS mutation using HRM analysis [7]. Our previous report indicated that HRM analysis is a double-edged sword having both advantages and disadvantages. The dis-advantage of the HRM analysis is its inability to identify which codon is mutated. The advantage of HRM analysis however, is its feasibility and high accuracy method for screening gene mutation. In addition, the PCR amplification products obtained from HRM analysis could be directly used for direct sequencing without any pretreatment. If the clinical sam-ple is detected by HRM as the wild-type form, then all the wild-type results can be quickly reported to the clinicians. Thus, employing HRM analysis for the wild types can be quickly ruled out in large-scale clinical samples. In the current study, if an abnormal melting curve is noted, then the precise mutation should be confirmed by direct sequencing.
KRAS and BRAF mutations that are mutually exclusive in CRCs have been previously reported in several studies[22,23]. Similarly, the analysis of our results confirmed that none of the 182 CRCs with KRAS mutations had a concomitant mutation in BRAF. Numerous studies have implicated the frequency of BRAF mutations in different populations. The overall BRAF V600E mutational rate ranges from 3.3% to 13% in the different populations. Two recent studies demonstrated that the frequency of BRAF mutations is approximately 6.25% and 13% in CRCs patients, re-spectively, in the Spanish population[24,25]. Similarly, Nicolantonio
et al.[23]found that the BRAF mutation is approximately 10% of CRCs. Simi L and et al.[26]demonstrated that the frequency of BRAF muta-tions is approximately 9.5% of CRCs patients in the Italian population. Saridaki et al.[27]indicated that the frequency of BRAF mutations is 7.2% of CRCs in the Greece population. In the Asian population, Li HT et al. showed that the frequency of the BRAF mutations is approximately 7% of CRCs in the Chinese population[28], and Kwon MJ et al. showed that the frequency of the BRAF mutations is approximately 3.3% of CRCs in the Korean population[29]. In the Taiwanese population, the frequency of BRAF mutations is reported as being about 3.8% of 314 CRCs patients[30]. It should be noted that the frequency of BRAF muta-tions is 1.1% of the KRAS wild-type patients (as shown inFig. 5) in the present study. We suppose that the lower frequency of BRAF mutations in our series of CRC patients could be due to the small sample size and dif-ferent ethnic populations. Future works are required to confirm these data by including more CRC samples.
As just mentioned, the PIK3CA mutation has also been suggested as being a biomarker of anti-EGFR monoclonal antibody resistance. Till very recently, the correlation between PIK3CA mutations and the re-sponse to the anti-EGFR monoclonal antibody is still a debating issue
[31,32]. There are numerous discrepancies in the PIK3CA gene
muta-tional status reported from several studies, and the results indicated different percentages ranging from 6.5% to 18%[11,15,16]. Most of the studies showed the distribution of PIK3CA hotspot mutations located at exon 9 and exon 20, whereas mutations that appear at exon 9 were the Fig. 3. Representative cases of BRAF gene (V600E) detection in patients with CRC using HRM analysis.(A) The normalized and temperature-shifted difference plot for the mutation screening of BRAF gene (V600E). Sequencing results confirm the (B) wild-type and the presence of the BRAF gene mutation: (C) c.1799T>A.
most frequent[15,16]. The PIK3CA mutations were detected in approxi-mately 13% of CRC patients in the United States and European countries
[11,16,31–33]. In the Chinese and Korean population, the frequency of the PIK3CA mutations that were detected in CRC patients is 12.5% and 6.5%, re-spectively[28,29]. In the present study, we showed that 7.1% of CRCs pa-tients harbor PIK3CA mutations, and our results were similar to those by Kwon MJ et al.[29], who indicated that the prevalence of PIK3CA muta-tions in 92 CRCs patients was 6.5% using the PNA-mediated PCR clamping method. Intriguingly, Lin JK et al.[34]showed that no PIK3CA mutation was found in 42 metastatic CRC patients in the Taiwanese population. It should also be noted that about 30% of PIK3CA somatic mutations couple with another oncogene mutation, especially represented by the KRAS gene[35]. Besides, the presence of PIK3CA mutations was associated with a poor prognosis and with an increase in colorectal cancer-specific mortality[36]. Our results showed that 9 patients (4.9%) with the KRAS mutation were coexistent with the PIK3CA mutation and 4 patients (2.2%) without the KRAS mutation were coexistent with the PIK3CA muta-tion (as shown inFig. 4). In the present study, we did not provide relevant information about patients' responses, therefore, future works are quired to prove whether some patients who present PIK3CA could be re-sponders to anti-EGFR therapies or not.
In the current study, we also intended to model the proteins encoded by BRAF and PIK3CA genes, respectively, in order to understand the struc-tural implications of the mutations identified in this study. The atomic
coordinates of the crystal structure for the human BRAF kinase domain were retrieved from the protein data bank[37](PDB entry: 1UWH
[38]. The region not solved in the crystal structure, residues 601–612, was modeled using the loop-building routine in MODELLER[39]. The model of human BRAF model is shown inFig. 5. Most of the mutations of BRAF are clustered in two different regions within the binding pocket: (1) the glycine-rich P-loop (yellow) of the N-lobe; (2) the activation seg-ment, A-loop (red). The BRAF hotspot mutation, V600E, located at the A-loop is highlighted in red spheres. This mutation may disrupt an inac-tive conformation of BRAF kinase[38]. Therefore, BRAF V600E increases the kinase activity that provides cancer cells with both proliferation and survival signals and promotes them to become tumors in the model sys-tem[38].
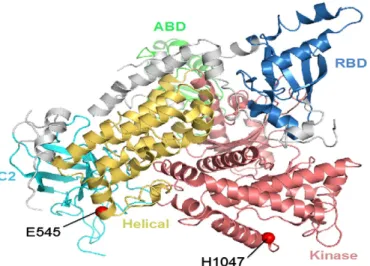
The crystal structure of Human p110α (p110α; encoded by the PIK3CA gene) was obtained from the protein data bank[37](PDB entry: 2RD0[40](Fig. 6). Most of the reported mutations are reported in the PIK3CA cluster in conserved regions within the region coding for the he-lical (yellow) and kinase (red) domain of p110α[41]. Indeed, the PIK3CA mutations identified in the current study, the E545 and H1047, are located at the helical domain and kinase domain, respectively. The residues of E545 and H1047 are highlighted in red spheres (Fig. 6). Studies showed that mutant E545 inhibits the activity of the catalytic subunit, because it interacts with L379 and A340 of the p85 nSH2 domain[42]. The mutant H1047 has a direct effect on the conformation of the activation loop, changing its interaction with phosphatidylinositide substrates[40].
In conclusion, we demonstrate that HRM analysis is a rapid, feasible, and powerful diagnostic tool for the detection of BRAF and PIK3CA mu-tations in a clinical setting. Additionally, our results indicated the prev-alence of KRAS, BRAF, and PIK3CA mutational status in the Taiwanese population.
Acknowledgments
We are grateful to both the hardware and software supports of the Structural Bioinformatics Core Facility at National Chiao Tung University. References
[1] Jemal A, Bray, Center MM, et al. Global cancer statistics. CA Cancer J Clin 2011;61: 69–90.
[2] Department of Health. Health and vital statistics. Taipei: Department of Health, Executive Yuan; 2007.
[3] Allegra CJ, Jessup JM, Somerfield MR, et al. American Society of Clinical Oncology provisional clinical opinion: testing for KRAS gene mutations in patients with met-astatic colorectal carcinoma to predict response to anti-epidermal growth factor receptor monoclonal antibody therapy. J Clin Oncol 2009;27:2091–6.
[4] Chang DZ, Kumar V, Ma Y, et al. Individualized therapies in colorectal cancer: KRAS as a marker for response to EGFR-targeted therapy. J Hematol Oncol 2009;22:2–18.
Fig. 6. The structure of human p110α protein.
Fig. 5. The structure of human BRAF protein. Fig. 4. Frequency of KRAS, BRAF, and PIK3CA mutational status.
[5] Fearon ER, Volgelstein B. A genetic model for colorectal tumorigenesis. Cell 1990;61: 759–67.
[6] Park JH, Kim IJ, Kang HC, et al. Oligonucleotide microarray-based mutation detec-tion of the K-ras gene in colorectal cancers with use of competitive DNA hybridi-zation. Clin Chem 2004;50:1688–91.
[7] Er TK, Chang YS, Yeh KT, et al. Comparison of two different methods for the screening of KRAS mutation in colorectal cancer. Clin Lab 2010;56:175–86. [8] Kolch W. Meaningful relationships: the regulation of the Ras/Raf/MEK/ERK
path-way by protein interactions. Biochem J 2000;351:289–305.
[9] Roth AD, Tejpar S, Delorenzi M, et al. Prognostic role of KRAS and BRAF in stage II and II resected colon cancer: result of the translational study on the PETACC-3, EORTC 40933, SAKK 60‐00 trial. J Clin Oncol 2010;28:466–74.
[10] Minoo P, Moyer MP, Jass JR. Role of BRAF-V600E in the serrated pathway of colo-rectal tumourigenesis. J Pathol 2007;212:124–33.
[11] De Roock W, Claes B, Bernasconi D, et al. Effects of KRAS, BRAF, NRAS, and PIK3CA mutations on the efficacy of cetuximab plus chemotherapy in the chemotherapy-refractory metastatic colorectal cancer: a retrospective consortium analysis. Lan-cet Oncol 2010;11:753–62.
[12] Laurent-Puig P, Cayre A, Manceau G, et al. Analysis of PTEN, BRAF, and EGFR status in determining benefit from cetuximab therapy with wild-type KRAS metastatic colon cancer. J Clin Oncol 2009;27:5924–30.
[13] Markman B, Atzori F, Perez-Garcia H, et al. Status of PI3K inhibition and biomarker development in cancer therapeutics. Ann Oncol 2010;21:683–91.
[14] Karakas B, Bachman KE, Park BH. Mutation of the PIK3CA oncogene in human cancers. Br J Cancer 2006;94:455–9.
Samuels Y, Ericson K. Oncogenic PI3K and its role in cancer. Curr Opin Oncol 2006;18: 77–82.
[15] Nosho K, Kawasaki T, Ohnishi, et al. PIK3CA mutation in colorectal cancer: rela-tionship with generic and epigenetic alterations. Neoplasia 2008;10:534–41. [16] Barault L, Veyrie N, Jooste V, et al. Mutations in the RAS-MAPK, PI(3)K
(phosphatidylinositol-3-OH-kinase) signaling network correlate with poor sur-vival in a population-based series of colon cancers. Int J Cancer 2008;122:2255–9. [17] Chang CC, Lin PC, Lin CH, et al. Rapid identification of CYP2C8 polymorphism by
high resolution melting analysis. Clin Chim Acta 2012;413:298–302.
[18] Lin YC, Lin YC, Liu TC, et al. High-resolution melting curve (HRM) analysis to es-tablish CYP21A2 mutations converted from the CYP21A1P in congenital adrenal hyperplasia. Clin Chim Acta 2011;412:1918–23.
[19] Reed GH, Wittwer CT. Sensitivity and specificity of single-nucleotide polymorphism scanning by high-resolution melting analysis. Clin Chem 2004;50:1748–54. [20] Pao W, Wang TY, Riely GJ, et al. KRAS mutations and primary resistance of lung
adenocarcinomas to gefitinib or erlotinib. PLoS Med 2005;2:57–61.
[21] Faller MB, Legrain M, Voegeli AC, et al. Detection of K-Ras mutations in tumor samples of patients with non-small cell lung cancer using PNA-mediated PCR clamping. Br J Cancer 2009;100:985–92.
[22] Amado RG, Wolf M, Peeters M, et al. Wild-type KRAS is required for panitumumab ef-ficacy in patients with metastatic colorectal cancer. J Clin Oncol 2008;26:1626–34 [Di]. [23] Di Nicolantonio F, Martini M, Molinari F, et al. Wild-type BRAF is required for re-sponse to panitumumab or cetuximab in metastatic colorectal cancer. J Clin Oncol 2008;26:5705–12.
[24] Borràs E, Jurado I, Hernan I, et al. Clinical pharmacogenomic testing of KRAS, BRAF and EGFR mutations by high resolution melting analysis and ultra-deep pyrosequencing. BMC Cancer 2011;11:406.
[25] Herreros-Villanueva M, Rodrigo M, Claver M, et al. KRAS, BRAF, EGFR and HER2 gene status in a Spanish population of colorectal cancer. Mol Biol Rep 2011;38:1315–20. [26] Simi L, Pratesi N, Vignoli M, et al. High-resolution melting analysis for rapid
detec-tion of KRAS, BRAF, and PIK3CA gene mutadetec-tions in colorectal cancer. Am J Clin Pat-hol 2008;130:247–53.
[27] Saridaki Z, Tzardi M, Papadaki C, et al. Impact of KRAS, BRAF, PIK3CA mutations, PTEN, AREG, EREG expression and skin rash in≥2nd line cetuximab-based therapy of colorectal cancer patients. PLoS One 2011;26:e15980.
[28] Li HT, Lu YY, An YX, et al. KRAS, BRAF and PIK3CA mutations in human colorectal cancer: relationship with metastatic colorectal cancer. Oncol Rep 2011;25:1691–7. [29] Kwon MJ, Lee SE, Kang SY, et al. Frequency of KRAS, BRAF, and PIK3CA mutations in
advanced colorectal cancers: comparison of peptide nuclei acid-mediated PCR clamping and direct sequencing in formalin-fixed, paraffin-embedded tissue. Pat-hol Res Pract 2011;207:762–8.
[30] Liou JM, Wu MS, Shun CT, et al. Mutations in BRAF correlate with poor survival of colorectal cancers in Chinese population. Int J Colorectal Dis 2011;26:1387–95. [31] Sartore-Bianchi A, Martini M, Molinari F, et al. PIK3CA mutations in colorectal
can-cer are associated with clinical resistance to EGFR-targeted monoclonal anti-bodies. Cancer Res 2009;69:1851–7.
[32] Prenen H, De SJ, Jacobs B, De RW, et al. PIK3CA mutations are not major determi-nation of resistance to the epidermal growth factor receptor inhibitor cetuximab in metastatic colorectal cancer. Clin Cancer Res 2009;15:3184–8.
[33] Ogino S, Nosho K, Kirkner GJ, et al. PIK3CA mutation is associated with poor prog-nosis among patients with curativelt resected colon cancer. J Clin Oncol 2009;27: 1477–84.
[34] Lin JK, Lin AJ, Lin CC, et al. The status of EGFR-associated genes could predict the outcome and tumor response of chemo-refractory metastatic colorectal patients using cetuximab and chemotherapy. J Surg Oncol 2011;104:661–6.
[35] Thomas RK, Baker AC, Debiasi RM, et al. Oncogenic insertional mutations in the P-loop of Ras are overactive in MAP kinase signaling. Oncogene 2000;19:5367–76. [36] Baldus SE, Schaefer KL, Engers R, et al. Prevalence and heterogeneity of KRAS, BRAF, and PIK3CA mutations in primary colorectal adenocarcinomas and their corresponding metastases. Clin Cancer Res 2010;16:790–9.
[37] Berman HM, Westbrook J, Feng Z, et al. The Protein Data Bank. Nucleic Acids Res 2000;28:235–42.
[38] Wan PT, Garnett MJ, Roe SM, et al. Mechanisms of activation of the RAF-ERK sig-naling pathway by oncogenic mutation of B-RAF. Cell 2004;116:855–67. [39] Sali A, Blundell TL. Comparative protein modeling by satisfaction of spatial
re-straints. J Mol Biol 1993;234:779–815.
[40] Huang CH, Mandelker D, Schmidt-Kittler O, et al. The structure of a human p110α/p85α complex elucidates the effects of oncogenic PI3Kα mutations. Science 2007;318: 1744–8.
[41] Samuels Y, Wang Z, Bardelli A, et al. High frequency of mutations of the PIK3CA gene in human cancers. Science 2004;304:554.
[42] Miled N, Yan Y, Hon WC, et al. Mechanism of two classes of cancer mutations in the phosphoinositide 3-kinase catalytic subunit. Science 2007;317:239–42.