For more than 30 years, expression divergence has been considered as a major reason for retaining duplicated genes in a genome, but how often and how fast duplicate genes diverge in expression has not been studied at the genomic level. Using yeast microarray data, we show that expression divergence between duplicate genes is significantly correlated with their synonymous divergence (KS) and also with their nonsynonymous divergence (KA) if KA≤≤ 0.3. Thus, expression divergence increases with evolutionary time, and KAis initially coupled with expression divergence. More interestingly, a large proportion of duplicate genes have diverged quickly in expression and the vast majority of gene pairs eventually become divergent in expression. Indeed, more than 40% of gene pairs show expression divergence even when KSis ≤≤0.10, and this proportion becomes >>80% for KS>> 1.5. Only a small fraction of ancient gene pairs do not show expression divergence. Published online: 01 November 2002 Expression divergence between duplicate genes has long been a subject of great interest to geneticists and evolutionists [1–4]. Indeed, Ohno [2] and others [3,4] had proposed expression divergence as the first step towards the retention of duplicate genes. In the past, however, studies of expression divergence were usually conducted for a limited number of gene families, providing no general picture of the rate of expression
divergence between duplicate genes in a genome. Fortunately, a general picture can now be seen thanks to the advent of microarray gene expression technology (Box 1) and the complete sequences of many genomes. Indeed, using the microarray technology, Ferea et al. [5] showed that rapid change in gene expression can occur in experimental lineages of yeast.
These advances notwithstanding, there remains the difficulty of dating the divergence time between two duplicate genes, which is needed for inferring the rate of expression divergence. In a
pioneering study using microarray data from Saccharomyces cerevisiae, Wagner [6] found no significant correlation
(−0.30, P=0.18) between expression divergence and protein sequence divergence (d) between duplicate genes, and concluded that expression divergence and sequence divergence are decoupled. This result, however, does not imply that expression divergence and evolutionary time are decoupled because d might not be a good proxy of divergence time. Because the rate of amino acid
substitution varies tremendously among proteins [7,8], no single d value can be applied to date the divergence times of different protein or gene pairs. By comparison, the rate of synonymous substitution is more uniform among genes [7,8], and so KSis a better proxy of divergence time. We shall therefore rely more on KSthan d.
To avoid using correlated data points, we selected independent pairs of duplicate genes in the yeast genome (Box 2).
For each gene family, we started with the pair with the smallest KSand continued selecting pairs with increasing KS, because gene pairs with a small KSare fewer than those with a large KSand because a smaller KS can more accurately reflect the time course of expression divergence. Moreover, we selected gene pairs where neither duplicate shows strong codon usage bias, because this bias can retard the increase of KSso as to make KSa poor proxy of divergence time. Then we analysed the expression divergence for each gene pair using expression data from microarray analyses (see Box 2).
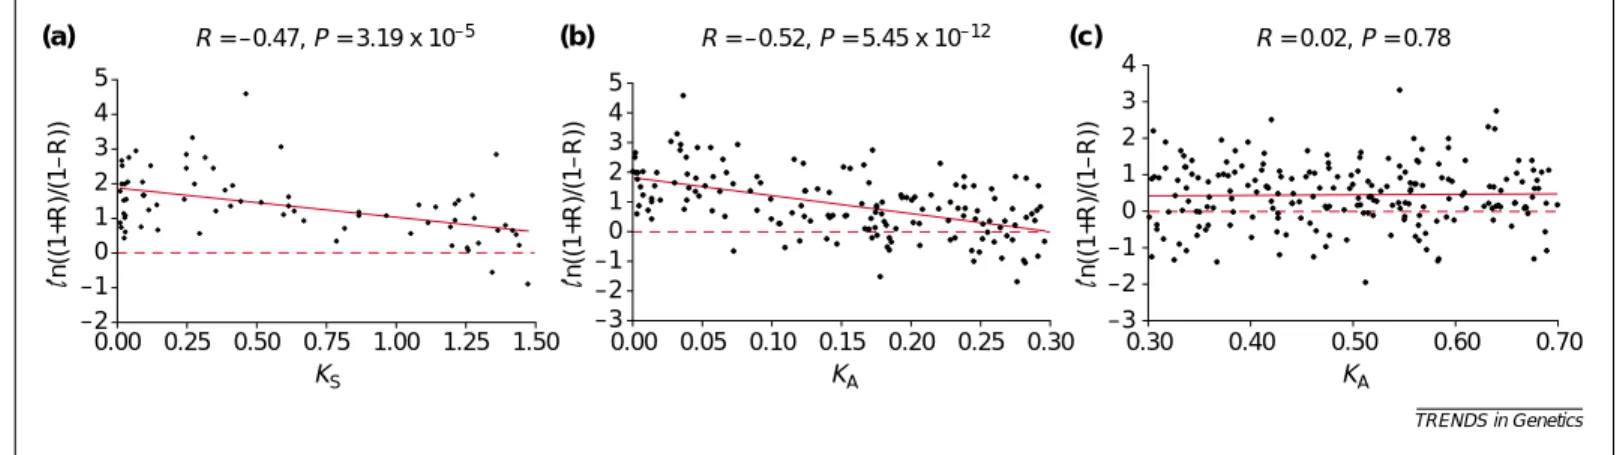
Figure 1a shows a significant negative correlation (−0.47, P<2 ×10⁻⁵) between ln[(1+R)/(1−R)] and KS. We used the transformation ln[(1+R)/(1−R)] instead of R to change the scale to a more appropriate one for a linear regression analysis (Box 2); actually, a similar correlation (−0.54) is obtained between R and KS. A stronger correlation than this is not expected because KSis only a crude
Rapid divergence in expression between duplicate genes
inferred from microarray data
Zhenglong Gu, Dan Nicolae, Henry H-S. Lu and Wen-Hsiung Li
A total of 208 cDNA microarray experiment data points were compiled for this study. The dataset represents the gene expression under various developmental and physiological conditions in the yeast life history (Table I).
For some processes, more than one yeast strain or one time course were studied and we randomly selected only one of them for each process. Log2-transformed ratios of gene expression in experimental populations to reference populations were used in the analysis.
References
a Chu, S. et al. (1998) The transcriptional program of sporulation in budding yeast.
Science 282, 699–705
b Spellman, P.T. et al. (1998) Comprehensive identification of cell cycle-regulated genes of the yeast Saccharomyces cerevisiae by microarray hybridization. Mol. Biol. Cell 9, 3273–3297
c Lyons, T.J. et al. (2000) Genome-wide characterization of the Zap1p zinc-responsive regulon in yeast. Proc. Natl. Acad. Sci. U. S. A. 97, 7957–7962
d Gasch, A.P. et al. (2000) Genomic expression programs in the response of yeast cells to environmental changes. Mol. Biol. Cell 11, 4241–4257
e DeRisi, J.L. et al. (1997) Exploring the metabolic and genetic control of gene expression on a genomic scale. Science 278, 680–686
Box 1. Yeast microarray data
Table I. Studied processes and number of data points in each process
Process Data points Ref. Sporulation 9 [a] Cell cycle 17 [b] Zinc regulation 9 [c] YPD growth 10 [d] Diamide treatment 8 [d] Nitrogen deletion 10 [d] DTT treatment 8 [d] H2O2 treatment 10 [d] Menadione treatment 9 [d]
Diauxic shift 7 [e]
Heat shock 7 [d]
Hyper-osmotic shock 7 [d]
Different carbon resources 6 [d] Amino acid starvation 5 [d] Other experiments in response 86 [d] to environmental changes
proxy of divergence time owing to the considerable variation in synonymous rate among genes [7,8]. As in [6], only a weak correlation (−0.30, P=4.57×10⁻⁹) is found between ln[(1+R)/(1−R)] and KA (KA≤0.70); the correlation is significant because the dataset used is much larger than that in [6]. The weak correlation is not surprising because KAis not a good proxy of divergence time, so that no correlation between R and KAis expected when KAbecomes large. Indeed, Fig. 1c shows no correlation (0.02, P=0.77) between ln[(1+R)/(1−R)] and KAfor KA>0.30. However, a significant negative
correlation (−0.52) between the two quantities is seen for KA≤0.30 (Fig. 1b). The range of KA≤0.30 is somewhat arbitrary, but the correlation coefficient varies only from −0.49 for KA≤0.25 to –0.48 for KA≤0.35. Thus, expression divergence and KAare initially coupled to some extent. The same conclusions hold for Affymetrix microarray data, for which cross hybridization between duplicate genes is a less serious problem (see Supplementary Figure at http://download.bmn.com/supp/tig/ decemberAffymetrix.pdf); the dataset is smaller than cDNA microarray data,
so it was not used in the other analyses in this study.
In the above analysis, all experiments were considered together; that is, R was calculated over all data points. This pooling of data might obscure the relationship between expression divergence and sequence divergence because a pair of duplicate genes are not necessarily involved in all of the
physiological processes tested. Note that if a gene pair is not involved in a process, it is unlikely to evolve expression
divergence in that process. For this reason we now consider R separately for each of
http://tig.trends.com
Open reading frames in the yeast genome (SGD, http://genome-www.stanford.edu/Saccharomyces/) were grouped into different gene families using a rigorous method [a]. Protein sequences of duplicate genes were aligned using ClustalW [b] and the corresponding coding regions were then aligned based on the protein alignment. The numbers of substitutions per synonymous site (KS) and per nonsynonymous (KA) site between duplicate genes were estimated using PAML [c] with default parameters. We selected only gene pairs with KS≤1.5 because when KSbecomes larger it is difficult to obtain a reliable estimate, owing to repeated substitutions at the same site. Similarly, we restricted KAto≤0.70. The computer program CodonW (ftp://molbiol.ox.ac.uk/ cu/codonW.tar.Z) was used to calculate the effective number of codons (ENC) for each gene studied.
Duplicate gene pairs were selected as follows: within each gene family, starting from the pair with the smallest KSof greater than 0.01, we selected independent gene pairs; that is, pairs that share no genes in common with other pairs. To avoid gene pairs with strong codon usage bias, both genes in a selected pair must have an ENC >35. Our study [a] suggests that KSis substantially reduced by codon usage bias when ENC<32, but is only mildly affected when ENC >35. In total, 400 duplicate gene pairs were selected.
Because all of the duplicate gene pairs encoding ribosomal proteins have strong codon usage bias, we consider the divergence in the flanking sequences instead of KS. For each gene pair, the 200 bp of both upstream and downstream flanking regions of both genes were extracted from gene annotation data. ClustalW was used to do the alignment, followed by minor manual adjustments. Genetic distances were calculated using Tamura and Nei’s six-parameter method [d]. The average of the genetic distances in upstream and downstream flanking regions is denoted as Dflank
(Supplementary Table 2 at http://download.bmn.com/supp/tig/ decemberTable2.pdf).
The Pearson correlation coefficient (R) of gene expression over all data points in Table I in Box 1 was calculated for each selected gene pair if the expression data were available for more than half of the
experiments studied for that pair (396 pairs were calculated, Supplementary Table 3 at http://download.bmn.com/supp/tig/
decemberTable3.pdf). Linear regression analysis was used to investigate the relationship between R and KS(KA). Because R is bounded by –1 and 1, the transformation ln((1+R)/(1−R)) was used and the normal linear regression was then carried out between each pair of KS(KA) and the transformed R. The statistical package of S+ was used.
Each of the first 9 processes listed in Table I of Box 1, each of which has eight or more data points, was also treated separately; for each process the Pearson correlation coefficient was calculated for each selected gene pair (Supplementary Table 3 at
http://download.bmn.com/supp/tig/decemberTable3.pdf).
References
a Gu, Z. et al. (2002) Extent of gene duplication in the genomes of Drosophila, nematode, and yeast. Mol. Biol. Evol. 19, 256–262
b Thompson, J.D. et al. (1994) CLUSTAL W: improving the sensitivity of progressive multiple sequence alignment through sequence weighting, position-specific gap penalties and weight matrix choice. Nucleic Acids Res. 22, 4673–4680
c Yang, Z. and Nielsen, R. (2000) Estimating synonymous and nonsynonymous substitution rates under realistic evolutionary models. Mol. Biol. Evol. 17, 32–43 d Tamura, K. and Nei, M. (1993) Estimation of the number of nucleotide
substitutions in the control region of mitochondrial DNA in humans and chimpanzees. Mol. Biol. Evol. 10, 512–526
Box 2. Duplicate gene selection and linear regression analysis
TRENDS in Genetics –2 –1 0 1 2 3 4 5 0.00 0.25 0.50 0.75 1.00 1.25 1.50 KS KA KA R = –0.47, P = 3.19 x 10⁻⁵ R = –0.52, P = 5.45 x 10⁻¹² (a) –3 –2 –1 0 1 2 3 4 5 0.00 0.05 0.10 0.15 0.20 0.25 0.30 –3 –2 –1 0 1 2 3 4 0.30 0.40 0.50 0.60 0.70 R = 0.02, P = 0.78 n((1+R)/(1 – R)) (b) (c) n((1+R)/(1 – R)) n((1+R)/(1 – R))
Fig. 1. Relationship between the correlation coefficient (R) of gene expression over all available data points and KS(KA) between duplicate genes. (a) A significant negative correlation between ln[(1+R)/(1−R)] and KSfor gene pairs with KS<1.5. (b) A significant negative correlation between ln[(1+R)/(1−R)] and KAfor gene pairs with KA≤0.3. (c) No correlation between ln[(1+R)/(1−R)] and KAfor gene pairs with KA>0.3.
the first nine tests in Box 1, each of which has eight or more time points.
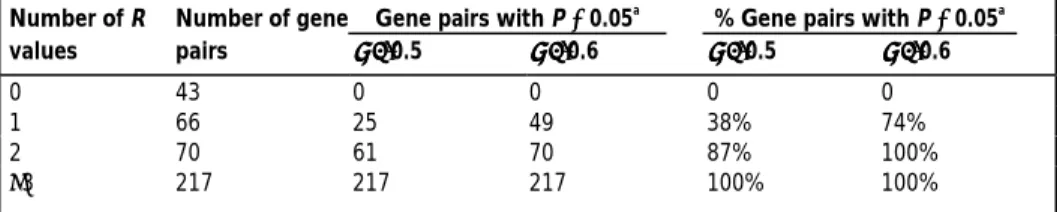
To define ‘expression divergence’, we note that the correlation coefficient between two duplicate genes is initially 1, so we consider a value of 0.5 as sufficiently low. Note that for R=0.5, R2is only 0.25, so that knowing the pattern of expression of one gene provides little information for predicting the expression pattern of the other gene. More importantly, we actually define ‘expression divergence’ by requiring that the probability of observing the two smallest R values among the nine processes is <0.05, given that the
population (true) correlation coefficient (ρ) is 0.5; see Box 3 for the test method. This definition is likely to underestimate the true degree of divergence because it uses
only the information of two smallest R values in the observed R values and because it assumes that the gene pair is involved in all of the nine processes studied. Indeed, this definition is stringent because, in effect, it requires at least one or two negative R values among the nine processes (Table 1). For example, only 38% of the cases with one negative R show ‘expression divergence’. Moreover, none of the 54 pairs of duplicated
ribosomal protein genes in the yeast genome is ‘divergent’ under this criterion (data not shown).
Table 2 shows that over 40% of the non-ribosomal protein gene pairs studied show divergent expression even when KS≤0.10 and the proportion becomes >80% when KSbecomes larger than 1.5.
The proportion of pairs with diverged expression increases even more rapidly with KA(Table 2). Clearly, expression divergence has occurred quickly in many of the gene pairs studied.
If we relax the definition of ‘divergent expression’ by setting ρ =0.6 instead of 0.5, the proportion of pairs with divergent expression increases with KSat an even faster rate (Table 2). Indeed, more than 50% of the pairs studied show divergent expression even when KSis ~0.10. The synonymous rate is not known in yeast but is probably higher than that in Drosophila, which has been commonly taken as 15.6 × 10⁻⁹nucleotide substitutions per site per year [7]. Thus, KS= 0.1 would correspond to less than 3.2 million years of divergence time, implying a rapid rate of For each process under study, denote the n pairs of observations on the
expression levels of the two duplicate genes compared by Z = {zi:i = 1, …, n, and zI= (xi,yi)t}. From the sample, the correlation coefficient (R)
between x and y is calculated. We will assume that these n pairs of observations are independently, identically distributed as a bivariate normal distribution with a correlation coefficient (ρ) in the population. This assumption of normality has been checked by the Kolmogorov–Smirnov test on the Q–Q plot for
tanh–1(R ) = {ln[(1+R)/(1-R)]}/2 in every process (Supplementary Table 4
at http://download.bmn.com/supp/tig/decemberTable4.pdf).
With a large sample size n, the distribution of R can be approximated as follows. We transform R and ρto tanh–1(R) = {ln[(1+R)/(1-R)]}/2 and
tanh–1(ρ) = {ln[(1+ρ)/(1-ρ)]}/2. Then, the difference tanh–1(R) −tanh–1(ρ) is
approximately a normal variate with the following mean and variance (Ref. [a] p. 433):
mean = ,
variance =
Using this normal approximation, we can evaluate various probabilities. For example, for –1 ≤ c ≤ 1, we can compute
P (cρ,n} = P {R≤ cρ,n} = P {tanh–1(R ) ≤ tanh–1(c)ρ,n}
=P {[tanh–1(R) – tanh–1(ρ) – u] / σ ≤ [tanh–1(c) – tanh–1(ρ) – u] / σρ,n}
≈P {Z≤ [tanh–1(c) – tanh–1(ρ) – u] / σ}
where Z has a standard normal distribution, which can be easily evaluated.
For a small n, the parametric bootstrap can be used to find out the distribution of R [b]. The mean and variance in the population are estimated by the mean and variance in the sample, which are denoted as
and .
Given the population correlation coefficient ρ, a bootstrap sample, Z * = {z*i:i = 1, …, n}, is obtained by simulating a bivariate normal
distribution with and .
The correlation coefficient from the bootstrap sample Z * is computed and denoted as R*. Repeating the resampling procedure B times, we observe R*1, …, R*B. The empirical distribution of R*1, …, R*Bis used to
approximate the distribution of R. In particular,
P (cρ,n) = P (R≤ cρ,n) ,
where I{·} is a indicator function whose value is 1 when the event is true and 0 otherwise. Because the data contain small sample sizes, we will use this parametric bootstrap to estimate probabilities.
Now suppose that m processes are studied and there are njpairs of
observations for each process, j = 1, …, m. From the above
approximation, we can evaluate the probability of Pj(c) = P (cρ,nj}. Then, we can find out the probability that there are κR values observed among the m processes that are ≤c:
P {no R≤ cρ,m} = , P {only one R≤ cρ,m} =
, P {at least two R values ≤ cρ,m} = 1 – P {no R≤ cρ,m} –
P {only one R≤cρ,m} = Eqn [1]
and so forth.
Once we observe the sample correlation coefficients (R values) of one gene pair in the m processes, we can use this parametric bootstrap to evaluate the probability of observing the smallest R values given the population correlation coefficient (ρ). For example, let the smallest two R values be c1and c2with c1≥c2Then, we can replace c by c1in Eqn [1]. Of course, by using the complete information of c1and c2, we can obtain
a more precise probability:
P {at least one R≤ c1and one R ≤ c2ρ,m}
=1 –P {no R≤ c2ρ,m} – P {only one R≤ c2and all other R values >c1ρ,m} Eqn [2]
Note that Eqn [2] is always smaller than or equal to Eqn [1] with c = c1. All the probability computations in this paper were obtained using Eqn [2].
References
a Rao, C.R. (1973). Linear Statistical Inference and Its Application (2nd Edn), Wiley
b Efron, B. and Tibshirani, R.J. (1998). An introduction to the Bootstrap, Chapman & Hall/CRC
∏
∏
∑
= = = − − − − − = m k k m j m j j j j P c c P c P c P 1 1 1 1 1 2 2 [1 ( )] ) ( 1 ) ( )] ( 1 [ 1∏
∏
∑
= = = − − − − − m k k m j m j j j j P c c P c P c P 1 1 1 )] ( 1 [ ) ( 1 ) ( )] ( 1 [ 1∏
∑
∑
∏
= = = ≠ = − = − − m k k m j j j m j m j k k k j P c c P c P c P c P 1 1 1 1 )] ( 1 [ ) ( 1 ) ( )] ( 1 [ ) ( )] ( 1 [ 1 c P m j j∏
= − B / } { I * 1 c Ri B i ≤ ≈∑
= 2 2 y y x y x x S S S S S S ρ ρ y x 2 2 y y x y x x S S RS S RS S y x 3 1 1) ( 2 4 1 1 2 2 2 − ≈ − − + − = n n n ρ σ ) 1 ( 2 − = n ρ µexpression divergence between duplicate genes in yeast. A similar picture is seen for KA(Table 2).
There are two factors that tend to underestimate the rate of expression divergence. First, the nine processes studied do not represent all the physiological processes in yeast, and a duplicate gene pair could have diverged in one or more of the processes that have not been studied, although it has not diverged in any of the nine processes tested. This factor is likely to have significantly reduced our estimate of the rate of expression divergence. Second, there is the possibility of cross-hybridization of cDNA probes when two duplicate genes are highly similar in their cDNA sequences. In view of the fact that many of the highly similar duplicate pairs (KS<0.10) have shown one or more small R values (data not shown), the extent of cross-hybridization was probably not serious. However, if it were not negligible, the initial rate of expression divergence would have been underestimated.
Alternatively, the noisiness of microarray data tends to reduce the true
correlation (R) between the expression levels of duplicate genes and thus tends to overestimate the rate of expression divergence, especially in the early stage of divergence between duplicate genes. Thus, although our definition of
expression divergence seems stringent for the case of ρ = 0.5, the conclusion should be taken with caution.
It is worth noting that a divergent duplicate pair that has a large KSor KA might already have gained expression divergence when its KSor KAwas still small. Thus, a divergent pair with a large KSor KAdoes not imply a slow rate of expression divergence. It is also interesting to note from Table 2 that the proportion of divergent duplicate gene pairs eventually becomes more than 80% as KSincreases. As noted, we have considered only nine processes. If many more processes are considered, the vast majority of duplicate genes will probably eventually become diverged in expression.
There are, however, duplicate genes that do not show divergent expression even when KSis large; for example, genes encoding proteasome components, aminopeptidases, aldo/keto reductases and ribosomal proteins. Ribosomal protein genes have not been included in Fig. 1 and Table 1, and have been treated separately in Table 2, because they have strong codon usage bias and their KSdoes not reflect the divergence time well. We therefore consider instead the sequence divergence (Dflank) in their flanking regions (Box 2). Note that none of the ribosomal protein gene pairs shows expression divergence under the condition of ρ =0.5 (Table 2). Even under the condition of ρ =0.6, their rate of expression divergence is very slow, compared with that for genes encoding non-ribosomal proteins.
We have examined the functions of quickly diverged gene pairs, that is, those pairs that have a KS<0.3 but show expression divergence (Supplementary
Table 1 at http://download.bmn.com/ supp/tig/decemberTable1.pdf). The functions of many of these genes are still unknown or have not been well studied. However, we can see that these genes include many membrane proteins such as substrate transporters, and many enzymes such as aldehyde hydrogenase, aldo/keto reductase, helicase and phosphopyruvate hydratase.
In conclusion, because protein distance (or KA) is not a good measure of divergence time, it was not surprising that no coupling of expression divergence and protein distance was found previously. However, an initial coupling of expression divergence and KAdoes exist (Fig. 1b). KSis a better measure of divergence time than KA, and the significant correlation of expression divergence with KSsuggests that expression divergence increases with divergence time. Most interestingly, many duplicate genes in yeast have diverged quickly in expression and the vast
majority of duplicate genes will eventually become diverged in expression. However, the rate of expression divergence varies among duplicate genes. The majority of duplicate genes such as many membrane proteins and many enzymes have diverged quickly in expression, whereas ribosomal proteins, proteasome
components and some other proteins show a slow rate of expression divergence. Other duplicate genes show a moderate rate of expression divergence. Clearly, a proper analysis of microarray data can shed much light on the rate and mode of expression divergence of duplicate genes. Acknowledgements
We thank Z. Zhu, T. Oakley, M. Long, C-C. Shih, H. Kaessmann, K. Makova, and L. Mets for help and comments. This study was supported by NIH grants.
References
1 Markert, C.L. (1964) Cellular differentiation – an expression of differential gene function. In Congenital Malformations, pp163–174, International Medical Congress
2 Ohno, S. (1970) Evolution by Gene Duplication, Springer-Verlag
3 Ferris, S.D. and Whitt, G.S. (1979) Evolution of the differential regulation of duplicate genes after polyploidization. J. Mol. Evol. 12, 267–317 4 Force, A. et al. (1999) Preservation of duplicate
genes by complementary, degenerative mutations. Genetics 151, 1531–1545 5 Ferea, T.L. et al. (1999) Systematic changes in
gene expression patterns following adaptive evolution in yeast. Proc. Natl. Acad. Sci. U. S. A. 96, 9721–9726
http://tig.trends.com
Table 1. Numbers and proportions of gene pairs with expression divergence
(i.e. P < 0.05) for different numbers of negative R values in the nine processes studied. Number of R Number of gene Gene pairs with P <<<< 0.05a
% Gene pairs with P <<<< 0.05a
values pairs ρρρρ= = = = 0.5 ρρρρ= = = = 0.6 ρρρρ= = = = 0.5 ρρρρ= = = = 0.6 0 43 0 0 0 0 1 66 25 49 38% 74% 2 70 61 70 87% 100% ≥3 217 217 217 100% 100% a
The ρ value is the criterion for ‘expression divergence’.
Table 2. Proportion of gene pairs with expression divergencea in different KS and KA intervals. ρρρρ KS Intervals 0.01–0.1 0.1–0.3 0.3–1.0 1.0–1.5 >1.5 0.5 0.43 0.55 0.50 0.77 0.81 0.6 0.52 0.55 0.70 0.86 0.89 KA Intervals 0–0.05 0.05–0.1 0.1–0.25 0.25–0.5 >0.5 0.5 0.45 0.53 0.81 0.85 0.76 0.6 0.55 0.71 0.89 0.92 0.85
Dflank Intervals (Ribosomal protein genes) 0–0.1 0.1–0.6 0.6–1.0 1.0–1.5 >1.5 0.5 NAb NA 0 0 NA 0.6 NA NA 0.02 0.25 NA a
The criterion for expression divergence is that the probability of observing the two smallest R values in the nine tests studied is less than 0.05, given the population correlation coefficient is ρ.
b
Techniques & Applications
The detection of single nucleotide polymorphisms by PCR is necessary for many types of genetic analysis, from mapping genomes to tracking specific mutations. This technique is most commonly used when polymorphisms alter restriction endonuclease recognition sites. Here we describe a web-based program, dCAPS Finder 2.0, that facilitates the design of mismatched PCR primers to create or remove a restriction endonuclease recognition site relative to the polymorphism being analyzed.
Published online: 01 November 2002 Molecular genetic research relies heavily on the ability to detect polymorphisms in DNA. These molecular markers range from large deletions and rearrangements to single nucleotide polymorphisms (SNPs) [1]. Before the advent of polymerase chain reaction (PCR) technology [2], restriction fragment length polymorphism (RFLP) analysis required Southern blots of restricted genomic DNA [3]. PCR technology has led to a more rapid, less expensive version of RFLP analysis using cleaved amplified polymorphic sequence (CAPS) markers [4]. However, both RFLP and CAPS analysis require that the SNP creates or removes a restriction endonuclease recognition site. Because this is not always the case, a variety of techniques have been developed to genotype SNPs in an enzyme-independent manner [1]. Many of these techniques require specialized detection equipment and/or labeled PCR primers that cost more than standard
primers. Derived cleaved amplified polymorphic sequence (dCAPS) analysis, widely used in the plant molecular genetics community, uses mismatches in one of the two PCR primers flanking the SNP to create or remove a restriction endonuclease recognition site in one of the two haplotypes being assayed [5,6] (Fig. 1). In this paper, we present a web-based program, dCAPS Finder 2.0, that facilitates the design of these dCAPS primers.
dCAPS Finder 2.0
The dCAPS marker technique was originally developed as a method for
changing a SNP into an RFLP (see [5,6] and references within) (Fig. 1). The technique can also be used to modify an existing RFLP such that a less expensive restriction endonuclease can be used for SNP analysis. Because dCAPS primers use the same chemistry as regular PCR primers, there is also a cost advantage of this technique over more sophisticated, enzyme-independent methods of SNP analysis. The biggest difficulty for designing dCAPS primers lies in identifying restriction endonuclease recognition sites and accompanying primer mismatches. To facilitate this technique, a Macintosh-based computer
Web-based primer design for single nucleotide
polymorphism analysis
Michael M. Neff, Edward Turk and Michael Kalishman
6 Wagner, A. (2000) Decoupled evolution of coding region and mRNA expression patterns after gene duplication: implications for the
neutralist-selectionist debate. Proc. Natl. Acad.
Sci. U. S. A. 97, 6579–6584
7 Li, W-H. (1997) Molecular Evolution, Sinauer Associates
8 Makalowski, W. and Boguski, M.S. (1998) Evolutionary parameters of the transcribed mammalian genome: an analysis of 2,820
orthologous rodent and human sequences.
Proc. Natl. Acad. Sci. U. S. A. 95, 9407–9412
Zhenglong Gu Wen-Hsiung Li*
Dept of Ecology and Evolution, University of Chicago, 1101 East 57th Street, Chicago, IL 60637, USA.
*e-mail: [email protected]
Dan Nicolae
Dept of Statistics, University of Chicago, 5734 S. University Ave, Chicago, IL 60637, USA. Henry H-S. Lu
Insitute of Statistics, National Chiao Tung University, 1001 Ta Hsueh Rd, Hsingchu, 30050 Taiwan.
TRENDS in Genetics
(a)
CRY1: 5′CGTGAATCTTTTCCTGAAATCTATTGGTCTCAGGGAGTATT3′ 3′GCACTTAGAAAAGGACTTTAGATAACCAGAGTCCCTCATAA5′
cry1-102: 5′CGTGAATCTTTTCCTGAAATTTATTGGTCTCAGGGAGTATT3′ 3′GCACTTAGAAAAGGACTTTAAATAACCAGAGTCCCTCATAA5′
EcoRI recognition site: 5′GAA T TC3′ 3′CTT A AG5′ (b)
Mis-matched primer: 5′CGTGAATCTTTTCCTGAA T T3′ CRY1 PCR product digested with EcoRI:
5′CGTGAATCTTTTCCTG AA T TCTATTGGTCTCAGGGAGTATT3′ 3′GCACTTAGAAAAGGACTT A A GATAACCAGAGTCCCTCATAA5′
cry1-102 PCR product digested with EcoRI:
5′CGTGAATCTTTTCCTGAA T TTTATTGGTCTCAGGGAGTATT3′ 3′GCACTTAGAAAAGGACTT A AAATAACCAGAGTCCCTCATAA5′
Fig. 1. Derived cleaved amplified polymorphic sequence (dCAPS) analysis uses a mismatched PCR primer to create a restriction fragment length polymorphism (RFLP) based on the single nucleotide polymorphism (SNP) being analyzed. (a) The cry1-102 SNP (bold, italic letters) does not create an EcoRI-based RFLP because of one mismatch in the EcoRI recognition site (bold, underlined letters). (b) A primer containing this mismatch (bold, underlined letter) allows the amplification of PCR products that generate an EcoRI -based RFLP that is dependent on the cry1-102 SNP. Red boxes show sequences that are not cleaved by EcoRI. Green boxes represent sequences that are cleaved by EcoRI.
![Figure 1a shows a significant negative correlation (−0.47, P < 2 ×10 − 5 ) between ln[(1+R)/(1−R)] and K S](https://thumb-ap.123doks.com/thumbv2/9libinfo/7789123.151400/1.918.342.844.810.1110/figure-shows-significant-negative-correlation-p-lt-ln.webp)