海峽兩岸銀行業績效之比較研究 - 政大學術集成
111
0
0
全文
(2) 海峽兩岸銀行業績效之比較研究 The Comparison of Banking Performance between China and Taiwan. 研究生:李采儒. Student: Lee, Tsai-Ju. 指導教授:黃仁德. Advisor: Hwang, Jen-Te. 立. 政 治 大 國立政治大學. ‧ 國. 學. 亞太研究英語碩士學位學程. ‧. 碩士論文. n. er. io. sit. y. Nat. al. Ch. A Thesis. engchi. i n U. v. Submitted to International Master’s Program in Asia-Pacific Studies National Chengchi University In partial fulfillment of the Requirement For the degree of Master in China Studies. 中華民國九十九年七月 July 2010.
(3) Acknowledgement I am heartily grateful to my supervisor, Dr. Hwang, Jen-Te (黃仁德), whose guidance, advice and support from the initial to the final level enabled me to complete the thesis. Dr. Hwang is a kind and devoted professor, I have learned a lot from him during his lectures and our discussion on the thesis. I would also like to express my gratitude to the professors of oral exam committee, Dr. Hwang, Yu-Ning (黃俞寧) and Dr. Wang, Yao-Shing ( 王 耀 興 ), for their constructive and inspirational suggestions on the thesis.. 治 政 As a part-time student, it is quite difficult to manage 大 well both working and 立 studying, but my parents always encourage me to grab every opportunity to pursue ‧ 國. 學. higher degree of education, their strong belief in me gave me strength to finish the. ‧. master’s program, hence it is my honor to dedicate this thesis to them. Last but not least, I offer my sincere regards to all the professors from National. y. Nat. io. sit. Chengchi University for increasing my knowledge and opening up my eyes in the. n. al. er. field of China Studies and to all the people who supported me in any respect during the writing of the thesis.. Ch. engchi. I. i n U. v.
(4) Abstract After thirty years of economic and financial reforms, banking system in China has transformed from rigidly controlled to marketization nowadays with a variety of banking institutions coexist in the financial market. Among different kinds of banking institutions, large state-owned commercial banks dominate over half of total banking assets, their huge scale allow themselves to have leading positions and monopoly power in China’s banking industry. Under WTO regulations China must fully open markets for foreign banks’. 政 治 大 commercial banks have restructured into joint-stock companies and went public 立 investment started on December 11, 2006, before that most large state-owned. ‧ 國. 學. sequentially in order to enhance competition for fierce challenges brought from foreign banks. Attributing to China government’s effort and support, the overall. ‧. domestic banking performance has made a lot of progress in the past few years.. sit. y. Nat. By comparing banking performance with USA and Taiwan in four aspects of. n. al. er. io. profitability, assets quality, liquidity risk management and capital adequacy ability, the. i n U. v. study results demonstrate that general performance of banking sector and large. Ch. engchi. state-owned commercial banks in China have improved greatly and even better than advanced countries in some respects. The signing of ECFA between cross-strait governments on June 29, 2010 starts a new page of Taiwan banks’ development in China, the study suggests that in the initial stage banks from Taiwan can explore markets of corporate banking by using their expertise in loans for small and medium enterprises which are always neglected by banks in China, and by providing services to Taiwan business people in China to explore markets of consumer banking, and then gradually expand market share.. II.
(5) Contents CHAPTER 1 Introduction………………………………......................1 1.1. Motivation………………………………….………………………………..3. 1.2 Purposes …………………………………….………………………………4 1.3 Research Method and Limitation…………….……………………………...6. CHAPTER 2 Banking Performance in China......................................9 2.1 Development Process of China’s Banking System.........................................9. 政 治 大 Analysis of Profitability Performance……………………………...............27 立. 2.2 Overview of Banking Industry in China…………………………………...19 2.3. 2.4 Evaluation of Assets Quality……………………………………………….34. ‧ 國. 學. 2.5 Management of Liquidity Risk……………………………...……………..40. Summary…………………………………………………………………...50. sit. y. Nat. 2.7. ‧. 2.6 Compliance with Basel II…...………………………….………….……….44. n. er. io. CHAPTER 3 Comparison of Banking Performance between a l USA…………………...……………….....…53 China and v i n C h in USA…………….………………………53 3.1 Overview of Banking Industry engchi U 3.2 Analysis of Profitability Performance………………………………….…..57 3.3 Evaluation of Assets Quality…………………………………………….…60 3.4 Management of Liquidity Risk…………………………………...….…….62 3.5 Compliance with Basel II…...………………………….………….……….64 3.6. Summary…………………………………………………………………...67. CHAPTER 4 Comparison of Banking Performance between China and Taiwan……………………………………...69 4.1 Overview of Banking Industry in Taiwan………………………………….70 III.
(6) 4.2 Analysis of Profitability Performance……………………………...............76 4.3 Evaluation of Assets Quality……………………………………………….80 4.4 Management of Liquidity Risk………………………………………….....82 4.5 Compliance with Basel II…...………………………….………….……….84 4.6 Development Opportunities for Taiwan Banks in China…………………..86 4.7. Summary…………………………………………………………………...92. CHAPTER 5 Conclusions and Suggestions………..………..…........95 5.1. Conclusions…………………………………………….…………………..95. 5.2. Suggestions………………………………………………………………...98. 政 治 大. 立 Reference…………………………………………………….…….100 ‧. ‧ 國. 學. n. er. io. sit. y. Nat. al. Ch. engchi. IV. i n U. v.
(7) Table List Table 2-1: China’s WTO Commitments—Schedule of Market Access for Foreign Banks to do RMB Business……………….…...………….………………….……14 Table 2-2: Foreign Banks in China—2004~2009……………………………………...15 Table 2-3: Total Assets and Liabilities of Banking Institutions in China—2004~2009 …….…….………………………………………………………….............15 Table 2-4: The Evolution of China’s Baking System…………………………………..17 Table 2-5: Legal Entities and Staff of Commercial Banks in China—2009…...………21 Table 2-6: Assets and Market Share of Banking Institutions in China—2008~2009….22 Table 2-7: Establishment and Listing of State-owned Commercial Banks………….....24. 政 治 大. Table 2-8: Ranking of State-owned Commercial Banks in China—2009…….……...25 Table 2-9: Benchmark Interest Rate of RMB Loans………………………….……......28. 立. Table 2-10: Profit After Tax of Commercial Banks in China-2007~2009...…………29. ‧ 國. 學. Table 2-11: Net Profit of SOCBs in China—2008~2009………………………………32 Table 2-12: Indicators of Profitability of SOCBs in China—2007~2009………….......33. ‧. Table 2-13: NPL of Commercial Banks in China—2006~2009……………...…….….36. sit. y. Nat. Table 2-14: NPL Ratio of SOCBs in China—2006~2009…………………………......38. io. er. Table 2-15: Coverage Ratio of SOCBs in China—2006~2009…………………..…....39. al. Table 2-16: Regulatory Indicators of SOCBs in China—2007~2009………..………..42. n. v i n C hof SOCBs in China-2007~2009…………..…….43 Table 2-17: Indicators of Liquidity engchi U Table 2-18: Timetable of Basel II Implementation for Banking Industry in China…....47 Table 2-19: Number of Commercial Banks Meet CAR Requirements in China— 2003~2009……………………………………………………………........48 Table 2-20: Capital Adequacy Ratio of SOCBs in China-2007~2009………...…..…49 Table 2-21: Tier 1 Ratio of SOCBs in China-2007~2009…………………..………..49 Table 3-1: Total Assets of Banking Institutions in USA—2006~2009…………...…55 Table 3-2: Top Five Banks in USA—2009……………………………..……………..56 Table 3-3: Net Profit of Top Five Banks in USA—2008~2009…………...……...58 V.
(8) Table 3-4: Indicators of Profitability of Top Five Banks in USA-2007~2009…….59 Table 3-5: NPL Ratio of Top Five Banks in USA—2007~2009………………….....61 Table 3-6: Coverage Ratio of Top Five Banks in USA—2007~2009………...……..62 Table 3-7: Indicators of Liquidity of Top Five Banks in USA—2007~2009…….…63 Table 3-8: Capital Adequacy Ratio of Top Five Banks in USA-2007~2009…..……65 Table 3-9: Tier 1 Ratio of Top Five Banks in USA-2007~2009……..…………….66 Table 3-10: The Comparison of Banking Industry between China and USA……..…...66 Table 4-1: Banking Institutions in Taiwan—2009………………..…………………...71. 政 治 大 Table 4-3: Loans and Deposits of Banking Institutions in Taiwan—2009……...……..72 立 Table 4-2: Assets and Equities of Banking Institutions in Taiwan—2009……...……..72. Table 4-4: Top Ten Largest Banks in Taiwan……………………………...……….….74. ‧ 國. 學. Table 4-5: Top Five Banks in Taiwan—2009..…………………………...…………..75. ‧. Table 4-6: Net Profit of Top Five Banks in Taiwan-2008~2009………………...…...77. sit. y. Nat. Table 4-7: Indicators of Profitability of Top Five Banks in Taiwan—2007~2009…….78. io. er. Table 4-8: NPL Ratio of Top Five Banks in Taiwan—2007~2009…………………….80 Table 4-9: Coverage Ratio of Top Five Banks in Taiwan—2007~2009……...………..82. al. n. v i n C hof Top Five BanksUin Taiwan—2007~2009…...….83 Table 4-10: Indicators of Liquidity engchi Table 4-11: Capital Adequacy Ratio of Top Five Banks in Taiwan—2007~2009..…....85 Table 4-12: Tier 1 Ratio of Top Five Banks in Taiwan—2007~2009………..………...85 Table 4-13: The Comparison of Banking Industry between China and Taiwan…….....86 Table 4-14: Requirements for Foreign Banks’ Entrance in China before ECFA....……87 Table 4-15: Representative Offices of Taiwan Banks In China—2010……..………...89 Table 4-16: Loan Balance of SMEs of Taiwan Domestic Banks—2004~2009…...…..91. VI.
(9) Figure List Figure 2-1: Economic Growth Rate of China—1979 ~ 2009…………..………...……10 Figure 2-2: The Structure of Banking System in China—2009………………...……...20 Figure 2-3: Market Share of Total Banking Assets in China—2009……..……………23 Figure 2-4: Loans of SOCBs in China—2008~2009……………………..……………25 Figure 2-5: Deposits of SOCBs in China—2008~2009…………………..……………26 Figure 2-6: Profit Distribution of Banking Institutions in China—2009…...………….30 Figure 2-7: Composition of Operating Income of SOCBs in China—2009……...……31. 政 治 大 Figure 3-1: Composition of立 Operating Income of Top Five Banks in USA—2009...…57 Figure 2-8: NPL Ratio of Commercial Banks in China—2006~2009...…...…..………37. ‧ 國. 學. Figure 4-1: Composition of Operating Income of Top Five Banks in Taiwan—2009…76 Figure 4-2: ROA of Asian Banking Industry—2009…………………...……………...79. ‧. Figure 4-3: NPL Ratio of Asian Banking Industry—2009………….....…………..…..81. n. al. er. io. sit. y. Nat. Figure 4-4: Credit Forms of Corporate Loans in China—2008…………...……...……90. Ch. engchi. VII. i n U. v.
(10) C. HAPTER 1. Introduction. During the third plenum of the eleventh central committee held in Beijing in December of 1978, an important decision was made to turn the focus of the People’s Republic of China (PROC) from closing to opening up and then initiated a new stage of China’s economy. Since Deng Xiao-ping implemented economic reform policies in. 政 治 大 digits economic growth. 1979, planned economy was gradually replaced by market economy, and China has. 立. maintained years of double. rate. Amazing economic. performance and rising international status in recent years has made China become. ‧ 國. 學. more and more important to the world.. ‧. When a country is aiming to develop trade and economy, it is inevitable to. sit. y. Nat. increase interaction with global society and stay in line with international norms and. io. er. regulations. After more than fifteen years of negotiation, China finally becomes a member of World Trade Organization (WTO) since December 11, 2001. 1 Under. al. n. v i n C h China must stepUby step open domestic markets China’s WTO accession agreement, engchi for foreign financial institutions to provide banking and other financial services according to the schedule of specific commitments. Upon China’s accession to WTO, geographic restrictions or client limitations for foreign financial institutions to do foreign currency business were no longer exist. Nevertheless, what government of PROC and banks in China worried about the most was the schedule of specific commitments to market access for foreign financial institutions to do local currency business (Renminbi business).. 1. China has started negotiations for accession since July 1986 during the GATT (the predecessor of WTO) era.. 1.
(11) According to the schedule of specific commitments under WTO regulations, geographic restrictions of Renminbi (RMB) business in China were gradually cancelled, and as of December 11, 2006 all geographic restrictions were already removed. As for client limitations, began from December 11, 2003(two years after accession) foreign financial institutions can provide services of RMB business to Chinese enterprises, and started from December 11, 2006 (five years after accession) China must open markets and releases all the restrictions on foreign financial institutions to provide services to Chinese citizens.. 政 治 大 and all financial institutions were centrally-controlled by the government, each of them 立 Before 1979 China performed planned economy, banking system was very rigid. was either dissolved or merged into the People’s Bank of China (PBC). Attributing to. ‧ 國. 學. economic reform policies, a series of financial reconstructions and reforms occurred. ‧. since 1984; however, comparing to advanced countries, China’s banking system was. sit. y. Nat. still far away behind. From the end of 2006, foreign banks have fully operated business. io. er. in China nearly four years without restrictions on geography and clients, in order to face challenges and competitions brought from foreign banks’ entry, banking industry. n. al. i in China got no choices but hadC to change accordingly.U n hengchi. v. Due to the characteristics of China’s politics and economy, if we want to study. banking sector in China, the best way is to realize its history; consequently, the study gives a comprehensive review of financial reform process in China after 1979 to understand development trends of the banking industry. Besides, the study compares different sorts of financial indicators about profitability evaluation, quality of assets and liquidity management and compliance of international norms of large commercial banks in China, the United States and Taiwan to find out what are the differences of banking performance between each other.. 2.
(12) 1.1 Motivation Due to the constraint of complicated historical and political factors, Taiwan and China have always been separated in the field of financial interaction. After WTO permitted China’s accession in the end of 2001, our government also lifted bans on domestic banks to set up representative offices in China, and at that time there were seven Taiwanese banks establishing representative offices as front-line units to observe local situations, but none of them can be upgraded as a branch to provide banking services. 2. 政 治 大 China has reached 37,771 立 and USD 82.7 billion, respectively. With growing economic. From 1991 to 2009 the sum of total cases and amount of Taiwan’s investment in. ‧ 國. 學. dependence on China, China has become our largest export region and second largest source of import. 3. ‧. Currently the most important mission for Taiwan government is to improve. sit. y. Nat. cross-strait relationship, during the second ‘‘Chiang-Chen Talks’’ in November of. n. al. er. io. 2008, the two sides had reached a consensus, if it is inevitable to go a step further for. i n U. v. cross-strait financial exchanges, the signing of memorandum of understanding (MOU). Ch. engchi. of financial supervision is necessary. 4 After a year of negotiation, Taiwan and China finally signed the MOU on November 16, 2009 and that also meant Taiwan banks’ landing in China is in near future. In Taiwan despite〈Taiwan Financial Holding Act〉 has implemented in 2001, there were 15 of 37 Taiwan local banks already merged into financial holding companies, the number of financial institutions is still too many in contrast with the. 2. 3 4. Seven Taiwanese banks are Taiwan Cooperative Bank, First Commercial Bank, Hua Nan Commercial Bank, Land Bank of Taiwan, Chang Hwa Commercial Bank, China Trust Commercial Bank, and Cathay United Bank. Taiwan’s trade dependence ratio on China top 40% in 2009, Bureau of Foreign Trade. Chiang Pin-kung, chairman of the Straits Exchange Foundation (SEF), representative of Taiwan. Chen Yun-lin, president of the Association for Relations Across the Taiwan Strait (ARATS), representative of China.. 3.
(13) small scale of Taiwan financial market. As at March of 2010, there are 37 domestic banks with 3,285 branches in Taiwan, if we calculate other sorts of financial institutions, the total number of banking branches has reached 5,850. In the mean time average ROA and ROE of domestic Taiwan banks are 0.13% and 2.1%, respectively; banking profit has been narrowed down due to drastic competition. 5 Overbanking problem in Taiwan is very serious and the issue has been criticized for a long time, I affirm that this situation could be alleviated in the future once cross-strait investment is mutually opened up.. 政 治 大 commercial banks in Taiwan are eager to explore. There is an old idiom: ‘‘Know the 立. China has always been considered as a market with great potential that. enemy and know yourself, and then you can fight a hundred battles without danger of. ‧ 國. 學. defeat.’’ I sincerely hope the study gives Taiwan banks which plan to invest in China. ‧. not only a general picture of local financial situation but also useful and constructive. sit. n. al. er. io. 1.2 Purposes. y. Nat. suggestions for coming challenges and competitions.. Ch. engchi. i n U. v. The study is aiming to examine and find out answers of following questions: 1. How do commercial banks in China make profit? Every commercial bank has its own background and expertise; the study analyzes different kinds of financial indicators relevant to profitability performance of representative commercial banks in China under the consideration of current economic situation and government policies to find out why they can make profits even though global financial tsunami has devastated the world economy.. 5. See Financial Supervisory Commission, Statistics, http://www.fsc.gov.tw/Layout/main_ch/BS_BSList.aspx?pat h=2566&Language=1.. 4.
(14) 2. How do commercial banks in China maintain assets quality? Ratio of Non-Performing Loans (NPL ratio) reveals a bank’s assets quality, and coverage ratio shows a bank’s capability to undertake default risk of bad loans, both ratios are very important indicators to examine assets quality of a bank. Therefore, the study makes an observation of changes of those two indicators of representative commercial banks in China and governmental policies from year 2006 to 2009 to figure out how commercial banks in China maintain assets quality. 3. How do commercial banks in China manage liquidity risk? Many large and. 政 治 大 occurred in late 2008 and the main reason was because those banks failed to manage 立 international banks in USA went bankrupt due to global financial turmoil which. liquidity. From this aspect, management of liquidity is very important for banking. ‧ 國. 學. operation, and relevant indicators popularly used to evaluate liquidity such as liquidity. sit. y. Nat. management of commercial banks in China.. ‧. ratio and loan-to-deposit ratio, etc. will be used to examine effect of liquidity. io. er. 4. How do commercial banks in China obey Basel II? After China’s WTO accession, China must gradually adopt international rules to maintain qualification as a. al. n. v i n C h internationalUorganization to monitor banking member. Nowadays the most important engchi operation in the world is Bank for International Settlement (BIS). BIS proposed ‘‘The. New Capital Accord’’ (Basel II) in June of 2004, the study also includes the examination of how commercial banks in China follow Basel II regulations. 5. What are the differences of banking performance between China and USA? USA has always maintained a leading position in finance and in economy of the world. By comparing financial indicators relevant to profitability, assets quality, liquidity management, and capital adequacy ability between representative commercial banks in China and in USA, the study aims to find out the differences of banking performance. 5.
(15) between each other. 6. What are the differences of banking performance between China and Taiwan? By comparing financial indicators relevant to profitability, assets quality, liquidity management, and capital adequacy ability between representative commercial banks in China and in Taiwan, the study aims to find out the differences of banking performance between each other. 7. What are the investment opportunities for Taiwan banks’ landing in China? By studying banking industry in China can help us better understand what kind of business. 政 治 大 invest. Moreover, by studying relevant regulations on cross-strait financial activities, 立 in China might be niche market that suitable for banks from Taiwan to explore and. the study dedicates to conclude the best approach for Taiwan banks’ development in. ‧. ‧ 國. 學. China.. sit. y. Nat. 1.3 Research Method and Limitation. n. al. er. io. Reference materials about comprehensive study of banking performance. i n U. v. comparison between China and advanced countries are relatively limited; as a result. Ch. engchi. the study collects abundant financial indicators and figures of commercial banks and uses analyses and comparison of selective data to conclude the study results, hence quantitative methodology is adopted in the study. As for data collection, because China Banking Regulatory Commission was set up in 2003, the history of financial regulatory institution in China is very short, historical statistics of banking sector are not sufficient for the study; thus, data collection also contains annual reports of state-owned commercial banks and other study subjects. Except for Agricultural Bank of China, other three state-owned commercial banks in China have been listed by the end of 2007, and their financial statements are made in 6.
(16) two different versions, one is for Hong Kong Stock Exchange (H share) complying with the international accounting standard—IFRS, and the other is for Shanghai Stock Exchange (A share) complying with local Chinese accounting standard—China GAAP. In order to be in line with international norms, the study basically chooses H share annual reports as sources of financial data but if the data is not available in H share annual reports, and then A shares annual reports will be referred as substitute. Besides collecting individual bank’s annual reports, the study is developed highly rely on data provided by the world banking information source—Bankscope.. 政 治 大 ratings, rating reports, news, ownership plus financial and credit analysis software for 立. Bankscope is a database with up to 16 years of detailed financial information including. over 23,000 private and public banks in the world, which is commonly adopted for. ‧ 國. 學. analyses of banking performance. Bankscope is maintained under the cooperation. sit. y. Nat. DIJK, they updates relevant banking information regularly.. ‧. between worldwide-known credit rating agency-Fitch Ratings and BUREAU VAN. io. er. Financial information in Bankscope are majorly provided by Fitch Ratings; however, not only Fitch Ratings but also other credit rating agencies, such as Standard. al. n. v i n C h and the Economist & Poor’s, Moody’s, Capital Intelligence, Intelligence Unit supply engchi U additional information in this database.. According to the classification of Bankscope, if the bank is a subsidiary of a financial holding company, both of them have separate and independent financial reports and that will avoid users from mixing up each other and also allow the study obtains accurate data of research banks. In order to comply with local financial situation, different countries might have different accounting standard and regulations on financial statements, but in Bankscope each ratio is calculated under the same formula and which allows research subjects to be compared base on the same criterion,. 7.
(17) in this regard, indicators with respect to evaluating profitability, assets quality, liquidity, and capital adequacy will be adopted from Bankscope. From the end of 2006 financial markets in China were fully opened for foreign banks’ entrance and most large state-owned commercial banks of China have been listed on Hong Kong Stock Exchange, since then financial statements released from China banking sector have become more transparent and reliable. Besides, the global financial tsunami began to batter world economy and finance in the end of year 2008, such difficult situation could better reflect true banking performance in different. 政 治 大 banks in China, USA, and Taiwan will focus on the period from 2007 to 2009. 立. countries. As a result, comparisons of banking performance among representative. With reference to limitation of the study, when I cross-check the same data from. ‧ 國. 學. different sources, e.g. statistic released by China Banking Regulatory Commission and. ‧. annual reports of large state-owned commercial banks, sometimes the data does not. sit. y. Nat. exactly match. In consideration of the credibility of supervisory institution, the study. io. overall situation of China’s banking industry.. al. er. adopts official data rather than annual reports of individual bank when analyzing the. n. v i n C h Agricultural Bank Additionally, during the research of China was in the process engchi U. of initial public offering, even thought the bank postponed announcement of year 2009 annual report until July 12, 2010, the study still adopted the latest financial data in order to precisely reflect current situation of banking industry in China.. 8.
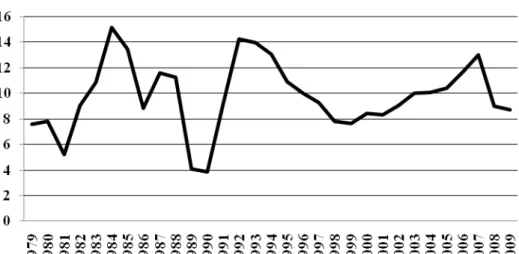
(18) C. HAPTER 2. Banking Performance in China. Before 1979 China implemented central-planned economy system, national finance was dominated by the government, and the expense of economic development financed by government was RMB 76.16 billion, meanwhile, the balance of all banks’ loans was RMB 19.2 billion, the former was four times larger than the latter; however, in 1995 the expense of economic development from government finance was RMB. 政 治 大. 170.4 billion, in the mean time, the balance of all banks’ loans was RMB 973.59. 立. billion, the latter was almost six times larger than the former. This shows that with. ‧ 國. 學. deepened economic reforms banking industry in China plays a more and more important role in supporting the country’s economy (Huang, 1998).. ‧. To achieve profound understanding of China’s banking sector, in this chapter the. y. Nat. sit. study not only gives a historical review of financial reforms and development process. n. al. er. io. of China’s banking system, but also gives the whole picture of current banking. i n U. v. situation in China. Additionally, by examining China’s state-owned commercial banks. Ch. engchi. in four different dimensions, including profitability, assets quality, liquidity management and compliance with international regulations-Basel II to find out how well their performances are.. 2.1 Development Process of China’s Baking System Ever since 1979 the government of China has launched a series of financial reforms to accommodate the path of economic reforms; comprehensive reforms in. 9.
(19) economy and finance have made China maintained years of double digits economic growth rate (Figure 2-1).. 立. 政 治 大. ‧ 國. 學. Source: National Bureau of Statistics of China (2009), China Statistical Yearbook, http://www. stats.gov.cn/tjsj/ndsj/2009/indexeh.htm.. Figure 2-1: Economic Growth Rate of China—1979~2009. ‧ sit. y. Nat. When we look back to history of banking development in China, 1979 was a. io. al. er. watershed year of initiating financial reforms, and development process of banking. n. system in China can be divided into four stages, each of them will be discussed detailed as below.. Ch. engchi. i n U. v. Stage I: Unified Financial System—Before 1979 Before 1979 China performed planned economy, resources were dominated and distributed by the government. In this stage, all banks and financial institutions were dissolved or merged into PBC, at this time PBC was the only financial intermediary in China, and other financial institutions were functionless or became subsidiaries of Ministry of Finance (MOF). PBC was the country’s center of credit, center of settlement and center of cash teller. This stage was commonly known as ‘‘Unified Financial System’’ in China’s financial development history. 10.
(20) Stage II: A Transition Period of The People’s Bank of China—1979~1994 This stage is not only the development process of how PBC adjusted its functions into a real central bank of China but also how national specialized banks developed into state-owned commercial banks (SOCBs). From 1979 major banks including Agricultural Bank of China (ABC), Bank of China (BOC), and the People’s Construction Bank of China (renamed as China Construction Bank (CCB) in 1996) began to resume business in coordination with reform policies. Banking sector was diversified to meet the need of economic. 政 治 大 In January of 1984 Industrial and Commercial Bank of China (ICBC) was 立. development and unified financial system was disintegrated gradually.. established, PBC transferred its city financial business to the newly-established ICBC,. ‧ 國. 學. and withdrew from general commercial banking business. From then on PBC began to. ‧. reveal its specific functions as the central bank of China.. sit. y. Nat. In April of 1987, Bank of Communications (BOCOM) was re-established, and. io. er. other regional joint-stock commercial banks, such as China Merchants Bank (CMB) and CITIC Industrial Bank (renamed as China CITIC Bank in July 2005); national. al. n. v i n C has China Everbright joint-stock commercial banks, such Bank and Huaxia Bank; urban engchi U. credit cooperatives and financial companies have been established, besides, foreign banks also came back to China one after another. In this stage PBC still maintained part of policy and commercial banking business, it was a transitional period of banking system with PBC as the central bank, national specialized banks (predecessor of SOCBs) as the main body and other financial institutions co-existed and coordinated with each other. After the third plenum of the fourteenth central committee, the State Council made an important decision in the end of 1993 that was ‘‘to develop PBC into a real. 11.
(21) central bank of China; to develop national specialized banks into real state-owned commercial banks’’. In March of 1994, three policy banks including China Development Bank, The Export-Import Bank of China, Agricultural Development Bank of China were established to take over policy financing roles from national specialized banks. Four national specialized banks were transformed into SOCBs pursuant to the government’s requirement of commercialization and to carry out complete commercial banking services. Since the end of 1993 PBC was fully separated from commercial banking. 政 治 大 control, and to exercise functions independently; the status of PBC as a central bank of 立. business and started to concentrate on financial supervision and macroeconomic. China was assured.. ‧ 國. 學. Stage III: Establishment of Regulations and Financial Supervision—1995~2003. ‧. China has always been preparing for challenges and impacts that might come after. sit. y. Nat. WTO accession, except for building laws and regulations into financial system,. io. er. policies of eliminating or consolidating financial institutions with weak composition and poor performance were adopted to increase competitiveness of banking industry.. al. n. v i n 〈Law of the People’s Republic C h of China on theUPeople’s Bank of China〉 and engchi. 〈Law of the People’s Republic of China on Commercial Banks〉 were released in 1995 which meant all banking operations in China have laws and regulations to follow. In September of 1997 〈Measures for Administration on Urban Credit Cooperatives〉 was released, most urban credit cooperatives were regionally merged and some of them even became city commercial banks. In addition to uniting urban credit cooperatives, in 1998 the MOF issued RMB 270 billion special national bonds to inject capital into four large SOCBs, 6 and four. 6. Four large SOCBs are ICBC, CCB, BOC and ABC.. 12.
(22) asset management corporations (AMCs) were set up according to 〈Regulations of Financial Asset Management Corporations〉 passed by State Council in April 1999, the main purpose of AMCs’ establishment was to deal with NPL problems of SOCBs. During this period, PBC played multiple roles as the central bank and also the banking supervisor, PBC did not focus on performing monetary policy specifically until China Banking Regulatory Commission (CBRC) took over the function of banking supervision from it. CBRC was established in 2003 to conduct regulations and supervision over all banking institutions and their business activities in China.. 政 治 大 regulations binding, and regulatory system was gradually in line with international 立. In this stage, China’s financial system was getting back on track of laws and. standards.. ‧ 國. 學. Stage IV: Accelerating Reforms of State-owned Commercial Banks—After 2004. ‧. According to the schedule of specific commitments under WTO regulations. sit. y. Nat. (Table 2-1), geographic restrictions on foreign banks were cancelled year after year,. io. er. China must open financial markets in Shanghai, Shenzhen, Tianjin and Dalian upon accession; Guangzhou, Zhuhai, Qingdao, Nanjing and Wuhan within one year after. al. n. v i n C hand Chongqing within accession; Jinan, Fuzhou, Chengdu two years after accession; engchi U. Kunming, Beijing and Xiamen within three years after accession; Shantou, Ningbo, Shenyang and Xi'an within four years after accession, five years afterward all geographic restrictions were removed. As for client limitations, foreign banks can provide services of RMB business to Chinese enterprises after two years of accession, from then on financial markets in China have become more and more competitive than before, and after five years of accession that was December 11, 2006, foreign banks can provide services of RMB business to all Chinese citizens.. 13.
(23) Table 2-1: China’s WTO Commitments—Schedule of Market Access for Foreign Banks to do RMB Business Schedule. Upon Accession. 1 year. 2years. 3 years. 4 years. 5 years. Date. 2001/12/11. 2002/12/11. 2003/12/11. 2004/12/11. 2005/12/11. 2006/12/11. Shanghai. Guangzhou. Jinan. Kunming. Shantou. Shenzhen. Zhuhai. Fuzhou. Beijing. Ningbo. Tianjin. Qingdao. Chengdu. Xiamen. Shenyang. Dalian. Nanjing. Chongqing. (Year/Month/Day). Area. Xi'an. All geographic restrictions will be removed. Wuhan Chinese. Client. Chinese. 政 治 大 Enterprises. Citizens. Source: World Trade Organization, Member Information, http://www.wto.org/english/thewto_e/countries_e/chi na_e.htm.. 立. ‧ 國. 學. We can see from Table 2-2, foreign banks never stop expanding financial markets. ‧. in China, in 2004 there were only 188 operational banking entities of foreign banks in China, 7 and assets of foreign bank were RMB 582 billion accounting for 1.84%. y. Nat. er. io. sit. market share of total banking assets in China, but two years later, in 2006 limitations of geography and customers on foreign banks to provide services were no longer existed,. n. al. Ch. i n U. v. hence the number of banking entities increased to 224; assets grew 59.35% to RMB. engchi. 928 billion, and the market share increased to 2.11% as well. From 2004 to 2009 the number of foreign banks’ operational banking entities increased from 188 to 338, assets grew more than twice from RMB 582 billion to RMB 1,349 billion. And the percentage of market share accounted for total assets in China banking industry rose steadily year by year, but in 2009 the figure fell to 1.71% compared to 2.16% in the previous year, the reason was because the growth rate of total banking assets in China was much higher than that of foreign banks. 7. Operational banking entities include head offices of locally incorporated banks, branches and subsidiaries of locally incorporated banks and foreign bank branches.. 14.
(24) Table 2-2: Foreign Banks in China—2004~2009 Year Item. 2004. 2005. 2006. 2007. 2008. 2009. 188. 207. 224. 274. 311. 338. 5,823. 7,155. 9,279. 12,525. 13,448. 13,492. 1.84. 1.91. 2.11. 2.38. 2.16. 1.71. Operational Banking Entities (Number). Assets (RMB 100 million). Market Share (%). Source: China Banking Regulatory Commission (2009), Annual Report.. 政 治 大 Table 2-3 shows that in 2004 total assets and liabilities of banking institutions in 立 China were RMB 31,599 billion and RMB 30,325 billion, respectively, after five year. ‧ 國. 學. elapsed, total assets increased to RMB 78,769 billion and total liabilities increased to. ‧. RMB 74,335 billion, both of them maintained double digits growth rate every year in. er. io. sit. y. Nat. the period from 2004 to 2009.. Table 2-3: Total Assets and Liabilities of Banking Institutions in China— 2004~2009. n. al. Year Item Assets (RMB 100million). Growth rate (%). Liabilities (RMB 100 million). Growth rate (%). Ch. engchi. i n U. v. 2004. 2005. 2006. 2007. 2008. 2009. 315,990. 374,697. 439,500. 525,983. 623,876. 787,691. 14.25. 18.58. 17.29. 19.68. 18.61. 26.26. 303,253. 358,070. 417,106. 495,675. 586,015. 743,349. 14.03. 18.08. 16.49. 18.84. 18.23. 26.85. Source: China Banking Regulatory Commission (2009), Annual Report, http://www.cbrc.gov.cn/chinese/home/ jsp/docView.jsp?docID=20100615A314C942DEE7DD34FF395FFCEB671E00.. 15.
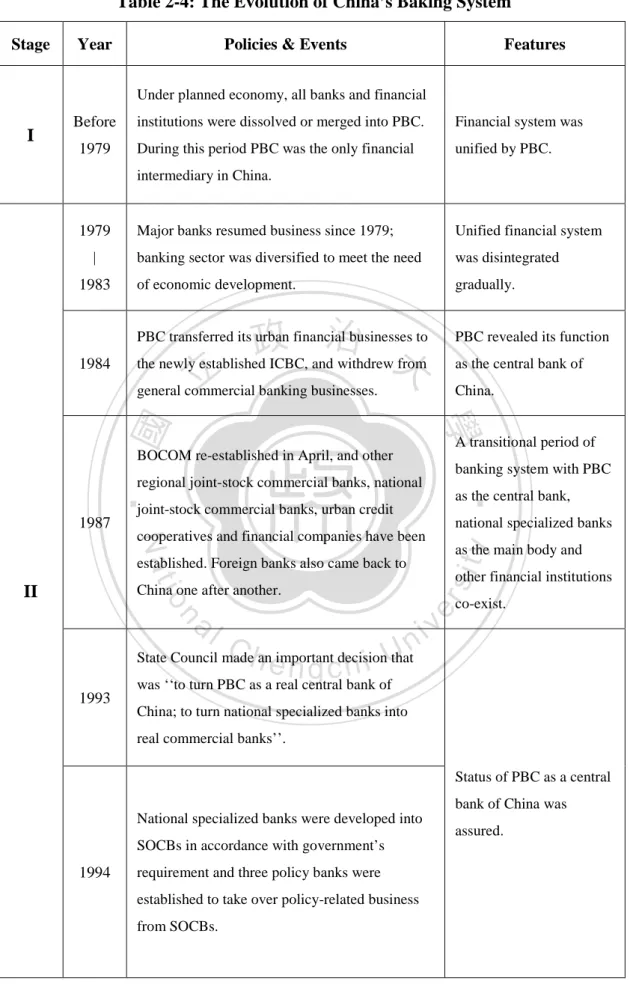
(25) Attributing to markets opening up and thirty years of financial reforms, the scale of banking industry in China has grown very huge. For the purpose of accelerating reforms and increase competitiveness of SOCBs, in 2004 the government of China used huge amount of foreign exchange reserves to inject funds into BOC, CCB and ICBC in order to conduct comprehensive financial restructuring and corporate governance reforms, the final target was to transform them into limited joint-stock companies. Meanwhile, the newly amended 〈Law of the People’s Republic of China on. 政 治 大 banking business but also insurance agency, security cooperation, and investment 立. Commercial Banks〉 allowed commercial banks to provide services of not only. banking sector. Multiple services have shown a pattern of financial holding company;. ‧ 國. 學. however, till now China does not officially approved establishment of financial. ‧. holding company.. sit. y. Nat. SOCBs (except for ABC) went public one after another since 2006, by. io. er. internationalizing and diversifying their business to respond to competition pressures brought from foreign banks. As for ABC, it was transformed into joint-stock company. al. n. v i n C h to go public. In 2010 in January of 2009 and has prepared the initial public offering of engchi U RMB-denominated ordinary shares (A Shares) at Shanghai Stock Exchange and H. share at Hong Kong Stock Exchange of ABC has been approved by the China Securities Regulatory Commission (CSRC). With fully support and protection from the government, SOCBs have a monopoly over the banking industry in China and the degree of competitiveness and internationalization of domestic commercial banks in China also improved a lot. Above discussed four stages of China’s banking system evolution are summarized into Table 2-4.. 16.
(26) Table 2-4: The Evolution of China’s Baking System Stage. Year. Policies & Events. Features. Under planned economy, all banks and financial. I. Before 1979. institutions were dissolved or merged into PBC.. Financial system was. During this period PBC was the only financial. unified by PBC.. intermediary in China.. | 1983. 1984. Major banks resumed business since 1979;. Unified financial system. banking sector was diversified to meet the need. was disintegrated. of economic development.. gradually.. 政 治 大. PBC transferred its urban financial businesses to. PBC revealed its function. the newly established ICBC, and withdrew from. as the central bank of. general commercial banking businesses.. China.. 立. 學. ‧ 國. 1979. A transitional period of. BOCOM re-established in April, and other. banking system with PBC as the central bank,. joint-stock commercial banks, urban credit. national specialized banks. Nat. cooperatives and financial companies have been. as the main body and other financial institutions. io. er. China one after another.. al. n. 1993. sit. established. Foreign banks also came back to. II. y. 1987. ‧. regional joint-stock commercial banks, national. i n C State Council madehan important decision e n g c h i Uthat was ‘‘to turn PBC as a real central bank of. v. co-exist.. China; to turn national specialized banks into real commercial banks’’. Status of PBC as a central bank of China was National specialized banks were developed into SOCBs in accordance with government’s. 1994. requirement and three policy banks were established to take over policy-related business from SOCBs.. 17. assured..
(27) Table 2-4: The Evolution of China’s Baking System (Continued) Stage. Year. Policies & Events. Features. 〈Law of the People’s Republic of China on the People’s Bank of China〉 and 〈Law of the. 1995. People’s Republic of China on Commercial Banks〉 were released in March. In September 〈Measures for Administration on China’s financial system. Urban Credit Cooperatives〉 was released, and. 1997. was back on track of laws. most urban credit cooperatives were merged or. and regulations binding,. transformed into city commercial banks.. 1998. MOF issued 270 billion special national bonds to. was established to meet. supplement capital of SOCBs.. international standards.. 立. In April four AMCs were set up to deal with NPL problems of SOCBs.. ‧. 2003. CBRC was established and took over functions. sit. y. Nat. of banking supervision from PBC. Government of PROC used huge amount of. io. er. foreign exchange reserves to inject funds into the. n. al. i n C comprehensive financial and h e restructuring ngchi U BOC, CCB and ICBC to conduct a. 2004. and the regulatory system. 學. 1999. 政 治 大. ‧ 國. III. v. corporate governance reforms. The goal was to transform SOCBs into limited joint-stock. Accelerating reforms of. companies.. IV. SOCBs in order to SOCBs (except ABC) went public one after. 2006. another. In December a series of policies were implemented to speed up developing rural cooperatives into rural commercial banks.. 2009. In January ABC was transformed into joint-stock company and has prepared to go public.. Source: Chu (2010); Bankscope, http://bankscope.bvdep.com/ip.. 18. increase competitiveness..
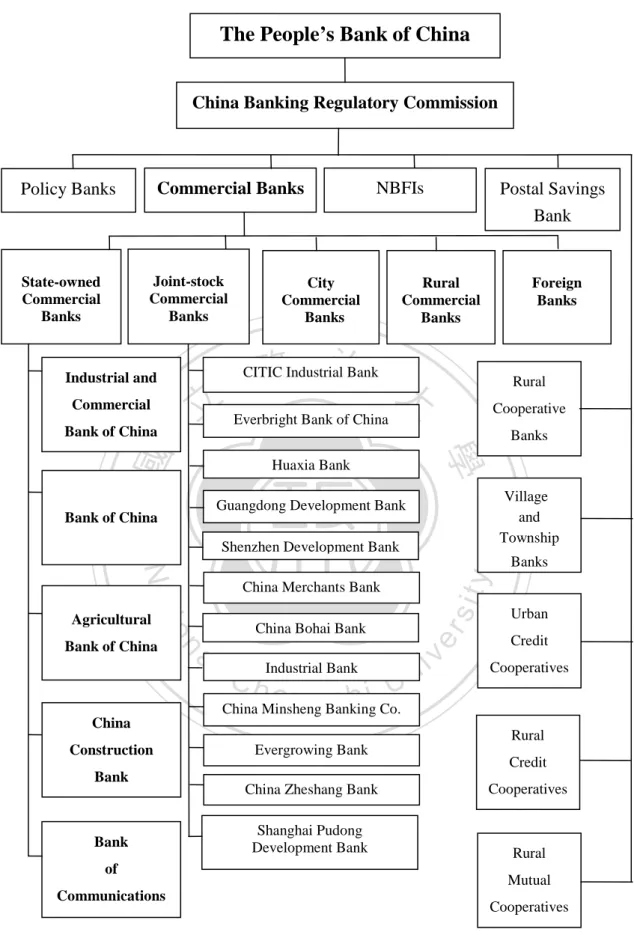
(28) 2.2 Overview of Banking Industry in China After thirty years of financial reforms, currently in the banking system of China the PBC takes charge of monetary policies as the central bank and CBRC plays the role regulating and supervising business operations of banking institutions. The objectives of CBRC are promoting safety and soundness of banking industry, enhancing the industry’s competitiveness, and maintaining public confidence in the banking sector; the supervisory missions of CBRC are protecting interests of depositors and consumers, maintaining market confidence through prudential. 政 治 大 through 立education and information. supervision, increasing public knowledge about modern financial products, services and related risks. ‧ 國. 學. banking-related crimes to maintain financial stability.. disclosure, and reducing. China’s banking system went through three decades of development; the structure. ‧. has been built completely and also became more and more diversified. In the end of. sit. y. Nat. 2009, China’s banking system consists of 3 policy banks, 5 state-owned commercial. n. al. er. io. banks (SOCBs), including ICBC, CCB, BOC, ABC and BOCOM, 12 joint-stock. i n U. v. commercial banks (JSCBs), 143 city commercial banks, 43 rural commercial banks, 37. Ch. engchi. foreign banks, 196 rural cooperative banks, 148 village and township banks, 11 urban credit cooperatives, 3,056 rural credit cooperatives, 16 rural mutual cooperatives, one postal savings bank of China and other non-bank financial institutions (NBFIs) which include 8 lending companies, 58 trust companies, 12 financial leasing companies, and 10 auto finance companies, etc (Figure 2-2). According to CBRC’s definition of commercial banks, commercial banks in China shall include SOCBs, JSCBs, city commercial banks, rural commercial banks, and foreign banks.. 19.
(29) The People’s Bank of China China Banking Regulatory Commission. NBFIs. Commercial Banks. Joint-stock Commercial Banks. 立. Commercial. 政 治 大. Village and Township. Guangdong Development Bank. ‧. Shenzhen Development Bank. y. Banks. Nat. io. China Merchants Bank. al. China Bohai Bank. n. Bank. Cooperative Banks. C hIndustrial Bank U n e n gBanking c h i Co. China Minsheng. China. Bank. Rural. Everbright Bank of China Huaxia Bank. Bank of China. Construction. Foreign Banks. 學. ‧ 國. Bank of China. Bank of China. Rural Commercial Banks. CITIC Industrial Bank. Industrial and. Agricultural. City Commercial Banks. sit. State-owned Commercial Banks. Postal Savings Bank. er. Policy Banks. iv. Urban Credit Cooperatives. Rural Evergrowing Bank. Credit. China Zheshang Bank. Cooperatives. Shanghai Pudong Development Bank. Rural. of. Mutual. Communications. Cooperatives. Source: China Banking Regulatory Commission (2009), Annual Report, http://www.cbrc.gov.cn/chinese/home/j sp/docView.jsp?docID=20100615A314C942DEE7DD34FF395FFCEB671E00; Chu (2010).. Figure 2-2: The Structure of Banking System in China—2009. 20.
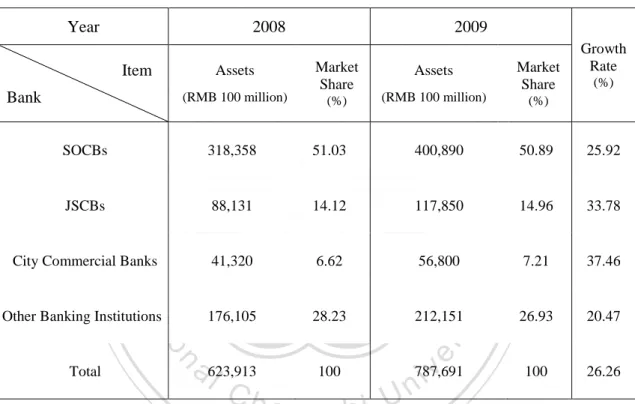
(30) Table 2-5 shows the number of legal entities and staff of different sorts of commercial banks in China, as of year 2009 the total number of legal entities in banking industry was 3,857 and the total number of employees was around 2.84 million. Except for other banking institutions which has 0.86 million workers, commercials banks account for 69.63% of total banking staff, but with 1.5 million workers merely five SOCBs hire over half banking staff in China. Because SOCBs are developed and transformed from national specialized banks, with government’s fully support and protection, they are very huge either in scale or in. 政 治 大. assets and that is also the reason why they become so important to China’s economic development.. 學. ‧ 國. 立. Table 2-5: Legal Entities and Staff of Commercial Banks in China—2009. al. 143. 43. n. Staff (Number). 1,506,424. Foreign Banks. Other Banking Institutions. Total. y 12. io. (Number). City Rural Commercial Commercial Banks Banks. 197,657. 37. sit. 5. Nat. Legal Entities. JSCBs. 3,617. 3,857. 864,038. 2,844,703. er. Item. SOCBs. ‧. Bank. Ch. 177,765. 66,317. engchi. iv 32,502 n U. Source: China Banking Regulatory Commission (2009), Annual Report, http://www.cbrc.gov.cn/chinese/home/js p/docView.jsp?docID=20100615A314C942DEE7DD34FF395FFCEB671E00.. SOCBs, JSCBs and city commercial banks were the focus of government’s restructuring efforts during banking reforms, and they have grown and developed very fast in recent years. From 2008 to 2009 assets of SOCBs were up by 25.92 % to RMB 40,089 billion; assets of JSCBs were up by 33.78% to RMB 11,785 billion; assets of city commercial banks were up by 37.46% to RMB 5,680 billion, in 2009 they accounted for 73.06% market share in terms of total banking assets. 21.
(31) Total assets of banking institutions in China were RMB 62,391 billion in 2008, and SOCBs had 31,835 billion in assets accounting for 51.03% market share; in 2009 total banking assets increased by 26.26% to RMB 78,769 billion, and total assets of SOCBs were 40,089 billion accounting for 50.89% market share, which means half of financial markets in China were shared and dominated by SOCBs (Table 2-6).. Table 2-6: Assets and Market Share of Banking Institutions in China—2008~2009 Year. 2008 Item. 政 治 大. Assets. Bank. (RMB 100 million). 立. SOCBs. Market Share (%). Assets. (RMB 100 million). 318,358. 51.03. 400,890. 88,131. 14.12. 117,850. 41,320. 6.62. 56,800. 176,105. 28.23. 212,151. Market Share. Growth Rate (%). (%). 50.89. 25.92. 14.96. 33.78. 7.21. 37.46. 26.93. 20.47. y. Nat. Other Banking Institutions. er. io. sit. City Commercial Banks. ‧. ‧ 國. 學. JSCBs. 2009. n. a l623,913 100 787,691 100 26.26 v i n Ch Note: Other banking institutions include policy e banks, h i U banks, urban credit cooperatives, rural n gruralccommercial Total. credit cooperatives, postal savings, foreign banks and non-bank financial institutions. Source: China Banking Regulatory Commission, Statistics, http://www.cbrc.gov.cn/chinese/info/twohome/index. jsp?itemCode=9.. Figure 2-3 helps us better understand distribution of market share of total banking assets in China. SOCBs were developed from national specialized banks with extensive branch networks and large state-owned enterprises as customer base; moreover, China government’s restructuring plans and fully support in past thirty years have contributed to their huge scale in assets, currently all of them are ranking among the world’s top 100 largest banks. In addition, the government has made a lot of efforts 22.
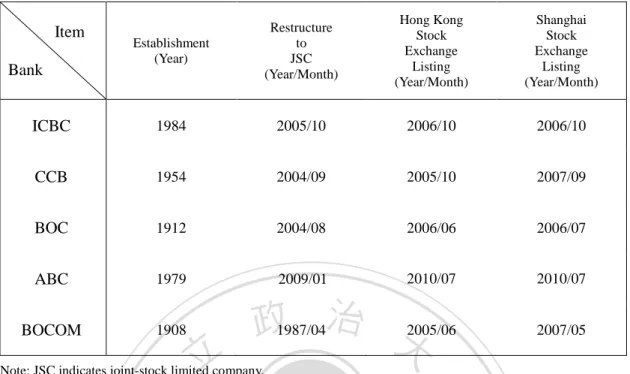
(32) to protect them from severe competitions and which also allows they to maintain monopoly and leading position in financial markets.. 立. 政 治 大. ‧ 國. 學. Source: China Banking Regulatory Commission, Statistics, http://www.cbrc.gov.cn/chinese/info/twohome/index. jsp?itemCode=9.. ‧. Figure 2-3: Market Share of Total Banking Assets in China—2009. sit. y. Nat. n. al. er. io. Table 2-7 summarizes the history of establishment, restructuring to joint-stock. i n U. v. company, H shares initial public offering on Hong Kong Stock Exchange and A shares. Ch. engchi. initial public offering on Shanghai Stock Exchange of each SOCB. Every SOCB had been restructured as a joint-stock company, among others BOCOM was the earliest bank to transform share structure and BOCOM was also the earliest bank to have a foreign bank as shareholder, in March of 2004 HSBC possessed 19.99% shares of it. By 2008 except ABC the rest four SOCBs all went public, but in 2010 ABC got the approval from CSRC and prepared to go public, the date of dealings in A shares on Shanghai Stock Exchange was set on July 15, 2010 and the date of dealings in H shares on the Hong Kong Stock Exchange was set on July 16, 2010. 23.
(33) Table 2-7: Establishment and Listing of State-owned Commercial Banks. Establishment (Year). Restructure to JSC (Year/Month). Hong Kong Stock Exchange Listing (Year/Month). Shanghai Stock Exchange Listing (Year/Month). ICBC. 1984. 2005/10. 2006/10. 2006/10. CCB. 1954. 2004/09. 2005/10. 2007/09. BOC. 1912. 2004/08. 2006/06. 2006/07. ABC. 1979. 2009/01. 2010/07. 2010/07. BOCOM. 1908. Item Bank. 政 治 大 1987/04. 立. 2005/06. 2007/05. ‧. ‧ 國. 學. Note: JSC indicates joint-stock limited company. Source: Bankscope, http://bankscope.bvdep.com/ip; ICBC, CCB, BOC, ABC, and BOCOM, Annual Report, 2008~2009; ABC (2010), Notice of Public Offering, http://www.abchina.com/cn/AboutABC/IssuePubl icNotice/201007/W020100701327391494124.pdf.. According to the latest world ranking by total assets in 2009 from Bankscope. Nat. sit. y. database, SOCBs all rank among top 100 banks in the world, and ICBC even ranks. n. al. er. io. among top 10 banks in the world.. i n U. v. With RMB 11.79 trillion of total assets ICBC ranks number 1 in China and. Ch. engchi. number 8 in the world; CCB ranks number 2 in China and number 15 in the world by RMB 9.62 trillion of total assets; ABC ranks number 3 in China and number 17 in the world by RMB 8.88 trillion of total assets; BOC ranks number 4 in China and number 19 in the world by RMB 8.75 trillion of total assets; BOCOM ranks number 6 in China and number 65 in the world by RMB 3.31 trillion of total assets. Although ABC is not the largest bank in China in terms of total assets, as of 2009 ABC has the most extensive distribution networks among large commercial banks in China with 23,624 branches and service outlets, and with 441,144 employees it also provides a lot of financial employment opportunities in China (Table 2-8). 24.
(34) Table 2-8: Ranking of State-owned Commercial Banks in China—2009 Item. Number of Branches. Number of Employees. 679. 16,394. 386,723. 9,623. 559. 13,392. 301,537. 17. 8,883. 343. 23,624. 441,144. 4. 19. 8,748. 542. 10,961. 262,566. 6. 65. 2,770. 79,122. Total Assets. Domestic Ranking. World Ranking. ICBC. 1. 8. 11,785. CCB. 2. 15. ABC. 3. BOC BOCOM. Bank. 立. ( RMB billion). Equities ( RMB billion). 政 治 大 3,309. 164. ‧ 國. 學. Note: According to Bankscope, world ranking is based on each bank’s total assets of last available fiscal year. Source: ICBC, ABC, and BOCOM, Annual Report, 2009; Bankscope, http://bankscope.bvdep.com/ip.. ‧. In 2009 among these five banks, ICBC had the largest amount of loans grew by. sit. y. Nat. 22.52% to RMB 5.32 trillion compared to the previous year, BOC had the second. io. er. largest amount of loans grew by 50.41% to RMB 4.80 trillion, and CCB had the third largest amount of loans grew by 27.4% to RMB 4.69 trillion, amount of loans of ABC. al. n. v i n and BOCOM were RMB 4.01 trillion respectively (Figure 2-4). C h and RMB 1.84 trillion, engchi U. Source: ICBC, CCB, ABC, BOC, and BOCOM, Annual Report, 2008~2009.. Figure 2-4: Loans of SOCBs in China—2008~2009 25.
(35) As for deposits of SOCBs, from 2008 to 2009 the amount of deposits of ICBC increased by 23.35% to RMB 9.1 trillion; deposits of CCB increased by 25.49% to RMB 8 trillion; deposits of ABC increased by 22.96% to RMB 7.5 trillion; deposits of BOC increased by 29.76% to RMB 6.62 trillion; deposits of BOCOM increased by 27.13% to RMB 2.37 trillion (Figure 2-5).. 立. 政 治 大. ‧. ‧ 國. 學 sit. y. Nat. Source: Same as Figure 2-4.. io. er. Figure 2-5: Deposits of SOCBs in China—2008~2009. al. n. v i n C h that from 2008 toU2009, with double digits growth Figure 2-4 and Figure 2-5 show engchi. rate of loans and deposits, each SOCB all maintain upward trend and BOC exceptionally had the highest growth rate both in the amount of loans and deposits that were 50.41% and 29.76%, respectively. Given SOCBs’ large scale in assets, loans, deposits, and their status in China banking industry, they are most qualified to represent banks in China. As a result, the following study will focus on analyzing their profitability performance, policies of controlling non-performing loans, liquidity risk management and how they comply with international regulation—Basel II.. 26.
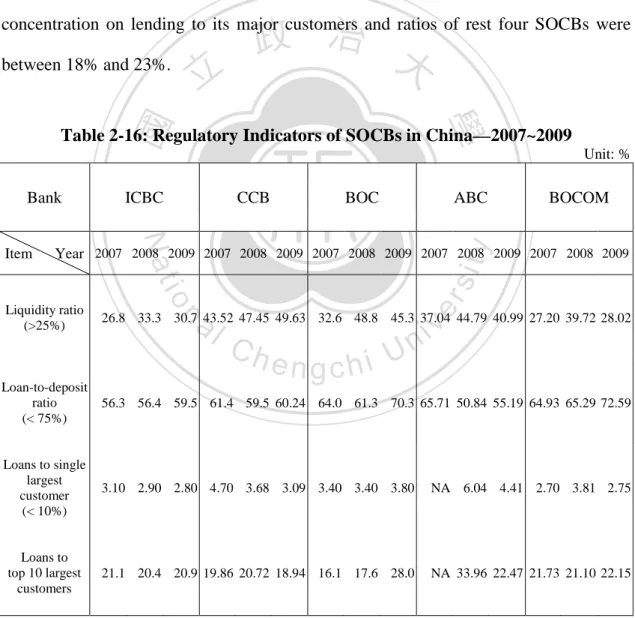
(36) 2.3 Analysis of Profitability Performance In China benchmark loan interest rate and deposit interest rate are controlled and adjusted by the PBC, according to article 38 of 〈Law of the People’s Republic of China on Commercial Banks〉, lending rate determined by commercial banks must fluctuate in the range between upper limit and lower limit loan interest rate regulated by the PBC. In order to promote marketization of interest rates and increase pricing power of financial institutions to further prevent financial risks, on October 29, 2004 PBC. 政 治 大 downward deposit rate was 立allowed to widen fluctuation range between deposit and decided to raise benchmark deposit and loan interest rates of local currency, and. ‧ 國. 學. loan interest rate.. Excluding urban and rural cooperatives, the loan interest rate ceiling of other sorts. ‧. of financial institutions will be cancelled; however, the lower limit remains the same. sit. y. Nat. as 0.9 times the benchmark rate. Due to lack of competition, urban and rural. n. al. er. io. cooperatives still implement upper limit management of loan interest rate; the ceiling is 2.3 times the benchmark rate.. Ch. engchi. i n U. v. Table 2-9 shows that since year 2002, the benchmark lending rate of RMB loans maintains slightly upward trend, but in 2008 China inevitably confronted with global financial tsunami and risk of slow economic growth, began in September PBC adopted loose monetary policy to stimulate the economy; therefore, the benchmark lending rate of 1-year-term RMB loans fell from 7.47% to 7.20%, as for other term of loans the interest rate also dropped. Now in China the current benchmark loan interest rate for 1-year-term RMB loans is 5.31%, while the benchmark rate for 1-year time deposit is 2.25%, without upper limit of lending rate, the interest spread is very high. 27.
(37) Table 2-9: Benchmark Interest Rate of RMB Loans Unit: %. Short Term. Medium and Long Term. Adjust Time 6 month. 1 year. 3 years. Above. ~1 year. ~3 years. ~5 years. 5 years. 5.04. 5.31. 5.49. 5.58. 5.76. 2004/10/29. 5.22. 5.58. 5.76. 5.85. 6.12. 2006/04/28. 5.40. 5.85. 6.03. 6.12. 6.39. 2006/08/19. 5.58. 6.12. 6.30. 6.48. 6.84. 2007/03/18. 5.67. 6.39. 6.57. 6.75. 7.11. 2007/05/19. 5.85. 6.57. 6.75. 6.93. 7.20. 2007/07/21. 6.03. 6.84. 7.02. 7.20. 7.38. 2007/08/22. 6.21. 7.02. 7.20. 7.38. 7.56. 2007/09/15. 6.48. 7.29. 7.47. 7.65. 7.83. 2007/12/21. 7.47. 7.56. 7.74. 7.83. 2008/09/16. 立 6.21. 7.20. 7.29. 7.56. 7.74. 2008/10/09. 6.12. 6.93. 7.02. 7.29. 7.47. 2008/10/30. 6.03. 6.66. 6.75. 7.02. 7.20. 2008/11/27. 5.04. 5.58. 5.67. 5.94. 6.12. 2008/12/23. 4.86. 5.31. 5.40. ‧. 5.94. (Year/Month/Day). 6 month. 2002/02/21. 學. ‧ 國. 6.57. 政 治 大. 5.76. er. io. sit. y. Nat. Source: The People’s Bank of China, Monetary Policy Department, http://www.pbc.gov.cn/publish/zhengcehu obisi/627/index.html. (In Chinese). al. Table 2-10 shows that in 2009 the total profit after tax of banking institutions in. n. v i n China was RMB 668.4 billion,C 49.63% than which in 2007, during the same h e ngreater gchi U. period profit after tax of SOCBs increased from RMB 246.6 billion in 2007 to RMB 400.1 billion in 2009 with 62.25% growth rate; profit after tax of JSCBs increased from RMB 56.4 billion in 2007 to RMB 92.5 billion in 2009 with 64.01% growth rate. In 2009 profit after tax of city commercial banks doubled to RMB 49.7 billion from RMB 24.8 billion in 2007, and profit after tax of rural commercial banks even grew 246.51% to RMB 14.9 billion from RMB 4.3 billion in 2007. From 2007 to 2009, every sort of commercial banks in China has maintained positive and double digits growth rate of after-tax profit annually, but in 2008 only 28.
(38) after-tax profit of foreign banks decreased from RMB 11.9 billion to RMB 6.5 billion in 2009. Although in 2009 SOCBs gained almost 60% of overall after-tax profit in China banking industry, among all commercial banks rural commercial banks surprisingly had the best profit growth performance, and city commercial banks ranked the second.. Table 2-10: Profit After Tax of Commercial Banks in China-2007~2009 Year. 2009. ( RMB 100 million). ( RMB 100 million). ( RMB 100 million). 立. 政 治 大 2,466 3,542. 248. 408. Rural Commercial Banks. 43. 73. Foreign Banks. 61. 119. Ch. 5,834. ‧ 國. City Commercial Banks. 64.01. 497. 100.40. 149. 246.51. y. Nat. io. al. n Total Banking Institutions. 925. ‧. 841. (%). 62.25. 學. 564. Growth Rate. 4,001. 4,467. engchi. sit. SOCBs. JSCBs. 2008. 65. 6.56. 6,684. 49.63. er. Bank. 2007. i n U. v. Source: China Banking Regulatory Commission, Annual Report, 2009.. Figure 2-6 demonstrates distribution of different sources of profit of banking institutions in China. In 2009 profit of banking institutions consisted of net interest income (63%), investment returns (24%), net fee-based income (12%) and others (1%), the first three were major components of profit in China’s banking industry, however, among them net interest income was the most important source of profit that banks in China rely on.. 29.
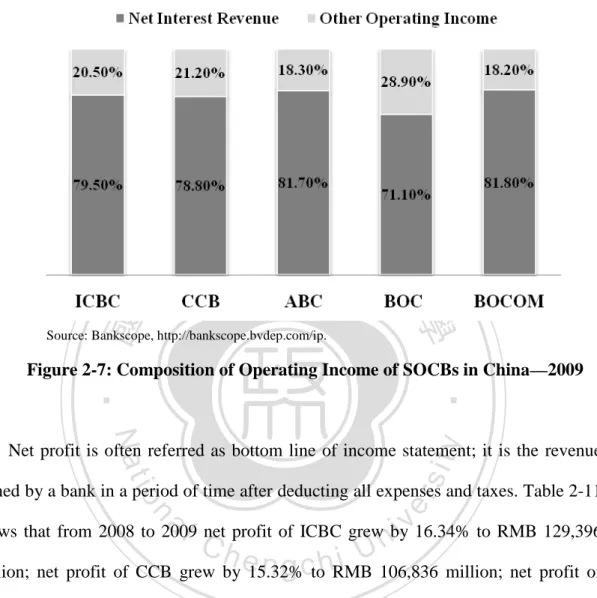
(39) Source: China Banking Regulatory Commission, Annual Report, 2009.. 政 治 大. Figure 2-6: Profit Distribution of Banking Institutions in China—2009. 立. ‧ 國. 學. Among different kinds of financial statements, income statement represents the whole process of income and expenses of a bank’s business operation; hence if we. ‧. want to examine a bank’s profitability, the best approach is to start from analyzing. y. Nat. sit. income statement. In a bank’s income statement, operating income is the sum of every. n. al. er. io. income obtained from banking activities and representing the outcome of bank’s performance.. Ch. engchi. i n U. v. Figure 2-7 illustrates the composition of income statement of each SOCB by dividing operating income into net interest revenue and other operating income. If the proportion of net interest revenue is larger than the proportion of other operating income, which means that profit of this bank mainly comes from spread between lending rate and deposit rate by giving loans to customers. In 2009 net interest revenue accounts for over 70% of operating income of each SOCB, and ABC and BOCOM particularly relied on net interest revenue as source of income. As for other operating revenue, BOC has the highest percentage of 28.9%,. 30.
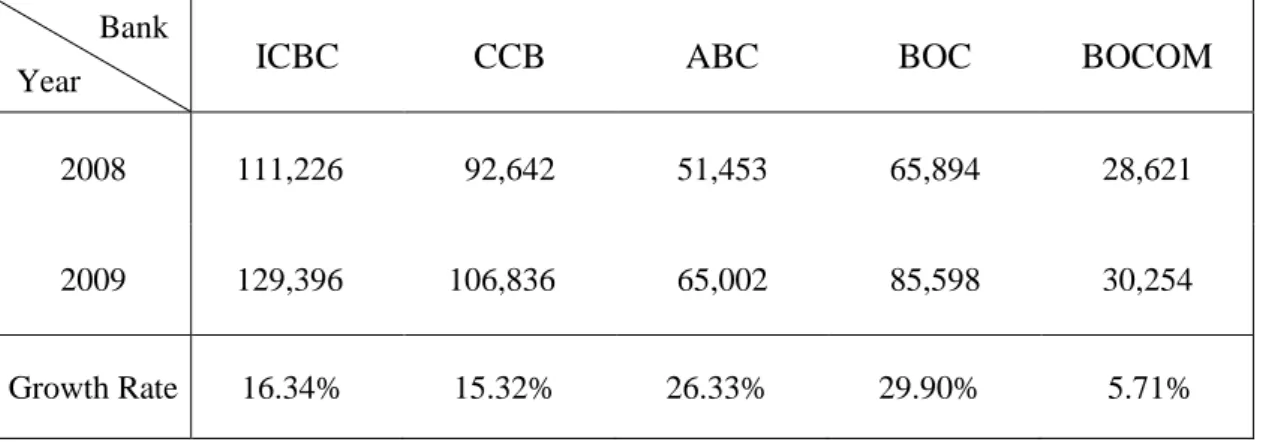
(40) suggesting that once the interest spread in China becomes narrower, and then BOC will suffer less than other SOCBs.. 政 治 大. 學. ‧ 國. 立. Source: Bankscope, http://bankscope.bvdep.com/ip.. Figure 2-7: Composition of Operating Income of SOCBs in China—2009. ‧ y. Nat. sit. Net profit is often referred as bottom line of income statement; it is the revenue. n. al. er. io. earned by a bank in a period of time after deducting all expenses and taxes. Table 2-11. i n U. v. shows that from 2008 to 2009 net profit of ICBC grew by 16.34% to RMB 129,396. Ch. engchi. million; net profit of CCB grew by 15.32% to RMB 106,836 million; net profit of ABC grew by 26.33% to RMB 65,002 million; net profit of BOC grew by 29.90% to RMB 85,598 million, as for BOCOM the net profit grew by 5.71% to RMB 30,254 million. As the largest state-owned commercial bank in China, net profit of ICBC was the highest one both in 2008 and 2009; however, while compare SOCBs in terms of growth rate of net profit, the profitability of BOC was the best one, the second was ABC, and ICBC ranked the third.. 31.
(41) Table 2-11: Net Profit of SOCBs in China—2008~2009 Unit: RMB million. Bank. ICBC. CCB. ABC. BOC. BOCOM. 2008. 111,226. 92,642. 51,453. 65,894. 28,621. 2009. 129,396. 106,836. 65,002. 85,598. 30,254. Growth Rate. 16.34%. 15.32%. 26.33%. 29.90%. 5.71%. Year. Source: Same as Figure 2-4.. 政 治 大 2009, including Return on Average Assets (ROA), Return on Average Equity (ROE), 立. Table 2-12 summarizes four indicators of profitability of SOCBs from 2007 to. ‧ 國. 學. Cost-to-Income ratio and Net Interest Margin; each indicator will be introduced and analyzed as below.. ‧. ROA is one of the most important ratios in comparing the efficiency and. sit. y. Nat. operational performance of banks as it looks at returns generated from the assets. io. er. financed by the bank; as for ROE which is a measure of returns on shareholder funds, both of them are significant indicators commonly used to assess profitability of banks,. n. al. Ch. and the higher ratio means the better profitability.. 8. engchi. i n U. v. According to statistics of last ten years, average ROA of the world’s top 100 banks is 1%, and average ROE of the world’s top 100 banks is between 12% and 14% (Wu, 2008). In 2008 average ROA and ROE of the banking industry in China were 1% and 17.1% respectively, which meant that profitability of China banking sector was good; however, in 2009 average ROA and ROE of the banking industry slightly dropped to 0.9% and 16.2%. 9. 8 9. ROA= net income / average total assets; ROE= net income / average equity See China Banking Regulatory Commission (2008~2009), Annual Report, http://www.cbrc.gov.cn/english/in fo/annual/index.jsp.. 32.
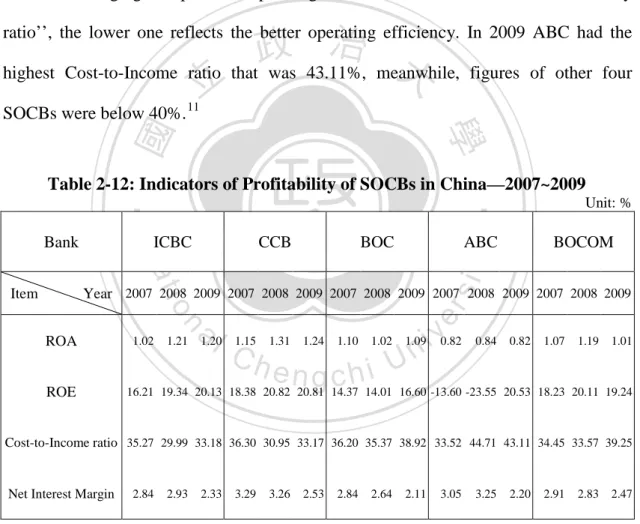
(42) From 2007 to 2009, except for ABC, ROA of other SOCBs were higher than 1%, in 2009 only ROE of CCB and BOCOM were down from last year while other SOCBs had increasing ROE. It is worthy to pay attention that from 2007 to 2008 net profit of ABC has increased from RMB 43.79 billion to RMB 51.45 billion, but because in 2007 equity of ABC was negative so that resulted in negative ROE for past two consecutive years. 10 As for Cost-to-Income ratio, which is commonly used to evaluate how operating costs are changing compared to operating income, and it is also called ‘‘efficiency. 政 治 大 highest Cost-to-Income ratio that was 43.11%, meanwhile, figures of other four 立. ratio’’, the lower one reflects the better operating efficiency. In 2009 ABC had the. SOCBs were below 40%. 11. ‧ 國. 學 BOC. ABC. BOCOM. sit. y. CCB. Unit: %. n. al. er. Year 2007 2008 2009 2007 2008 2009 2007 2008 2009 2007 2008 2009 2007 2008 2009. io. Item. ICBC. Nat. Bank. ‧. Table 2-12: Indicators of Profitability of SOCBs in China—2007~2009. ROA. ROE. 1.02. 1.21. 1.20. 1.15. Ch. 1.31. 1.24. 1.10. i n U. 1.02. engchi. 1.09. v. 0.82. 0.84. 0.82. 1.07. 1.19. 1.01. 16.21 19.34 20.13 18.38 20.82 20.81 14.37 14.01 16.60 -13.60 -23.55 20.53 18.23 20.11 19.24. Cost-to-Income ratio 35.27 29.99 33.18 36.30 30.95 33.17 36.20 35.37 38.92 33.52 44.71 43.11 34.45 33.57 39.25. Net Interest Margin. 2.84. 2.93. 2.33. 3.29. 3.26. 2.53. 2.84. 2.64. 2.11. 3.05. 3.25. 2.20. 2.91. 2.83. 2.47. Source: Bankscope, http://bankscope.bvdep.com/ip; ABC, Annual Report, 2009.. In addition to ROA, ROE and Cost-to-Income ratio, Net Interest Margin (NIM) is also a useful measure to examine how well the ability of a bank is to profit from its 10 11. See ABC (2008), Annual Report. Cost-to-Income ratio= overheads / (net interest revenue + other operating income). 33.
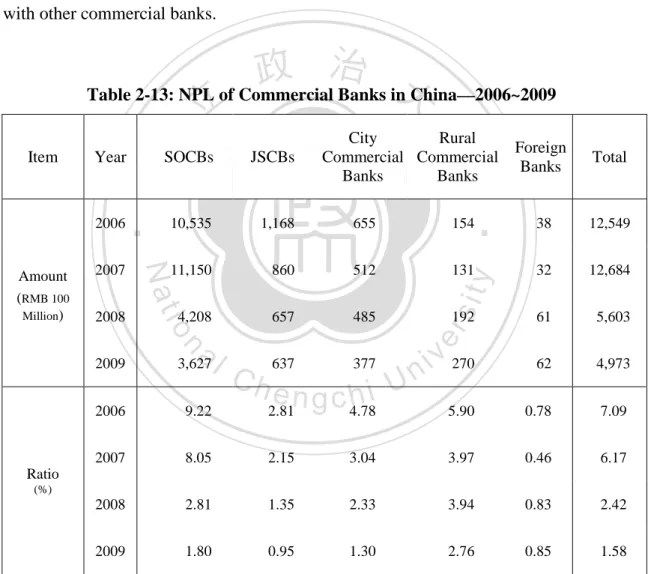
(43) interest-generating assets, and the higher one also reflects the better profitability. 12 In 2009 NIM of SOCBs all decreased compare to the previous year, because downwarding benchmark lending rate has reduced net interest income of SOCBs and also resulted in decending NIM. Because BOC has the smallest proportion of net interest revenue in its operating revenue; therefore, BOC suffers less than its peers from narrowing interest margin.. 2.4 Evaluation of Assets Quality. 政 治 大 indicator when examining 立 assets quality of a bank. Before year 2000 NPL ratio of NPL ratio is commonly used and also could be said as the most important 13. ‧ 國. 學. commercial banks in China top 50%, and the main reason was unlimited funding to state-owned enterprises and default ratios were pretty high. For a long period, domestic. ‧. commercial banks in China have had always been criticized for high amounts and. sit. y. Nat. ratios of NPL, and many financial experts have warned that financial risk in China was. n. al. er. io. extremely high (Chang, 2001).. i n U. v. Central government of PROC was aware of the seriousness that how NPL can. Ch. engchi. affect financial system in China and began to adopt measures to avoid NPL problems from deteriorating. In 1999 State Council passed the legislation of〈Regulations of Financial Asset Management Corporations 〉 to set up four asset management corporations (AMCs), they are China Cinda Asset Management Corporation, China Orient Asset Management Corporation, China Huarong Asset Management Corporation, and China Great Wall Asset Management Corporation. The main purpose to establish four AMCs is to solve and control NPL problems of SOCBs.. 12 13. Net Interest Margin= net interest revenue / average total earning assets NPL ratio= impaired loans / (loans+ loan loss reserve). 34.
數據
+7
相關文件
This shows that, up until the mid to late Tang Dynasty, objects made of glass and crystal still were both called liuli, whereas the term poli was used to refer to
Curriculum planning - conduct holistic curriculum review and planning across year levels to ensure progressive development of students’ speaking skills in content, organisation
This paper examines the effect of banks’off-balance sheet activities on their risk and profitability in Taiwan.We takes quarterly data of 37 commercial banks, covering the period
“Water control and useful knowledge: river management and the evolution of knowledge in China, Northern Italy and the Netherlands.” Paper presented at the Global Economic
Teacher / HR Data Payroll School email system Exam papers Exam Grades /.
Classifying sensitive data (personal data, mailbox, exam papers etc.) Managing file storage, backup and cloud services, IT Assets (keys) Security in IT Procurement and
Financial Analysis (i) Calculate ratios and comment on a company’s profitability, liquidity, solvency, management efficiency and return on investment: mark-up, inventory
{Assess business performance from a range of accounting ratios in terms of profitability,. liquidity, solvency and management efficiency
