Cognitive function and associated factors among older people in Taiwan: Age and sex differences
Abstract
Purpose: The aim of this study was to examine cognitive function and the risk and the protective factors by age and sex among Taiwanese older people. Methods: The data were from a nation-representative panel of older people in Taiwan. The
participants completing both the 2003 and 2007 waves were included for analysis in this study (n=3228). Descriptive analysis and generalized linear model were applied, and the samples were stratified by age groups and by sex. Results: The factors related to higher cognitive function at the intercept included being younger, male, higher education, and doing unpaid work. At the time slope, the age effect and physical function difficulties would reduce the cognitive function across time, while education and providing informational support would increase the cognitive function across time. There were age- and sex- differences in the factors related to cognitive function, particularly on the working status and social participation. Conclusion: Different health promotion strategies to target these populations should be accordingly developed.
Key words: cognitive function, longitudinal study, older adults, age difference, gender difference
Cognitive function and associated factors among older people in Taiwan: age and sex differences
Introduction
Cognitive impairment has significant negative impacts for older people.
Dementia or severe cognitive impairment not only affects the quality of life for older people but also causes a heavy burden for their families and increases medical costs for society. Only when the cognitive impairment is mild is it possible to prevent worsening of the progression (Weimer & Sager, 2009). Previous studies have explored the risk factors for cognitive function impairment and the incidence of dementia (Loef & Walach, 2013; Burton et al., 2013; Teixeira et al., 2012; Yen et al., 2010; Wang et al., 2010), and some studies have tried to explored the changes in the cognitive function of older people (Eisele et al., 2012; Piccinin et al., 2012; Matthews et al., 2012; Yen et al., 2010). Furthermore, age and sex have been demonstrated to be significant risk factors for cognitive function (Piccinin et al., 2012; Matthews et al., 2012; Yen et al., 2010; Fernandez et al., 2008; Proust-Lima et al., 2008). The patterns and factors related to the cognitive function over time in different age and sex groups have not been compared thoroughly in the existing literature.
Previous studies have found factors related to cognitive impairment among older people. The incidence of cognitive impairment is related to being older, being female, and having a lower education level (Kawas et al., 2000; Miech et al., 2002; Shadlen et al., 2006; Sabia et al., 2009; Yen et al., 2010). Certain chronic diseases are associated with cognitive impairment, including diabetes, chronic kidney disease, vascular diseases, and stroke (Duron & Hanon, 2008; Etgen et al., 2012; Gorelick, 2005; Kilander et al., 1998; Mok et al., 2004; Muller et al., 2007; Okereke et al., 2008; Tzourio, 2007). Cognitive impairment is associated with frailty (Auyeung et al., 2011;
Boyle et al., 2010; Curcio et al., 2014; Faria et al., 2013; Han et al., 2014; Kilgour et al., 2014; Shimada et al., 2013; Samper Ternent et al., 2008). In addition, social ‐ support and social engagement have been found to influence cognitive function and dementia in old age (Zunzunegui et al., 2003), and social support may be a stronger protective predictor for women than for men (Baumeister & Sommer, 1997;
Fratiglioni et al., 2004).
In this study, we aimed to explore the cognitive function and the factors related across time by age and sex in older Taiwanese people. This study is expected to provide information about the factors related to the cognitive function in older adults in different groups and to enable the development of prevention/intervention
strategies.
METHODS
Data and samples
The data were from the “Taiwan Longitudinal Study of Aging (TLSA)”. The samples of the TLSA were drawn from the elderly population with multi-stage proportional probability sampling, initiated with a sample of 4049 older people aged 60 years or more in 1989. The samples were face-to-face interviewed from 1989 to 2007, every 3 or 4 years. Supplemental samples aged 50-66 years were added to the cohort in 1996 and in 2003. In this study, the data from 2003 and 2007 were used. Only those participants who completed both the 2003 and 2007 waves were included in the analysis. Overall, the sample size was 3,226 individuals.
Measures
Dependent variable
Cognitive function was measured by the Short Portable Mental Status Questionnaire (SPMSQ) (Pfeiffer, 1975) in both 2003 and 2007. There were only
eight items available in both waves, and the 8-item scale has been applied and validated (Purser et al., 2005; Yen et al., 2010). Thus, the 8 items as used as the measures of cognitive function. The questions included the following: what is your home address; what is today's date; what day is today; how old are you; what is your mother's surname; who is the current president and the last president; and subtract from 3 from 20 for a total of four consecutive times. Each item was scored as 0 or 1. If the item was answered as "unknown", the item was scored as 0. The scores ranged from 0 to 8. The scores in 2003 and 2007 were used as repeated measures of the outcome variable.
Independent variables
The independent variables included the fixed variables and the repeatedly measured variables. The fixed independent variables included age, sex, educational years, and frailty. Other independent variables (marital status, chronic diseases, physical function difficulties, social support, and social participation) were repeated measures in both waves.
1. Fixed variables:
The demographic variables included sex, age and educational years. The
definition of physical frailty referred to the study of Fried et al. (2001). Because some of the variables were unavailable in the data, proxy variables were used. (1) Weight loss: The unintentional loss of more than 10 pounds between 2003 and 2007. (2) Poor grip strength: To perform grasping objects with the fingers with any difficulty. (3) Exhaustion: Two items from the CES-D scale were used (Kohout et al., 1993), asking “I felt that everything I did was an effort” and “I could not get going” in the last week, giving a score of 0–3. Persons answering ‘2’ or ‘3’ to either question were categorized as frail. (4) Walking 200-300 meters with any difficulty. (5) Low physical activity:
Defined as not performing regular exercise. The respondents who exercised two times per week or less were coded as having low physical activity. The respondents who met three or more of the five criteria above were considered to be frail; those who met one or two criteria were considered pre-frail; and those with none of the criteria were considered non-frail.
2. Repeatedly measured variables:
Marital status was defined as having a spouse or not. Chronic diseases were selected from those related to higher cognitive impairment risks, including
hypertension, diabetes mellitus, heart disease, and stroke. The cumulative number of the four chronic diseases was used for analysis.
Physical function difficulty was assessed by the activities of daily living (ADLs), including following items: eating, clothing, transferring (getting up from a chair or from bed), using the toilet, taking a bath, and walking indoors. Each item was scored 0 to 3, ranging from no difficulty at all to unable to perform the activity. The physical function difficulty scores ranged from 0 to 18.
The respondent’s social support was assessed by measuring their received emotional support, received instrumental support, and provided information support. Emotional support was measured as the degree of received care from their family members, relatives, or friends. Each item was scored from 1 to 5, and the total scores ranged from 0 to 20. Higher scores indicated that more support was received.
Received instrumental support items were determined by asking “when you need someone to help, is there anyone who can help you or not” and were coded yes or no. Providing informational support was assessed by the questions “do you feel the help of your family is useful or not” and “do your family consult your opinion when they make decisions”. Each item was scored from 1 to 3, and the total scores ranged from 2
to 6.
Social participation included working status and participating in volunteer or social groups. Working status was coded as doing paid work, unpaid work, and no work. Social group participation was coded as yes/no, which was defined as
participating in any group of the following: volunteering in social services, religious group, union or occupational organization, social service or volunteer work, political group, community action or service group, clan association, and elderly club.
A
nalysis
Descriptive analysis and the generalized linear model of a time-linear function with normal distribution were applied for the analysis. The entire sample was first analyzed, and then the samples were stratified by age groups (aged less than 65 or more) and by sex and analyzed accordingly. The analysis was conducted using SPSS version 19.0 for Windows (IBM Inc, New York, Armonk).
RESULTS
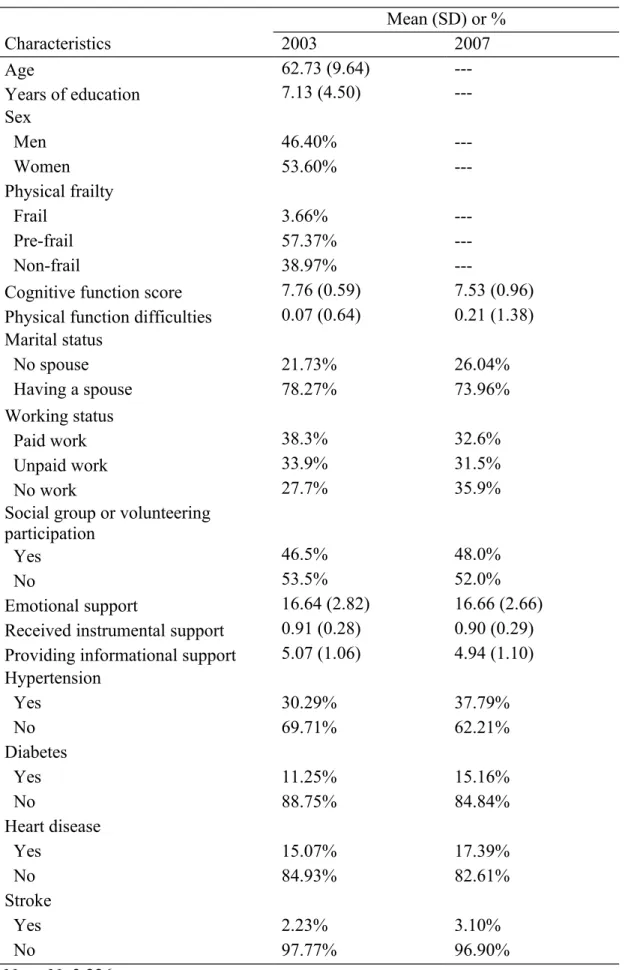
The descriptive data of the samples in the two waves are described in Table 1. The average of the cognitive function score reduced a little from 2003 (mean=7.76, SD=0.59) to 2007 (mean=7.53, SD=0.96). In fact, about 22.43% of the respondents declined, 68.46% of them remained constant, and 9.11% improved.
The results of the generalized linear model are shown in Table 2. The dependent variable was defined as the cognitive function scores in 2 waves. Model 1 indicates the results of the entire sample. The time slope was negative but not significant, indicating that the cognitive function did not reduce significantly across time. The factors related to higher cognitive function at the intercept included being younger (β= -0.009, p<0.001), male (β= 0.128, p<0.001), higher education (β= 0.025, p<0.001), and doing unpaid work (β=0.091, p<0.001). At the time slope, the age effect (β=
-0.002, p<0.01) and physical function difficulties (β= -0.028, p<0.001) would reduce the cognitive function across time, while education (β= 0.004, p<0.001) and providing informational support (β=0.023, p<0.001) would increase the cognitive function across time.
Because age and sex were significant to cognitive function, Model 2 shows the results of the age stratification, and Model 3 shows the results of the sex stratification. Model 2A shows the results of those younger who were aged less than 65 years old. The younger respondents who were male, having higher education, having a spouse, and providing more informational support at the intercept, were more likely to have higher cognitive function across time. Education and providing informational support even increase a little bit cognitive function across time. Model 2B shows the results of the older samples (aged 65 years old or more). For the older respondents, being younger, being male, having higher education, doing unpaid work at the intercept were more likely to have higher cognitive function; while having less physical function difficulties and providing more informational support at the time slope were more likely to increased higher cognitive function across time.
Model 3A and 3B are the results for the male and female respondents, respectively, For the male respondents, being younger, having higher education, participating in volunteering or social groups at the intercept were more likely to have higher cognitive function. At the time slope, age and physical function difficulties would reduce the cognitive function while providing informational support would increase it across time. Regarding to the female respondents, being younger, having higher education being non-frail, working on paid work or unpaid work, having less physical difficulties at the intercept would be related to higher cognitive function; while higher education, having less physical functional difficulties, and providing
informational support would be related to increased cognitive function over time. DISCUSSION
In this study, the cognitive function of two waves among the Taiwanese older people was examined, and the differences associated with age and sex were
compared. In general, being younger, males, having higher education, still working, having less physical function difficulties, and providing more informational support, were related to higher cognitive function. There were age- and sex- differences in the factors related to cognitive function.
Past studies have only found a relationship between physical function difficulty and cognitive impairment (Dodge et al., 2005; Fauth et al., 2013). Our study found the associations of physical function difficulties with cognitive function particularly for males and females, and particularly significant for the older group. The mechanism of cognitive function improvement may vary in different ages, or there may be
confounding factors related to age and sex with respect to cognitive function. Further research about the age effect on the improvement of cognitive function is suggested.
Providing more informational support was significant with cognitive function. Providing informational support or advice for their family/friends may increase the stimulation of cognitive function (Bassuk et al., 1999), and then shows a protective effect, particularly for the people with less social connection such as the older and female elderly. Another explanation is that the providing of informational support was concurrent with the cognitive function trajectory in the models, and thus, those who had better cognitive function were able to provide more informational support for their family/friends. When they received good feedback from the social network, their cognitive function would increase over time.
function found in previous studies (Hsu, 2007; Winningham & Pike, 2007; Zunzunegui et al., 2003) were also replicated in this study. However, the effect of working status and social participation showed different effects by age and gender. Doing paid or unpaid work was only significant for females, and doing unpaid work was significant for the older group only. Participating in volunteering/social groups was significantly beneficial only for the males but not significant for the females. The younger participants may still have had a job during the survey, but the older
participants may have retired. Thus, doing unpaid work (such as taking care of grandchildren or doing housework) still make the older people living actively, and further being beneficial for the cognitive function. The gender difference may be related to the gender inequality of the older cohorts in Taiwanese society. For the older cohorts of Taiwanese elderly, the females did not have an equal chance to obtain education or were not allowed to work, other than being housewives. Thus, for those females who were doing paid work must be the ones with higher socioeconomic status or having great working ability, and their cognitive function was more likely to be higher and maintained.
The relationship between physical frailty and cognitive function in the elderly was found in previous research (Curcio et al., 2014; Kilgour et al., 2014; Boyle et al., 2010; Buchman et al., 2007; Auyeung et al., 2011), but the effect of frailty only showed on females only in this study. One explanation was that frailty was an essential health problem for the female elderly in Taiwan. Another possible reason was that frailty was defined as the fixed variable in this study (due to weight loss was defined as the changes between these two waves), and the change of frailty was not measured. Another Taiwanese study has shown that cognitive function and frailty may concurrently associated, and previous frailty may also predict later cognitive
function decline (Hsu, 2014).
There are some limitations to this study. First, there were missing cases because of deaths or loss to follow-up. The missing cases may be relatively healthier, and thus, the conclusion of this study should be considered when transferred to other
populations. Second, only two waves of data were applied in this study. The longer longitudinal dynamics of cognitive function related to factors over the long-term were not examined. Third, only the SPMSQ scale was available for the measure of
cognitive function. The measure of cognitive function may not be comprehensive enough to measure different dimensions of cognitive function. A better measurement tool is suggested in future research.
The cognitive function of older adults may be dynamic, and the factors associated with its decline or improvement is different by age and by sex. As the population ages, the number of older people with cognitive impairment may increase rapidly in the future. Focusing on the effectiveness of preventive interventions to promote cognitive health for the older population is necessary. Different risks and health promotion strategies to target populations should be age- and gender-
sensitively developed. The older people and females should be encouraged to engage with social participation or work (whether paid or unpaid); the age-friendly
environment to active aging and life-long education should be constructed in the policy. The dynamic relationship of cognitive function and related factors are suggested be evaluated in future research.
References
Anttila, T., Helkala, E. L., Viitanen, M., Kareholt, I., Fratiglioni, L., Winblad, B., et al. (2004). Alcohol drinking in middle age and subsequent risk of mild cognitive impairment and dementia in old age: a prospective population based study.
British Medical Journal, 329(7465), 539. doi:10.1136/bmj.38181.418958.BE Auyeung, T. W., Lee, J. S., Kwok, T., & Woo, J. (2011). Physical frailty predicts
future cognitive decline - a four-year prospective study in 2737 cognitively normal older adults. The Journal of Nutrition, Health & Aging, 15(8), 690-694. doi:10.1007/s12603-011-0110-9
Bassuk, S. S., Glass, T. A., & Berkman, L. F. (1999). Social disengagement and incident cognitive decline in community-dwelling elderly persons. Annals of Internal Medicine, 131(3), 165-173. doi:10.7326/0003-4819-131-3-199908030-00002
Baumeister, R. F., & Sommer, K. L. (1997). What do men want? Gender differences and two spheres of belongingness: Comment on Cross and Madson (1997). Psychological Bulletin, 122(1), 38-44. doi:10.1037/0033-2909.122.1.38 Boyle, P. A., Buchman, A. S., Wilson, R. S., Leurgans, S. E., & Bennett, D. A.
(2010). Physical frailty is associated with incident mild cognitive impairment in community-based older persons. The American Geriatrics Society, 58(2), 248-255. doi:10.1111/j.1532-5415.2009.02671.x
Buchman, A. S., Boyle, P. A., Wilson, R. S., Tang, Y., & Bennett, D. A. (2007). Frailty is associated with incident Alzheimer’s disease and cognitive decline in the elderly. Psychosomatic Medicine, 69(5), 483-489. doi:10.1097/
psy.0b013e318068de1d
Burton, C., Campbell, P., Jordan, K., Strauss, V., & Mallen, C. (2013). The association of anxiety and depression with future dementia diagnosis: a case-control study in primary care. Family Practice, 30(1), 25-30.
doi:10.1093/fampra/cms044
BMC Geriatrics, 14:2. Available at: http://www.biomedcentral.com/1471-2318-14/2.
Dean, A., Kolody, B., & Wood, P. (1990). Effects of social support from various sources on depression in elderly persons. Journal of Health and Social Behavior, 31(2), 148-161. Retrieved from http://intl-hsb.sagepub.com/
Dodge, H. H., Kadowaki, T., Hayakawa, T., Yamakawa, M., Sekikawa, A., & Ueshima, H. (2005). Cognitive impairment as a strong predictor of incident disability in specific ADL-IADL tasks among community-dwelling elders: the Azuchi Study. The Gerontologist, 45(2), 222-230. doi:10.1093/geront/45.2.222 Duron, E., & Hanon, O. (2008). Hypertension, cognitive decline and dementia.
Archives of Cardiovascular Diseases, 101(3), 181-189. ISSN:1875-2136 Eisele, M., Zimmermann, T., Köhler, M.,, Wiese, B., Heser, K., Tebarth, F., et al.
(2012). Influence of social support on cognitive change and mortality in old age: results from the prospective multicenter cohort study AgeCoDe. BMC Geriatrics, 12(9), doi:10.1186/1471-2318-12-9
Etgen, T., Chonchol, M., Forstl, H., & Sander, D. (2012). Chronic kidney disease and cognitive impairment: a systematic review and meta-analysis. American Journal of Nephrology, 35(5), 474-482. doi: 10.1159/000338135
Etgen, T., Sander, D., Huntgeburth, U., Poppert, H., Forstl, H., & Bickel, H. (2010). Physical activity and incident cognitive impairment in elderly persons: the INVADE study. Archives of Internal Medicine, 170(2), 186.
doi:10.1001/archinternmed.2009.498.
Faria Cde, A., Lourenco, R. A., Ribeiro, P. C., & Lopes, C. S. (2013). [Cognitive performance and frailty in older adults clients of a private health care plan]. Rev Saude Publica, 47(5), 923-930.
Fauth, E. B., Schwartz, S., Tschanz, J. T., Ostbye, T., Corcoran, C., & Norton, M. C. (2013). Baseline disability in activities of daily living predicts dementia risk even after controlling for baseline global cognitive ability and depressive symptoms. International Journal of Geriatric Psychiatry, 28(6), 597-606. doi:
10.1002/gps.3865
Fernandez Martinez, M., Castro Flores, J., Perez de Las Heras, S., Mandaluniz Lekumberri, A., Gordejuela Menocal, M., & Zarranz Imirizaldu, J. J. (2008). Risk factors for dementia in the epidemiological study of Munguialde County (Basque Country-Spain). BMC Neurology, 8, 39. doi: 10.1186/1471-2377-8-39 Fratiglioni, L., Paillard-Borg, S., & Winblad, B. (2004). An active and socially
integrated lifestyle in late life might protect against dementia. The Lancet Neurology, 3(6), 343-353. doi:10.1016/S1474-4422(04)00767-7
Fratiglioni, L., Wang, H. X., Ericsson, K., Maytan, M., & Winblad, B. (2000). Influence of social network on occurrence of dementia: a community-based longitudinal study. The Lancet, 355(9212), 1315. doi: 10.1016/S0140-6736(00)02113-9
Fried, L. P., Tangen, C. M., Walston, J., Newman, A. B., Hirsch, C., Gottdiener, J., ... Burke, G. (2001). Frailty in older adults evidence for a phenotype. The Journals of Gerontology Series A: Biological Sciences and Medical Sciences, 56(3), 146-157. doi:10.1093/gerona/56.3.M146
Gorelick, P. B. (2005). William M. Feinberg Lecture: Cognitive vitality and the role of stroke and cardiovascular disease risk factors. Stroke, 36(4), 875-879. doi:10.1161/01.STR.0000158916.59742.7c
Han, E. S., Lee, Y., & Kim, J. (2014). Association of cognitive impairment with frailty in community-dwelling older adults. International Psychogeriatrics,
26(1), 155-163. doi: 10.1017/S1041610213001841
Hsu, H. (2007). Does social participation by the elderly reduce mortality and cognitive impairment? Aging & Mental Health, 11(6), 699-707.
doi:10.1080/13607860701366335
Hsu, H. C. (2014). Relationship between frailty and cognitive function among older adults in Taiwan. Journal of Frailty & Aging, 3(3), 153-157. Available at http://www.jfrailtyaging.com/all-issues.html?article=191.
Kawas, C., Gray, S., Brookmeyer, R., Fozard, J., & Zonderman, A. (2000). Age-specific incidence rates of Alzheimer’s disease The Baltimore Longitudinal Study of Aging. Neurology, 54(11), 2072-2077. doi:10.1212/WNL.54.11.2072 Kilander, L., Nyman, H., Boberg, M., Hansson, L., & Lithell, H. (1998). Hypertension
is related to cognitive impairment a 20-year follow-up of 999 men. Hypertension, 31(3), 780-786. doi:10.1161/01.HYP.31.3.780
Kilgour, A. H. M., Todd, O. M., Starr, J. M. (2014). A systematic review of the evidence that brain structure is related to muscle structure and their relationship to brain and muscle function in human over the life course. BMC Geriatrics, 14: 85. Available at http://www.biomedcentral.com/1471-2218-14-85.
Kohout, F. J., Berkman, L. F., Evans, D. A., & Cornoni-Huntley, J. (1993). Two shorter forms of the CES-D depression symptoms index. Journal of Aging and Health, 5(2), 179-193. doi:10.1177/089826439300500202
Loef, M., & Walach, H. (2013). Midlife obesity and dementia: Meta‐analysis and adjusted forecast of dementia prevalence in the united states and china. Obesity, 21(1), 51-55. doi: 10.1002/oby.20037
Matthews, F., Marioni, R., Brayne, C., Medical Research Council Cognitive Function and Ageing Study. (2012). Examining the influence of gender, education, social
class, and birth cohort on MMSE tracking over time: a population-based prospective cohort study. BMC Geriatrics, 12, 45.
http://www.biomedcentral.com/1471-218-12/45.
Miech, R., Breitner, J., Zandi, P., Khachaturian, A., Anthony, J., & Mayer, L. (2002). Incidence of AD may decline in the early 90s for men, later for women The Cache County study. Neurology, 58(2), 209-218. doi:10.1212/WNL.58.2.209 Mok, V. C., Wong, A., Lam, W. W., Fan, Y. H., Tang, W. K., Kwok, T., ... & Wong,
K. S. (2004). Cognitive impairment and functional outcome after stroke associated with small vessel disease. Journal of Neurology, Neurosurgery & Psychiatry, 75(4), 560-566. doi:10.1136/jnnp.2003.015107
Muller, M., Grobbee, D., Aleman, A., Bots, M., & Van Der Schouw, Y. (2007). Cardiovascular disease and cognitive performance in middle-aged and elderly men. Atherosclerosis, 190(1), 143-149.
doi:10.1016/j.atherosclerosis.2006.01.005
Okereke, O. I., Kang, J. H., Cook, N. R., Gaziano, J. M., Manson, J. A. E., Buring, J. E., & Grodstein, F. (2008). Type 2 Diabetes Mellitus and Cognitive Decline in Two Large Cohorts of Community‐Dwelling Older Adults. The American Geriatrics Society, 56(6), 1028-1036. doi:10.1111/j.1532-5415.2008.01686.x Pfeiffer, E. (1975). A short portable mental status questionnaire for the assessment of
organic brain deficit in elderly patients. The American Geriatrics Society, 23(10), 433-441. ISSN: 1532-5415
Piccinin, A. M., Muniz-Terrera, G., Clouston, S., Reynolds, C. A., Thorvaldsson, V., Deary, I. J., et al. (2012). Coordinated analysis of age, sex and education effects on change in MMSE scores. Journal of Gerontology: Series B Psychological Sciences and Social Sciences, 68(3), 374-390. doi: 10.1093/geronb/gbs077
Proust-Lima, C., Amieva, H., Letenneur, L., Orgogozo, J.-M., Jacqmin-Gadda, H., Dartigues, J.-F. (2008). Gender and education impact on brain aging: a general cognitive factor approach. Psychology and Aging, 23(3), 608-620.
Purser, J. L., Fillenbaum, G. G., Pieper, C. F., & Wallace, R. B. (2005). Mild Cognitive Impairment and 10‐Year Trajectories of Disability in the Iowa Established Populations for Epidemiologic Studies of the Elderly Cohort. The American Geriatrics Society, 53(11), 1966-1972.
doi:10.1111/j.1532-5415.2005.53566.x
Sabia, S., Nabi, H., Kivimaki, M., Shipley, M. J., Marmot, M. G., & Singh-Manoux, A. (2009). Health Behaviors From Early to Late Mid-life as Predictors of Cognitive Function. American Journal of Epidemiology, 170(4), 428-437. doi:10.1093/aje/kwp161
Samper‐Ternent, R., Al Snih, S., Raji, M. A., Markides, K. S., & Ottenbacher, K. J. (2008). Relationship between frailty and cognitive decline in older Mexican Americans. The American Geriatrics Society, 56(10), 1845-1852.
doi:10.1111/j.1532-5415.2008.01947.x
Shadlen, M. F., Siscovick, D., Fitzpatrick, A. L., Dulberg, C., Kuller, L. H., & Jackson, S. (2006). Education, Cognitive Test Scores, and Black‐White
Differences in Dementia Risk. The American Geriatrics Society, 54(6), 898-905. doi:10.1111/j.1532-5415.2006.00747.x
Shimada, H., Makizako, H., Doi, T., Yoshida, D., Tsutsumimoto, K., Anan, Y., Suzuki, T. (2013). Combined prevalence of frailty and mild cognitive
impairment in a population of elderly Japanese people. Journal of the American Medical Directors Association, 14(7), 518-524. doi:
Taylor, S. E., Klein, L. C., Lewis, B. P., Gruenewald, T. L., Gurung, R. A., & Updegraff, J. A. (2000). Biobehavioral responses to stress in females: tend-and-befriend, not fight-or-flight. Psychological Review, 107(3), 411-429. ISSN:0033-295X
Teixeira, C. V., Gobbi, L. T., Corazza, D. I., Stella, F., Costa, J. L., & Gobbi, S. (2012). Non-pharmacological interventions on cognitive functions in older people with mild cognitive impairment (MCI). Archives of Gerontology and Geriatrics, 54(1), 175-180. doi: 10.1016/j.archger.2011.02.014
Tzourio, C. (2007). Hypertension, cognitive decline, and dementia: an
epidemiological perspective. Dialogues in Clinical Neuroscience, 9(1), 61-70. ISSN: 1294-8322
Wang, C.-C., Lu, T.-H., Liao, W.-C., Yuan, S.-C., Kuo, P.-C., Chuang, H.-L., ... Yen, C.-H. (2010). Cigarette smoking and cognitive impairment: a 10-year cohort study in Taiwan. Archives of Gerontology and Geriatrics, 51(2), 143-148. doi:10.1016/j.archger.2009.09.041
Weimer, D. L., Sager, M. A. (2009). Early identification and treatment of Alzheimer’s disease: social and fiscal outcomes. Alzheimer’s & Dementia, 5(3), 215-226. doi: 10.1016/j.jalz.2009.01.028
Winningham, R. G., & Pike, N. L. (2007). A cognitive intervention to enhance institutionalized older adults' social support networks and decrease loneliness. Aging & Mental Health, 11(6), 716-721. doi:10.1080/13607860701366228 Yen, C. H., Yeh, C. J., Wang, C. C., Liao, W. C., Chen, S. C., Chen, C. C., Lee, S. H.
(2010). Determinants of cognitive impairment over time among the elderly in Taiwan: results of the national longitudinal study. Archives of Gerontology and Geriatrics, 50, 53-57. doi:10.1016/S0167-4943(10)70014-5
Zunzunegui, M. V., Alvarado, B. E., Del Ser, T., & Otero, A. (2003). Social networks, social integration, and social engagement determine cognitive decline in
community-dwelling Spanish older adults. The Journals of Gerontology Series B: Psychological Sciences and Social Sciences, 58(2), 93-100.
Table 1.Sample characteristics Mean (SD) or % Characteristics 2003 2007 Age 62.73 (9.64) ---Years of education 7.13 (4.50) ---Sex Men 46.40% ---Women 53.60% ---Physical frailty Frail 3.66% ---Pre-frail 57.37% ---Non-frail 38.97%
---Cognitive function score 7.76 (0.59) 7.53 (0.96) Physical function difficulties 0.07 (0.64) 0.21 (1.38) Marital status No spouse 21.73% 26.04% Having a spouse 78.27% 73.96% Working status Paid work 38.3% 32.6% Unpaid work 33.9% 31.5% No work 27.7% 35.9%
Social group or volunteering participation
Yes 46.5% 48.0%
No 53.5% 52.0%
Emotional support 16.64 (2.82) 16.66 (2.66)
Received instrumental support 0.91 (0.28) 0.90 (0.29) Providing informational support 5.07 (1.06) 4.94 (1.10) Hypertension Yes 30.29% 37.79% No 69.71% 62.21% Diabetes Yes 11.25% 15.16% No 88.75% 84.84% Heart disease Yes 15.07% 17.39% No 84.93% 82.61% Stroke Yes 2.23% 3.10% No 97.77% 96.90% Note: N=3,226.
Table 2. Trajectory of cognitive function among Taiwanese older people by generalized linear model, 2003-2007
Model 1 Model 2A Model 2B Model 3A Model 3B
Variable Total Samples Younger (age <65) Older (age>=65) Male Female
Intercept 7.895 (0.150)*** 7.598 (0.194)*** 8.501 (0.394)*** 8.065 (0.168)*** 7.778 (0.266)*** Age -0.009 (0.002)*** -0.002 (0.003) -0.018 (0.005)*** -0.008 (0.019)*** -0.009 (0.003)** Gender (male) 0.128 (0.030)*** 0.082 (0.027)** 0.168 (0.062)** --- --Years of education 0.025 (0.003)*** 0.016 (0.003)*** 0.038 (0.006)*** 0.014 (0.004)*** 0.038 (0.005)*** Frail -0.111 (0.068) -0.007 (0.075) -0.175 (0.117) <0.001 (0.087) -0.215 (0.102)* Pre-frail -0.020 (0.030) 0.008 (0.025) -0.089 (0.071) 0.011 (0.035) -0.047 (0.050)
Marital status (no spouse) 0.014 (0.034) -0.067 (0.034)* 0.050 (0.059) 0.029 (0.045) -0.021 (0.050) Working status (Paid work) 0.043 (0.038) 0.031 (0.036) 0.093 (0.084) 0.004 (0.040) 0.176 (0.077)* Working status (Unpaid work) 0.091 (0.036)* 0.029 (0.041) 0.132 (0.059)* 0.021 (0.044) 0.197 (0.064)** Social participation (yes) 0.028 (0.026) 0.016 (0.023) 0.051 (0.050) 0.059 (0.029)* -0.011 (0.043) Physical function difficulties -0.025 (0.020) -0.006 (0.023) -0.025 (0.032) 0.013 (0.023) -0.071 (0.035)* Received emotional support 0.003 (0.005) 0.005 (0.005) 0.005 (0.010) 0.003 (0.006) 0.005 (0.009) Received instrumental support -0.022 (0.048) -0.043 9).045) 0.021 (0.088) -0.002 (0.053) -0.041 (0.084) Providing informational supports 0.018 (0.015) 0.031 (0.015)* -0.008 (0.026) 0.011 (0.017) 0.016 (0.025) Chronic disease numbers 0.019 (0.016) -0.014 (0.015) 0.044 (0.027) 0.007 (0.018) 0.049 (0.026)
Time -0.091 (0.053) -0.051 (0.083) -0.102 (0.129) -0.020 (0.061) -0.163 (0.093)
Time * Age -0.002 (0.001)** -0.001 (0.001) -0.002 (0.002) -0.002 (0.001)** -0.001 (0.001)
Time * Gender (male) 0.020 (0.0110 0.010 (0.010) 0.016 (0.021) ---
---Time * Years of education 0.004 (0.001)** 0.004 (0.001)*** 0.003 (0.002) 0.001 (0.001) 0.006 (0.002)**
Time * Frail 0.014 (0.024) 0.025 (0.028) 0.034 (0.039) -0.035 (0.030) 0.042 (0.036)
Time * Martial status 0.000 (0.012) 0.001 (0.012) -0.005 (0.020) -0.005 (0.015) 0.001 (0.018) Time * Working status (paid
work)
0.004 (0.013) 0.004 (0.013) -0.003 (0.028) 0.005 (0.014) -0.001 (0.027) Time * Working status (unpaid
work)
0.020 (0.013) 0.009 (0.015) 0.017 (0.020) 0.016 (0.016) 0.008 (0.022) Time * Social participation (yes) 0.014 (0.009) 0.001 (0.009) 0.021 (0.017) 0.003 (0.010) 0.022 (0.015) Time * Physical function
difficulties
-0.028 (0.056)*** 0.005 (0.007) -0.031 (0.009)*** -0.015 (0.007)* -0.031 (0.009)** Time * Received emotional
support 0.001 (0.019) 0.001 (0.002) 0.002 (0.003) <0.001 (0.002) 0.003 (0.003)
Time * Received instrumental support
-0.020 (0.017) 0.008 (0.016) -0.048 (0.030) -0.024 ().018) -0.011 (0.029) Time * Providing informational
support
0.023 (0.005)*** 0.011 (0.005)* 0.033 (0.009)*** 0.025 (0.006)*** 0.022 (0.008)* Time * Chronic disease numbers -0.004 (0.005) -0.007 (0.006) -0.008 (0.009) 0.004 (0.006) -0.015 (0.009)
AIC 14014.997 5017.280 7777.704 6339.035 7271.953
BIC 14224.615 5208.238 7963.402 6517.323 7446.080
Note: *p<0.05; **p<0.01; ***p<0.001. The reference group of the dependent variables was scores of cognitive function (SPMSQ scale). The reference group of the independent variables included: sex (female), marital status (having a spouse), working status (no), participation in volunteering or social groups (no), frailty (non-frail), The number of chronic diseases (include: hypertension, diabetes, heart disease and stroke).