Taipei Medical University.
F
emale
h
emodialysis
p
atients
h
ave
p
oor
d
ietary
e
nergy
a
nd
p
rotein
i
ntake
o
n
w
eekend
Pei‐Yu Wu, Su‐Han Yang, Wan‐Chen Lin、Shwu‐Huey Yang
School of Nutrition and Health Sciences, Taipei Medical University
I
ntroduction
O
bejective
Hemodialysis patients with malnutrition have significantly higher morbidity and mortality. The major cause of malnutrition is inadequate dietary intake. Burrowes and his colleagues demonstrate that hemodialysis patients’ dietary intake are difference between dialysis treatment days and non-dialysis treatment days. However, there is no paper mentioned about the difference among weekend and dialysis treatment days or non-dialysis treatment days.
To evaluate the dietary energy intake and protein intake between male and female hemodialysis patients among dialysis treatment days, non-dialysis treatment days and weekend.
M
ethods
Ninety-five adults who received hemodialysis treatment for at least 3 months were recruited. All subjects were from Taipei Medical University Hospital or Wanfang Hospital. The demographic information, dry body weight, serum albumin, Kt/V and 3-day dietary record were collected from Apr. 2010 to Dec.2010. Geriatric nutritional risk index (GNRI)was used as nutritional parameter. We analyzed the dietary energy and protein intake and compared with K/DOQI guideline.
R
esults and Discussion
Very fewer female subjects had adequate dietary intake on weekend than dialysis day and non-dialysis day. Too much fluid adherence for hemodialysis subjects may contribute to poor dietary intake on weekend. Zabel and his colleagues proposed that male hemodialysis patients have better appetite than female dialysis patients.
C
onclusion
Our study revealed that female hemodialysis patients had poor dietary intake during the weekend and much lower than K/DOQI’s recommendation. We suggest that female hemodialysis patients may need more
intervention on their dietary intake to prevent worst prognosis.
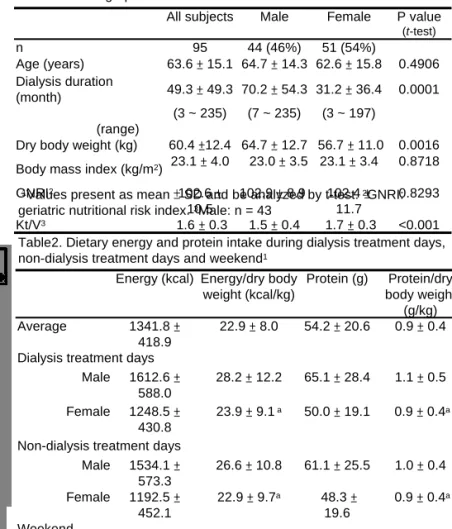
Table 1. Demographic and nutrition status data1
All subjects Male Female P value
(t-test) n 95 44 (46%) 51 (54%) Age (years) 63.6 ± 15.1 64.7 ± 14.3 62.6 ± 15.8 0.4906 Dialysis duration (month) 49.3 ± 49.3 70.2 ± 54.3 31.2 ± 36.4 0.0001 (range) (3 ~ 235) (7 ~ 235) (3 ~ 197)
Dry body weight (kg) 60.4 ±12.4 64.7 ± 12.7 56.7 ± 11.0 0.0016 Body mass index (kg/m2) 23.1 ± 4.0 23.0 ± 3.5 23.1 ± 3.4 0.8718
GNRI2 102.6 ± 10.5 102.9 ± 8.9 102.4 ± 11.7 0.8293 Kt/V3 1.6 ± 0.3 1.5 ± 0.4 1.7 ± 0.3 <0.001
1Values present as mean ± SD and be analyzed by t-test. 2GNRI:
geriatric nutritional risk index. 3Male: n = 43
Table2. Dietary energy and protein intake during dialysis treatment days, non-dialysis treatment days and weekend1
Energy (kcal) Energy/dry body weight (kcal/kg) Protein (g) Protein/dry body weight (g/kg) Average 1341.8 ± 418.9 22.9 ± 8.0 54.2 ± 20.6 0.9 ± 0.4 Dialysis treatment days
Male 1612.6 ± 588.0 28.2 ± 12.2 65.1 ± 28.4 1.1 ± 0.5 Female 1248.5 ± 430.8 23.9 ± 9.1a 50.0 ± 19.1 0.9 ± 0.4a
Non-dialysis treatment days Male 1534.1 ± 573.3 26.6 ± 10.8 61.1 ± 25.5 1.0 ± 0.4 Female 1192.5 ± 452.1 22.9 ± 9.7a 48.3 ± 19.6 0.9 ± 0.4a Weekend Male 1430.7 ± 529.7 24.6 ± 9.4 60.4 ± 27.3 1.0 ± 0.5 Female 1100.4 ± 328.7 21.0 ± 7.4b 43.4 ± 14.8 0.8 ± 0.3b 1Values present as mean ± SD. a, bValues with different superscripts are
significantly different at p < 0.05 by one-way repeated measures ANOVA.