Three-dimensional simulation of vertical zone-melting
crystal growth: symmetry breaking to multiple states
C.W. Lan*, M.C. Liang
Chemical Engineering Department, National Taiwan University, Taipei 10617, Taiwan, ROC Received 20 April 1999; accepted 16 August 1999
Communicated by D.T.J. Hurle
Abstract
For the "rst time three dimensional simulation is conducted for vertical zone-melting crystal growth, simultaneously considering the time-dependent #uid #ow, heat transfer, and moving interfaces. The numerical method is based on an e$cient "nite-volume method with front tracking. The growth of 2-cm diameter GaAs in a quartz ampoule is used as an example. Under an axisymmetric operation, the two-dimensional solution can bifurcate subcritically to three-dimen-sional ones as the convection or superheating increases. The three-dimenthree-dimen-sional modes, which can have either one- or two-fold symmetry, depend on the equilibrium aspect ratio of the molten zone. Under normal gravity, the axisymmeric mode exists only for low superheating. Furthermore, the multiple states, including other multi-fold modes, are path dependent, which are further illustrated though the dynamics of heating and cooling operations. ( 2000 Elsevier Science B.V. All rights reserved.
PACS: 44.25.#f; 47.27.Te; 81.10.Fq; 02.60.Cb; 02.70.Fj
Keywords: 3D simulation; Zone-melting; Bifurcation; Interface; Buoyancy convection; Multiple states; Dynamics
1. Introduction
The vertical zone-melting (VZM) crystal growth is an important process for both crystal growth and puri"cation [1}4]. There are several advantages of using such a technique for crystal growth. In addi-tion to in situ puri"caaddi-tion, the convex growth front can be easily obtained by adjusting the zone length. The zone-leveling of the dopant also minimizes the axial segregation. However, because of the radial
* Corresponding author. Fax: #886-2-23633917. E-mail address: [email protected] (C.W. Lan)
zone heating, the thermal convection induced is strong, and the growth interface can be signi"cantly a!ected [5,6]. To understand the role of heat #ow on the growth, numerical simulation is usually ad-opted, and it has been proved useful in growth control, especially in the control of the zone shape and segregation [7]. However, the complexity of the process is introduced not only by the stronger convection, but also by nonlinear bifurcations, both the multiplicity and the unsteadiness. The most typical bifurcation for VZM is symmetry breaking, which is the transition from an axisym-metric mode to three-dimensional (3D) ones. As the bifurcation is encountered, in addition to the
0022-0248/00/$ - see front matter ( 2000 Elsevier Science B.V. All rights reserved. PII: S 0 0 2 2 - 0 2 4 8 ( 9 9 ) 0 0 4 5 5 - 8
dramatic changes of the heat #ow, mixing, and the growth interface, the operational uncertainty dur-ing crystal growth is one of the key issues. It is particularly important if the bifurcation is subcriti-cal which may cause catastrophic runaway during a steady growth. Unfortunately, very little study has been devoted to this subject [8,9].
There are several two-dimensional (2D) models being developed for VZM crystal growth (e.g., Refs. [5}8]). Time-dependent calculations including #uid #ow, heat and mass transfer, and the moving inter-faces have also been conducted recently [7,8]. Al-though the 2D models give useful information on the growth control and design, they are still not adequate. Very often, 3D #ows and heat transfer can be induced as the driving force for convection, which is often characterized by the Rayleigh num-ber (RaT), large enough, even though the system arrangement and the heating are perfectly axisym-metric [9]. Neumann [10] and Baumgartl et al. [11] showed that the symmetry breaking occurred supercritically from an axisymmetric mode (the so-called m0 mode) to a 3D one-fold mode (m1 mode). Time-dependent #ows were also observed at higher RaT. However, their studies were based on an over-simpli"ed model, where the deformable inter-faces and the ampoule were ignored. A parabolic temperature pro"le was imposed at the melt sur-face. The bifurcation structure of the problem was not clear as well. In fact, it is believed that the interfaces can have signi"cant e!ects on the stabil-ity and the bifurcation structure during solidi"-cation, and several examples have been illustrated [12,13]. In reality, the zone shape as well as the zone length also changes with the heating power and other thermal conditions. To model the system in a self-consistent manner, a full 3D model includ-ing the free interfaces and the ampoule is necessary. Unfortunately, no such model for VZM has been reported.
In the present study, a "nite volume method (FVM) with a front tracking technique is developed to study the bifurcation and dynamics of the VZM growth of 2-cm GaAs in a quartz ampoule. In addition to the primary bifurcation from the modes
m0 to m1 or m2 (two-fold symmetry), secondary
bifurcation from m2 to m1 will be illustrated. Some interesting transition during heating and cooling
are further discussed. Although inherent time-de-pendent #ows are also important, we will not pay much attention to them in this report. We shall discuss them elsewhere. In the next section, the mathematical model and numerical solution are described. Section 3 is devoted to results and dis-cussion, where detailed benchmark comparison will be performed. Brief conclusions are drawn in Section 4.
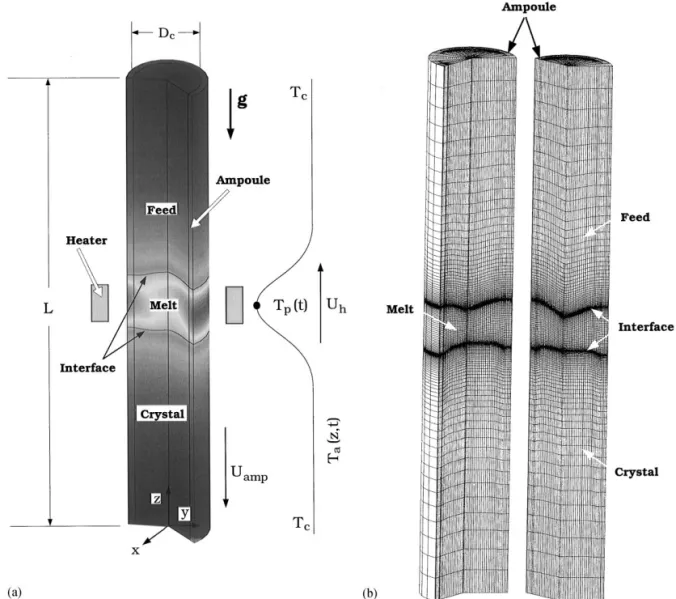
2. Model description and numerical solution A generic VZM crystal growth system is illus-trated in Fig. 1(a). Since axisymmetry is no longer assumed here, the system is described by a Car-tesian coordinate (x, y, z). The zone heater is de-scribed by an e!ective heating pro"le ¹!(z, t), which is kept axisymmetric in this study. The ampoule pulling speed ;!.1 and the heater moving speed ;) can be given independently. The #ow and tem-perature "elds as well as the melt/feed (h&(x, y, z, t)) and melt/crystal (h#(x,y, z, t)) interfaces are also represented in the Cartesian coordinate.
The dimensionless variables are de"ned by scal-ing length with the crystal diameter D#, time with
D2#/a., velocity with a./D#, pressure with o.a2./D2#,
and temperature with the melting point ¹., where a. is the thermal di!usivity and o. the melt den-sity. The time-dependent governing equations de-scribing the convection and heat transport in the melt (m) are as follows:
+ ) *"0, (1)
R*/Rq#* ) +*"!+P#Pr+2*!PrRaT(h!1)e', (2) Rh/Rq#* ) +h"+2h, (3) where q, *, P, and h are the dimensionless time, velocity, pressure, and temperature, respectively. Pr is the Prandtl number. The gravity direction e' the unit vector of gravity, which is aligned with the growth axis in this study. ¹. also serves as a reference temperature. The associated dimension-less number RaT in the source term of the mo-mentum equation is the thermal Rayleigh number,
Fig. 1. (a) Schematic sketch of vertical zone-melting (VZM) crystal growth; (b) a sample mesh for calculation using "nite volume method.
de"ned as follows: RaT,gbT¹.D3#a.l. ,
where g is the gravitational acceleration, bT the thermal expansion coe$cients, and l. is the kinematic viscosity.
In the crystal (c), the feed (f), and the ampoule (a), only heat transfer needs to be considered:
Rh/Rq!v!.1ez ) +h"i8i+2h, (i"c, f, a), (4)
where i8,ai/a. is the dimensionless thermal di!usivity of feed, crystal or ampoule; ai is the thermal di!usivity of the feed (i"f ) or the crystal (i"c).
The no-slip condition is used for the velocity on solid boundaries:
*"!ccv!.1ez, (5)
where c#,o#/o. and v!.1 is the dimensionless ampoule pulling speed.
The thermal boundary conditions at the melt/ solid interfaces are set by the heat #ux balances: n )+hD.!n)i#+hD##(v!.1#dh#/dq)St(n)ez)"0,
(6) n )+hDm!n)i&+hD&#(v!.1#dh&/dq)St(n)ez)"0,
(7) where n is the unit normal vector at the feed or growth interfaces pointing to the melt and ii,ki/km the ratio of the thermal conductivity of phase i to the melt (i"f, c); k. is the thermal conductivity of the melt. The Stefan number St,*H/Cp.¹. scales the heat of fusion (*H) released during solidi"cation to the sensible heat in the melt; Cp. is the speci"c heat of the melt.
The heat exchange between the ampoule and the furnace is by both radiation and convection ac-cording to the energy balance along the ampoule surface,
!n ) i!+hD!"Bi(h!h!)#Rad(h4!h4!), (8) where n is the unit normal vector on the ampoule surface pointing outwards, Bi,hD#/k. the Biot number, and Rad,pe!¹3.D#/k. the Radiation number;p is the Stefan Boltzmann constant, while e! is the surface emissivity of the ampoule. For simplicity, the e!ective heater temperature h! is assumed to be a Gaussian distribution:
h!(z,t)"h!=#(h1!h!=)exp(![(z!z1)/a]2), (9) where, h!= and h1 are the dimensionless ambient background and peak temperatures, respectively, and a is related to the width of distribution. In the present study, all the boundary and heating condi-tions are axisymmetric.
The above governing equations and their asso-ciated boundary conditions can only be solved nu-merically. We have developed e$cient FVM schemes using the primitive variable formulation [14] and multigrid acceleration [15] for the free or moving boundary problem. For time-dependent calculations, a fully implicit Euler scheme [16] is used for the time-derivative terms. A sample con-verged mesh for calculation is shown in Fig. 1(b). As shown, "ner grid spacing is placed near the interfa-ces to enhance the accuracy of calculation. Detailed
description of the numerical method can be found elsewhere [14,15].
3. Results and discussion
Before presenting the results, we have performed extensive benchmark comparisons with previous works for both a simpli"ed 3D model and a full 2D model. For the simpli"ed 3D model, the feed and growth fronts are assumed #at and "xed. The am-poule is also removed, while a parabolic temper-ature pro"le is speci"ed along the melt surface. For RaHT"2]105, we have obtained a pseudo-steady 3D solution, as shown in Fig. 2(a), where the axisymmetric solution is not possible. For com-parison purposes, in this case the de"nition of the Rayleigh number is somewhat di!erent, i.e., RaHT,(2gbT(¹.!9!¹.)D3#)/a.l., where the max-imum temperature di!erence (¹.!9!¹.) is used. As shown, our result is in good agreement with that obtained by Baumgartl et al. [11] and by a com-mercial CFD code, Fluent [17]. Good agreement with the Fluent's result is also obtained for RaHT" 4]105, as shown in Fig. 2(b). However, for both cases, the calculated results are not stable. Time-dependent calculations are further performed for both cases with "nite disturbances using our code and Fluent, but the oscillations are not regular. Time-dependent results are found for RaHT'35,000 for the asymmetric m0 mode and Ra*
T'2]105 for the m1 mode, which agree reasonable well with previous calculations [11]. It should be pointed out that the Hopf bifurcation, where the #ow starts to oscillate, strongly depends on the thermal bound-ary conditions. Therefore, the onset of the unsteadi-ness at RaHT"35,000 is not universal.
The comparison with the full 2D model [7,8], which uses the stream function/vorticity formula-tion, is possible if the axisymmetric solution is stable. Therefore, calculations are then performed for both high (¹1"16003C) and low superheatings (¹1"15003C). However, for high superheating, the axisymmetric solution exists only for low grav-ity. For example, at 0.1 g, we obtain an axisymmet-ric solution, as shown in Fig. 3(a); RaHT+9]104. As shown, the result is in good agreement with the 2D one for both the interface shapes and isotherms.
Fig. 2. Comparison of the simpli"ed 3D model (a) RaT" 2]105; (b) RaHT"4]105.
Fig. 3. Comparison of the 2D full model: (a) high superheating (0.1 g); (b) low superheating (normal gravity).
For the convenience of illustration, the ampoule is not shown here. However, one may use Fig. 1(a) to get a whole picture of simulation.
For lower superheating (RaHT+4.5]105), an axisymmetric solutions can be stable under normal gravity. Again, the axisymmetric solution we ob-tained is compared with the 2D result. As shown
in Fig. 3(b), again, the agreement is reasonably good. Due to the lower superheating in the melt, the discrepancy seems to be slightly larger than the previous one. Nevertheless, from numerical
Table 1
Physical properties and some input parameters [9] GaAs o#"o&"5.7 g cm~3 o."5.7 g cm~3 ¹."12383C *H"726 J g~1 h"1.6]10~2 W cm~23C~1 k#"k&"0.07 W cm~1 3C~1 k."0.14 W cm~1 3C~1 Cp#"Cp&"Cp. "0.42 J g~1 3C~1 bT"1.16]10~4 K~1 Quartz (ampoule) o!"2.2 g cm~3 k!"0.035 W cm~1 3C~1 Cp!"0.188 J g~1 3C~1 e!"0.8
Other input parameters ¸"15 cm
D#"2 cm D!"2.4 cm
¹1"heating).16003C (for high superheating); 15003C (for low super-¹!="3003C
a&"a#"1.8 cm (for high superheating); 2.0 cm (for low super-heating)
z10"7.5 cm
;)"0 cm/h (for fully transient calculations) Dimensionless groups
Pr"0.059; RaT"gbT¹.D3#/(a.l.)"0&6.9]106;
RaHT"2gbT*¹D3#/(a.l.)"0&9.133]105 (for *¹"¹.!9! ¹."1003C)
simulation point of view, both codes give consistent results, even though their formulations and code implementation are very di!erent.
For numerical simulation, the mesh may also a!ect the result. To balance CPU time and accuracy, we have adopted the mesh similar to Fig. 1(b) for all calculations here. Such a mesh (34]24]146"nite volumes, in the r, h, and z directions, respectively) leads to 223,968 equations. In this study, all compu-tations are performed in an HP/C180 workstation or a Pentium II/450MHz PC, and one steady-state calculation takes about 2 h of CPU time.
After building the con"dence through the code veri"cation, we are ready to study the process in detail. Following the results from the previous 2D benchmarks, in the following sections, we will con-struct the bifurcation diagrams for both examples
to illustrate their symmetric breaking and possible multiple states. The physical properties and input parameters used in the computation are listed in Table 1.
3.1. High superheating * ewects of convection
The "rst case is conducted for the high super-heating at ¹1"16003C; the supersuper-heating in the melt is about 1003C for 0 g and about 803C for 1 g. The high superheating condition is generated through a sharper heating pro"le (with a smaller a and a larger ¹1). As mentioned for Fig. 2(a), with such a high superheating, the axisymmetric solu-tion is not possible at normal gravity. Therefore, to illustrate the loss of axisymmetry (or symmetry breaking), solution tracking is performed by using the gravity as the continuation parameter. Also, to better examine symmetry breaking, the zone length di!erence and the maximum surface temperature di!erence (at the melt/ampoule interface) are ad-opted. These values are zero if the axisymmetry is retained. The bifurcation diagram using the zone length di!erence as a function of gravity is shown in Fig. 4(a), while using the temperature di!erence is shown in Fig. 4(b). As shown, both "gures show a typical subcritical bifurcation from the 2D axisymmetric mode (m0) to the 3D m1 mode. In this case, the 2D result can be obtained only for smaller
g or weaker convection (up to 0.18 g). As the
#ow becomes 3D, signi"cant nonuniformity in the zone length and the surface temperature ap-pears. As shown in Fig. 4(a), the maximum zone length di!erence is up to 2 mm. Meanwhile, the temperature di!erence is up to 223C in Fig. 4(b). After the maximum temperature di!erence reaches its maximum value, it decreases with the increasing gravity level due to the better heat transfer in the zone.
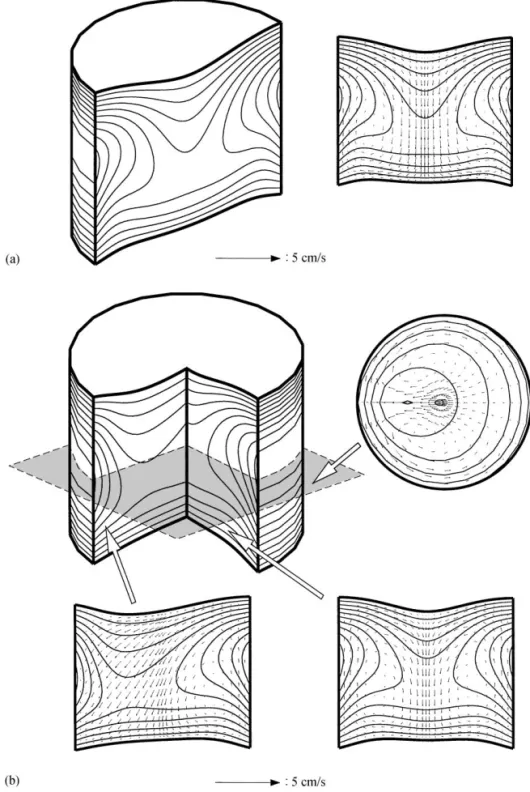
There is a range of gravity where multiple solu-tions exist. For example, at 0.1 g, both solusolu-tions a and b are stable, as illustrated in Fig. 5(a) and (b), respectively. The solution in Fig. 5(a) is axisymmet-ric, which is the same as the one shown in Fig. 3(a) for the comparison with the result obtained by the 2D stream function/vorticity model. For the 3D solution in Fig. 5(b), the isotherms and velocity "elds at di!erent planes are shown. For the 3D
Fig. 4. Bifurcation diagrams of high superheating using the gravity level as the parameter: (a) zone length deviation; (b) surface temperature deviation. The black dots (v) indicate the maximum values of oscillations.
#ow, an easy way to examine its symmetry is from the "eld plot at the plane of z"¸/2, as shown on the upper right of Fig. 5(b). As shown, the minimum temperature moves to the left. Also, two #ow cells can be seen. One major #ow roll is developed in the lower left "eld plot. During simulation, we have no control of the direction for the 3D #ow to develop. Therefore, after the result is obtained, we have to examine the mid-plane isotherms in order to decide which plane to illustrate the result, as the example shown in the bottom of Fig. 5(b). Furthermore, because the #ow in the m1 mode is less restricted, as
compared with m0, its convection is stronger. Heat transfer is enhanced slightly as well. This can be further illustrated by the normalized heat #ux at the growth interface (based on the conduction mode at 0g). This value is 1.1355 for the m0 mode and 1.1364 for the m1 mode. Interestingly, beside the most asymmetric plane, the plane with symmetric thermal and velocity "elds, shown on the lower right of Fig. 5(b), is quite similar to the 2D solution in Fig. 5(a). The subcritical nature of the bifurcation shown in Fig. 4 is particularly important in practice. One can imagine that as the operation condition passes the subcritical point (at about 0.18 g), a dramatic change in the #ow and heat transfer may occur, because the stable m1 solution (say at 0.18 g) is quite far away from the unstable symmetric mode
m0. On the other hand, as the driving force is
reduced (decreasing g or RaT) from the top branch, a sudden loss of the m1 mode occurs at the turning point as well (at about 0.08 g ). Such an uncertainty appears physically and thus makes the control of the process di$cult. Furthermore, as g or RaT is further increased, we also "nd a Hopf point, where the #ow starts to oscillate, at about 0.26 g (RaHT"2.23]105). The oscillation of the zone length has a period of 450 s at 0.3 g; the period decreases to 88 s at 1 g ( RaHT"7.36]105). Interest-ingly, the Hopf point for this case is only slightly larger than the previous reported value (about 1.9]105) [11] using a simpli"ed model. On the other hand, we have examined a similar "xed zone [18] using an uniform ambient temperature at 1711}1911 K by Fluent, where the heat transfer is from convection and radiation. Interestingly, the #ow is stable up to RaHT"9]105. Clearly, the Hopf point strongly depends on the thermal boundary conditions for this case.
3.2. Low superheating * ewects of heater temperature
In practice, the superheating in the melt can be controlled by the heater. As shown previously, un-der normal gravity, the 2D axisymmetric mode can be stable only for low superheating (for example at ¹1"15003C for Fig. 3(b)). Therefore, it is thus worthwhile to continue studying this case (about 423C superheating or RaHT"3.84]105) for normal
Fig. 5. A sample of multiple solutions at 0.1 g from Fig. 4: (a) 2D solution; (b) 3D solution.
gravity. Meanwhile, the bifurcation behavior can be studied by tracking solutions using the peak heater temperature ¹1, which is similar to the heat-ing power or the superheatheat-ing, as the parameter.
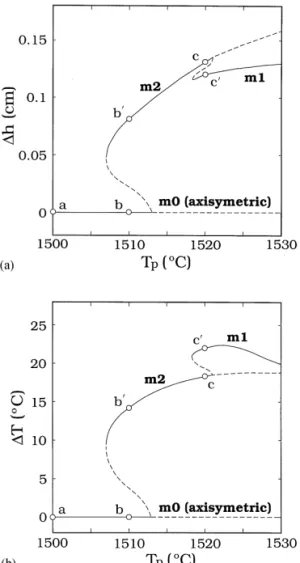
The bifurcation diagrams for zone length and sur-face temperature di!erences are illustrated in Figs. 6(a) and (b) respectively. Some "eld plots indicated in Fig. 6 are further illustrated in Fig. 7.
Fig. 6. Bifurcation diagrams of low superheating: (a) zone length deviation; (b) surface temperature deviation.
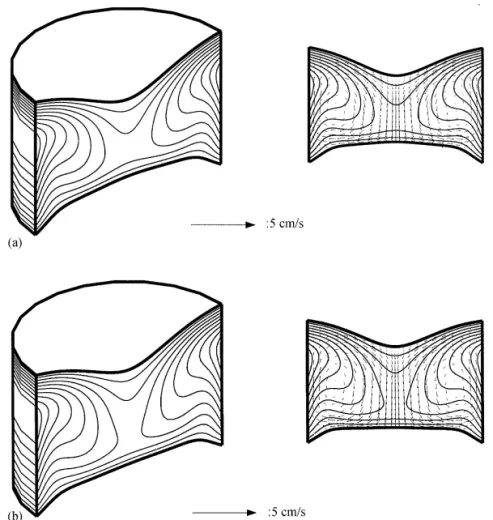
First, we start the solution at ¹1"15003C, as shown in Figs. 6 and 7(a) (also Fig. 3(b)), the solu-tion is axisymmetric and stable. Further increasing the heater temperature, again, we observe a sub-critical bifurcation at about ¹1"15133C. How-ever, the new mode that bifurcates from the m0 mode is an m2 mode instead of an m1 mode. Two stable solutions b and b@ at ¹1"15103C are shown in Figs. 7(b) and (b@), respectively. The m2 mode b@ has a two-fold symmetry, which can be clearly seen from the cut of the isotherms at z"¸/2. Therefore, two symmetric isotherms and #ow "elds can be obtained by cutting the zone properly. As shown at the bottom of Fig. 7(b@), although they are both
symmetric with respect to the centerline, the results are quite di!erent. By comparing the interface shapes from the two cuts, one may also get a 3D view of the interface shapes.
Further increasing the heater temperature, as shown in Fig. 6, we encounter a secondary bifurca-tion, and the m2 mode becomes unstable. The new mode branching from m2 is the m1 mode again. This bifurcation is subcritical as well. Two stable solutions c and c@ are further illustrated in Figs. 7(c) and (c@), respectively. As shown, because of the lower superheating, for the m1 mode, the deforma-tion of the zone is much more signi"cant than that with a higher superheating (e.g., Fig. 5(b)).
It is believed that the existence of the m2 mode at lower ¹1 is due to the much smaller aspect ratio of the molten zone. As the zone length is increased by increasing heating power, the m1 mode becomes dominant. Furthermore, the subcriticallity is due to the existence of the deformable interfaces. The bi-furcation becomes supercritical if we "x the interfa-ces. Such an observation is similar to that in the two-phase Rayleigh Benard problems [12,13]. Again, although RaHT is up to 5.78]105 (*¹ "
63.333C) for the m1 mode at ¹1"15303C, the solution is still stable.
3.3. Dynamics due to heating and cooling
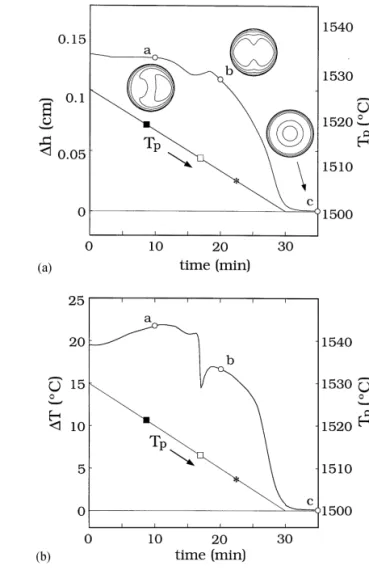
The subcritical nature discussed above is parti-cularly important in practice. As one operates the system across the subcritical point or the turning point, a dramatic change of the solution may occur. Owing to the hystersis of the subcriticallity, the steady state of a set point is thus path dependent. To illustrate the signi"cance of the bifurcation and multiple states, we also conduct time-dependent calculations for both heating and cooling situ-ations. Again, the previous case with a lower super-heating is used for illustration.
Fig. 8 shows the dynamic response of the heating by increasing ¹1 with a rate of 603C/h from 15003C to 15303C. The bifurcation and turning points are indicated by the squares and asterisk, respectively. The time evolution of the zone length nonuniform-ity is shown in Fig. 8(a), and the temperature di!er-ence in Fig. 8(b). As shown, when the "rst bifurcation point is passed, the 3D #ow starts to
Fig. 7. Some solutions of Fig. 6: (a) 2D solution at ¹1"15003C; (b) 2D solution at ¹1"15103C; (b@) 3D m0 solution at ¹1"15103C; (c) 3D m2 solution at ¹1"15203C; (c@) 3D m1 solution at ¹1"15203C.
develop, but with some delay. Interestingly, multi-cell structures are found during the transition. For example, the six-fold cell at b is a typical transition for the solution from m0 to m2. After the transition, there is a dramatic change to m2. At t"30 min, the #ow is still m2, even though the secondary bifurca-tion has passed. Apparently, such a delay allows the
m2 mode to appear and stay a bit longer before the
"nal transition to the stable m1 mode. As shown, if we wait a bit longer, the m1 mode appears, and it is stable according to the stationary bifurcation dia-gram shown in Fig. 5(a). As compared with the transition from m0 to m2, the transition from m2 to
m1 is less dramatic due to the smaller di!erence on
the #ow structure. However, since both transitions
are subcritical, their transitions are not smooth at all. Particularly, there are some temperature #uctu-ations during transitions in Fig. 8(b). Parts of the #uctuations are due to the sampling error of the maximum temperature at the cell center of the zone surface, where no interpolation is used.
The dynamics for cooling, as shown in Fig. 9, are similar to that for heating, but the transition is much smoother. Still, as the turning point is passed, there is a dramatic change on the zone length and surface temperature di!erences. However, it should be pointed out that the "nal solution is path-depen-dent. For example, if we stop the "nal temperature at the region where two stable solutions exist, e.g., ¹1"15103C, the "nal stable solution will be m0
Fig. 7. (continued)
for heating (as a in Fig. 8) and m2 for cooling (as b in Fig. 9). In other words, di!erent heating paths may lead to di!erent steady solutions.
4. Conclusions
A three-dimensional time-dependent "nite-vol-ume method with front tracking for the moving interfaces is developed for VZM crystal growth. The nonlinear phenomena in VZM, including both symmetry breaking and multiple states, are investi-gated. With a higher superheating, the axisymmet-ric solution is not stable under normal gravity. To operate a stable axisymmetric mode, a lower super-heating and a shorter zone are necessary. However, with the increasing superheating and zone length, the "rst symmetric breaking is subcritical and the branching mode has a two-fold symmetry at its midplane (an m2 mode). With the increasing super-heating or zone length, the m1 mode can be
ob-tained after the secondary subcritical bifurcation from the m2 mode. Between the turning point and the subcritical bifurcation point, there are two stable solutions. Unfortunately, detailed mecha-nisms leading to the nonlinear bifurcation are still not clear. As pointed out by Wanschura et al. [19], for low-Prandtl-number materials, the kinetic energy due to the inertial terms in the equa-tion of moequa-tion predominates the #ow stability. However, to further examine which term is domi-nant in the #ow bifurcations, other numerical instruments, such as the energy method [19], need to be used.
The dynamic behavior of heating and cooling is further illustrated. As expected from the bifurcation diagrams, dramatic changes occur after passing the subcritical bifurcation point (for heating) or the limit point (for cooling). Even though there are some delay, the stationary bifurcation diagram still accurately predicts the "nal stable state. Further-more, #ow structures with multi-fold symmetry are
Fig. 8. Dynamic evolution of heating: (a) zone length deviation; (b) surface temperature deviation.
Fig. 9. Dynamic evolution of cooling: (a) zone length deviation; (b) surface temperature deviation.
also observed during the transition from the axisymmetric to m2 modes. The inherent unsteadi-ness, i.e., the Hopf bifurcation or the routes to chaos, though not discussed in detail here, is de"-nitely an important subject that needs to be investi-gated in the future.
In summary, this study illustrates the signi"cance of the natural symmetry breaking and multiple states that may be encountered in VZM crystal growth, even though the thermal environments are perfectly axisymmetric. The results presented here also help understand the possible uncertainty dur-ing growth or zone-re"ndur-ing experiments.
Acknowledgements
The authors are grateful for the support from the National Science Council and the National Center for High Performance Computing of the Republic of China under Grant No. NSC87-2214-E008-008.
References
[1] W.G. Pfann, Zone Melting, 2nd edition, Wiley, New York, 1966.
[3] L. Colombo, R.R. Chang, C.J. Chang, B.A. Baird, Vacuum Sci. Technol. A 6 (1988) 2795.
[4] R.L. Henry, P.E.R. Nordquist, R.J. Gorman, S.B. Qadri, J. Crystal Growth 109 (1991) 228.
[5] C.W. Lan, D.T. Yang, Numerical Heat Transfer, Part A 29 (1996) 131.
[6] C.W. Lan, D.T. Yang, Modeling Simul. Mater. Sci. Eng. 3 (1995) 71.
[7] C.W. Lan, M.C. Liang, J. Crystal Growth 186 (1998) 203.
[8] C.W. Lan, D.T. Yang, Int. Heat Mass Transfer 41 (1998) 4351.
[9] G. Muller, A. Ostrogorsky, in: D.T.J. Hurle (Ed.), Hand-book of Crystal Growth 2b: Growth Mechanisms and Dynamics, North-Holland, Amsterdam, 1994, p. 754.
[10] G. Neumann, J. Fluid Mech. 24 (1990) 59.
[11] J. Baumgartl, W. Budweiser, G. Muller, G. Neumann, J. Crystal Growth 97 (1989) 9.
[12] S.H. Davis, U. Muller, D. Dietsche, J. Fluid Mech. 144 (1984) 133.
[13] C.W. Lan, M.C. Liang, M.K. Chen, Phys. Fluids 10 (1988) 1329.
[14] M.C. Liang, C.W. Lan, J. Comp. Phys. 127 (1996) 330. [15] C.W. Lan, M.C. Liang, J. Comp. Phys. 152 (1999) 55. [16] J.H. Ferziger, M. Peric, Computational Methods for
Fluid Dynamics, Springer, New York, 1996. [17] Fluent UNS 5.0 Usual Manual, Fluent Inc., 1999. [18] C.W. Lan, C.H. Chian, J. Crystal Growth 203 (1999) 286. [19] M. Wanschura, H.C. Kuhlmann, H.J. Rath, J. Fluid Mech.