Elsevier Science Publishers B.V., Amsterdam - Printed in The Netherlands
PRE-CONCENTRATION EFFICIENCY OF CHELEX-100 RESIN FOR HEAVY METALS IN SEAWATER
Part 2. Distribution of Heavy Metals on a Chelex-100 Column and Optimization of the Column Efficiency by a Plate Simulation Method
SU-CHENG PA1
Institute of Oceanography, National Taiwan University, Taipei (Taiwan) (Received 10th December 1987)
SUMMARY
Seawater was spiked with heavy metals and passed through a Chelex-100 column string con- sisting of ten minicolumns;The recoveries of metals from each minicolumn are used to study their distribution on a column. A simplified model was constructed to simulate the chelating efficiency of columns of various sizes, at various pH and flow rates. It is shown that a column containing 2 g of resin in the magnesium form with a flow rate of 4 ml min-’ is suitable for pre-concentration of Cd, Cu, Co, Mn, Ni, Pb, and Zn in seawater after adjustment to pH 6.5.
The chelating ion-exchange technique has been widely applied to pre-con- centrate very low levels of trace metals from seawater during the past 15 years
[ 1,2]. However, some recent evidence has indicated that this technique may not be as efficient as was previously thought [ 3,4]. Most recent investigators have adopted the procedure suggested by Kingston et al. [5] for Chelex-100 column operation, but have achieved various degrees of success. To clarify this, Sturgeon et al. [ 31 repeated the process in standard spiking experiments and showed that the recoveries of spiked heavy metals from seawater were as low as 44% for manganese, 57% for iron and 77% for copper. Because of uncertain- ties in their experiments, they admitted that the recoveries should be termed “apparent” recoveries rather than “true” recoveries. Even though the effi- ciency of the method was doubtful, it was still feasible to determine the con- centration of heavy metals in natural seawater based on standard-addition calibration. A comparative study made by Boniforti et al. [4] showed that the results obtained with Chelex-100 agreed fairly well with those by other meth- ods such as APDC/MIBK extraction or co-precipitation. However, if analyt- ical losses occur, many investigators believed that they are caused by the organic matter present in seawater which forms complexes with trace metals and so causes incomplete absorption of metals on the resin [ 3,6,7].
In Part 1 of this series [8], it was shown that the efficiency of the Chelex-
by Kingston et al. [5] who obtained nearly 100% recovery for manganese. Thus, the column dimensions and flow rate are also important criteria for col- umn performance. However, in many previous publications, the choice of col- umn size and flow rate were quite arbitrary. The lack of general criteria on those parameters has made optimization of the Chelex-100 technique a matter of trial and error.
In the work described below, the distribution of heavy metals on a Chelex- 100 column after seawater had passed through was studied. The column was divided into small sections and the spiked trace metals were recovered from each individual section. In so doing, a simplified model was derived to describe the effect of column size and flow rate on the recovery of heavy metals. The efficiency of any given column can therefore be predicted.
EXPERIMENTAL
Materials and instrumentation
Chelex-100 columns. Chelex-100 resin (sodium form, 100-200 mesh; Bio- Rad Laboratories) was weighed in 0.4 2 0.02-g portions, which were sealed in 50-ml beakers until required. Each portion was packed into a tygon minicol- umn as described in Part 1 [ 81. It was convenient to use a column rack which held twenty minicolumns in a row, so that to pack and wash twenty minicol- umns simultaneously required no more than 1 h. Ten minicolumns were con- nected together to give a column string containing a total resin weight of 4 g. When connections were made, a layer of water was maintained above the resin to prevent air entering the resin bed (see Fig. 1). The column string was con- verted to the ammonium form by washing in sequence with 20 ml of 2 M nitric acid, 60 ml of distilled water, 20 ml of 1 M ammonia water, and 100 ml of distilled water.
Purified coastal seawater. Freshly collected coastal seawater was stored in a 25-l polyethylene tank. To this was added 50 mg of iron as iron (III) chloride, and the pH was maintained at its original 8.0. The mixture was stirred and allowed to stand for 2 or 3 days until the brownish precipitate settled on the bottom. The supernatant liquid was led to a column containing 10 g of Chelex- 100 (sodium form) and the effluent was filtered through a 0.45~pm membrane filter. The co-precipitation process with hydrated iron (III) oxide absorbs par-
3
4
2 3 4 5 6 7 6 PH
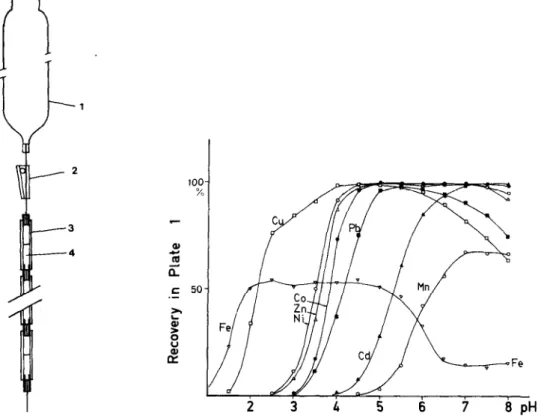
Fig. 1. The sectional Chelex-100 column string: (1) 500-ml sample reservoir; (2) plastic clamp; (3) column made of tygon tubing; (4) Chelex-100 resin, 100-200 mesh.
Fig. 2. The recovery of trace metals in the first section (0.4 g of resin) of a Chelex-100 column at various pH values in presence of ammonium acetate. Sample (500 ml of seawater) was spiked with 10 M of each element and loaded at a flow rate of 4 ml min-‘.
titles and most heavy metals such as chromium, copper or zinc, whereas the later Chelex-100 treatment further removes cadmium, remaining heavy met- als, and part of the colloidal iron.
Atomic absorption spectrometry (u.u.s.). A Hitachi Model Z-8000 (polarized
Zeeman effect) atomic absorption spectrometer was used to determine heavy metals. Both the flame and graphite-furnace atomizers are equipped with strong magnetic fields to give a double-beam correction system based on the Zeeman effect. The operational conditions for the graphite furnace were as recom- mended by the manufacturer.
General procedure
An aliquot (500 ml) of the purified seawater was spiked with 10 pg of each heavy metal (including Cd, Cu, Cr(III), Fe, Mn, Ni, Pb, and Zn) to give a concentration level of 20 pg 1-l. To the solution was added 20 ml of 1 M am-
mined directly by flame 8.8.5.
Recommended procedure for natural seawater
An aliquot (500 ml) of the seawater was mixed with 20 ml of 1 M ammonium acetate (pH 6.1) and the pH was adjusted to 6.5 with ammonia. The mixture was transferred to a Pyrex reservoir and loaded onto a Chelex-100 column con- taining 2 g of the resin in the magnesium form at a flow rate of not more than 4 ml min-’ controlled by a plastic clamp (about 1 drop per second). After all the sample had passed through, the column was disconnected from the reser- voir and a Pyrex funnel was plugged into the top. The column was washed with 20 ml of distilled water, five 4-ml portions of 1 M ammonium acetate (pH 5.5) to remove major cations, and 40 ml of distilled water. Heavy metals were then recovered with four 2-ml portions of 2 M nitric acid. The eluate was collected in a calibrated test tube and diluted to exactly 10 ml with distilled water. The final solution was stirred vigorously and was then ready for graphite-furnace a.a.s. determination of Cd, Co, Cu, Fe, Mn, Ni, and Pb. Zinc was determined by flame 8.8.5. because of its high sensitivity. The analysis was repeated five times, as were analyses of blanks and spiked samples (see Results and Discussion).
RESULTS AND DISCUSSION
Distribution of metals on the column sections
The recoveries of trace metals from the Chelex-100 column string at pH 5.4 and 8.0 are shown in Table 1. It is interesting to note that, at these two pH values, the general distribution patterns are distinctly different for several ele- ments. At pH 5.4, the first section of the column collects more than 97% of Co, Cu, Ni, Pb, and Zn, but only 51% of Cd, 40% of Fe, and 14% of Mn. At pH 8.0, only Co, Ni, and Zn retain similar patterns as at pH 5.4; the recoveries of Cu, Pb, and Fe in the first plate drop to 68%, 67%, and 21%, respectively, while the recoveries of cadmium and manganese increase to 93% and 64%. The sig- nificance of these results is that they explain why Sturgeon et al. [3] obtained low recovery of manganese working at pH 5.4, and why Bruland et al. [ 111
found that the Chelex-100 method gave low results for copper at pH 8.0. The reason for these analytical losses was not the inadequacy of the Chelex-100
TABLE 1
Distribution of spiked heavy metals on the sectional Chelex-100 column at pH 5.4 or pH 8.0 (both in presence of ammonium acetate)”
Section Recovery ( % of the spiked amount)
Cd Co Cu Cti+ Fe Mn Ni Pb Zn Distribution at pH 5.4 1 51 97 98 9 2 27 2 2 < 3 13 < < < 4 6 < < < 5 2 < < < 6 1 < < < 7 1 < < < 8 < < < < 9 < < < < 10 < < < < Total 101 99 100 9 40 14 99 97 105 13 11 < < 4 6 9 < < < 5 8 < < < 4 5 < < < 4 5 < < < 3 5 < < < 3 4 < < < 3 3 < < < 2 3 < < < 83 67 99 97 109 Distribution at pH 8.0 1 93 96 68 4 2 6 4 9 2 3 1 < 5 < 4 < < 2 < 5 < < < < 6 < < < < 7 < < < < 8 < < < < 9 < < < < 10 < < < < Total 100 100 84 6 21 64 12 22 8 7 5 4 4 1 3 < 3 < 3 < 2 < 3 < 64 98 96 < < < < < < < < < 67 11 5 < < < < < < < 95 12 2 < < < < < < < 96 83 109
“10 pg of each metal was spiked to 500 ml of seawater; the loading flow rats was controlled at 4.0 ml min-’ . Each section of the column contained 0.4 g of lOO-200-mesh resin. “<” denotes less than the detection limit of Zeeman-effect flame a.a.s.
method, but the selection of a non-optimal pH so that the apparent capacity
of the column was insufficient for those elements. It should be borne in mind
that the use of pH 5.4 is not wrong; nearly 100% recovery can still be obtained by using a big column or a slow flow rate. It can be assumed that if Sturgeon et al. [3] had used more resin, they would have obtained higher recovery of manganese; by contrast, if they had used less resin, they might have found that the recovery for Cd was also incomplete.
The total percentage recovery of a column consisting of n plates will be R (total)=R,+R2+..+R,
Based on these equations, and from the experimental data for R, (% ), com- puter simulation can be used to predict the efficiency of a Chelex-100 column of given dimensions and to assess the optimal pH for better performance. To test this, additional spiking experiments were made at various pH values (l- 8), and the results of the recoveries in the first plate (RI % ) were plotted
against pH as shown in Fig. 2.
The computer-simulated distributions matched amazingly well with the ac- tual measured distributions for Cd, Co, Mn, Ni, and Zn at all pH values tested. For example, the calculated recoveries of manganese at various pH values are shown in Table 2, which clearly illustrates the pH effect on the column effi- ciency. For a Chelex-100 column containing 2 g of resin, operated at pH 5.5 and at a flow rate of 4 ml min-‘, the total recovery of manganese is predicted to be 55.6%. Doubling the column size to 4 g of resin increases the recovery to 80.3%: a large 11.6-g resin column would be required to obtain an efficiency of 99%. At the same flow rate but at pH 6.5, the same 2-g resin column would give 98.3% recovery of manganese. The recovery can be further improved to 99.7% if the solution is adjusted to pH 7.0. The agreement of calculated and experi- mental results also applied to iron at pH > 5, and to copper and lead at pH z+ 7.
TABLE 2
Simulated distribution of manganese on a Chelex-100 column operated at a flow rate of 4 ml min- ’ Plate Recovery ( W) at different pH
number” 5.0 5.5 6.0 6.5 7.0 1 4.0 15.0 42.0 56.0 68.0 2 3.3 12.7 24.4 24.6 21.8 3 3.7 10.8 14.1 10.8 7.0 4 3.5 9.2 6.2 4.8 2.2 5 3.4 7.0 4.8 2.2 0.7 Total 18.4 55.5 93.5 98.4 99.7
“Each plate is assumed to contain 0.4 g of resin. Recoveries on plate 1 were taken from Fig. 2; other data were calculated by the proposed equations.
This can be ascribed to the fact that at high pH Fe, Cu, and Pb form hydroxide complexes which cannot enter the bore structure of the resin and are therefore lost to the sorption. For these reasons, the choice of pH for multi-element collection was limited to 7.0, or preferably 6.5. The effort of improving recovery of iron was abandoned.
Flow-rate
The efficiency of a Chelex-100 column is also affected by the flow rate. It should be noted that the sample usually passes through a column at a rate so
Ml
I
d 5 6 7 8 5 6 7 8 100 50 L 5 6 7 0 5 6 7 a PH Kc 50 1Ci 50 C 5 6 7 a F PE
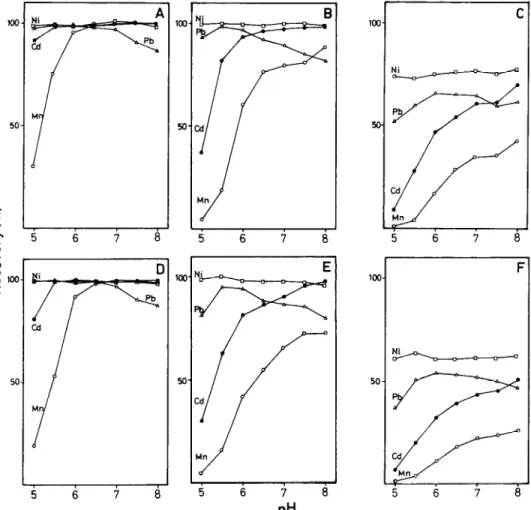
Cd kin 5 6 7 aFig. 3. Recovery of Cd, Mn, Ni, and Pb from seawater at various pH values on Chelex-100 columns with different resin weights at various flow rates; 10 pg of each metal was added to 500 ml of seawater. Resin weight: (A, D) 2.0 g; (B, E) 0.4 g; (C, F) 0.1 g. Flow rate: (A-C) 1 ml min-‘; (D- F) 4 ml min-‘.
correct, then the improvement of column efficiency by halving the flow rate should be equivalent to that obtained by doubling the column size. To check this, tests were conducted with different columns (containing 0.1,0.4 g, and 2.0 g of resin) at various flow rates (1 and 4 ml min-’ ). To avoid the problems of measuring the void volume, only the resin weight was considered. Theoret- ically, 0.1 g of resin with a flow rate of 1 ml min-l should give the same results as those obtained with 0.4 g of resin and 4 ml min-‘. However, the experimen- tal results shown in Fig. 3 do not support this simple idea. Calculations showed that reducing the flow rate from 4 to 1 ml min-’ is approximately equivalent to doubling the column size. Paulson [7] has demonstrated that the most ef- fective way to enhance the column efficiency is to use slow flow rates (e.g., 0.2 ml min-l). H owever, considering the total loading time for each sample, the use of high flow rates is obviously preferable. It was found here that a column containing 2 g of Chelex-100 resin, with the seawater at pH 6.5, and a flow rate of 4 ml min-’ provided the most appropriate combination for pre-concentrat- ing Cd, Co, Cr, Mn, Ni, Pb, and Zn from seawater at > 98% of efficiency.
Buffer and resin form
In preliminary experiments, sodium acetate was used as buffer instead of ammonium acetate. No significant difference was found. Both the magnesium and the ammonium forms of the resin were tested for efficiency, and gave quite similar results. The reason for interest in the magnesium form of the resin was simply that it gives much more stable pH than does the ammonium form. Usu- ally when 20 ml of 1 M ammonium acetate (pH 6.1) is added to 500 ml of unacidified seawater, the pH goes to 6.5 right away. At this pH, the ammonium acetate does not provide enough buffering capacity and the pH may change during passage through an ammonium column. However, use of the magne- sium form of the resin usually introduces high blanks, probably from the mag- nesium chloride used to prepare it. To compensate for this, the reagent was carefully purified by adding a little sodium acetate buffer and passing through a Chelex-100 column at pH 6.5. The solution was stored in a Pyrex glass con- tainer over Chelex-100 resin beads.
Application to natural seawater
All the previous spiked experiments at the 20 pg 1-l level proved that the Chelex-100 technique, if used under the nominally optimal conditions, is more
than 98% efficient for pre-concentrating heavy metals from seawater (except for iron and chromium). The technique should work even better at < 1 lug 1-l levels, but the real efficiency at such concentrations could not be proved be- cause of the limit of determination of graphite-furnace 8.8.9.
The recommended Chelex-100 procedure (see Experimental) was applied to a natural seawater, to demonstrate its precision and detection limit. The seawater tested was collected by the staff of the R.V. Ocean Researcher I from the surface of the West Philippine Sea. It was filtered, acidified and stored in a polyethylene tank.
The final solution obtained by the recommended procedure contains a high concentration of ammonium ions, which may interfere with the determination of the metals by graphite-furnace a.a.s. [ 131 because of variable behaviour
during the drying and ashing stages. Accordingly, the heavy metal contents cannot be calculated directly from calibration grahps prepared with standards in either distilled water or in 2 M nitric acid and the standard addition method must be applied. The seawater sample was spiked with 0.1 pg 1-l Cd and 1 ,ug 1-l of the other metals and treated by the same pre-concentration procedure as the sample . The mean readings and results obtained are shown in Table 3.
The sample was probably contaminated before it reached the laboratory, judged from the high contents of zinc and lead, and compared with literature data. However, the low detection limits and the relative standard deviations given TABLE 3
Analysis of a Philippine Sea seawater sample by the Chelex-100 technique and graphite-furnace a.a.s. Cd co Cu Fe Mn Ni Pb Zn” Raw datab Analytical blank Seawater Spiked seawater 34 34 39 151 670 90 36 25 180 35 420 518 3436 257 780 588 1445 1349 1732 1984 6265 804 1999 812 Calculated results Detection limit’ (ng 1-l) Cont. in sample (ng 1-l) S.d. (ng 1-l) R.s.d. (%) 1 18 30 85 50 100 15 24 12 <d 290 250 978 302 611 2500 1 - 20 50 58 48 16 160 6 - 7 10 6 16 3 6
*Zinc was determined by flame a.a.s. bEach number (absorbance x 104) is the mean of five read- ings. ‘Detection limits were estimated from 4.65 times the deviation of blank readings. dBelow detection limit.
University of Liverpool, and Prof. A.T.C. Chen of the National Sun Yet Sen University, Kaohsiung, Taiwan, for their kind suggestions and criticism.
REFERENCES 1 2 3 4 5 6 7 8 9 10 11 12 13
I. Hirota, S. Okabe, T. Tsuruoka and T. Komakine, J. Fat. Mar. Sci. Technol., Tokai Univ., 21 (1985) 31.
J. Martin, G. Knauer and W. Broenkow, Deep Sea Res., 32 (1985) 1405.
R.E. Sturgeon, S.S. Berman, A. Desaulniers and D.S. Russell, Talanta, 27 (1980) 85. B. Boniforti, R. Ferraroli, P. Frigieri, D. Heltai and G. Queirazza, Anal. Chim. Acta, 162
(1984) 33.
H.M. Kingston,I.L. Bames,T.J. Brady,T.C.RainsandM.A.Champ,AnaI. Chem.,50 (1978) 2064.
M.I. Abdullah, O.A. El-Rayis and J.P. Riley, Anal. Chim. Acta, 84 (1976) 363. A.J. Paulson, Anal. Chem., 58 (1986) 183.
S.C. Pai, P.Y. Whung and R.L. Lai, Anal. Chim. Acta, 211 (1988) 257. D.E. Leyden and A.L. Underwood, J. Phys. Chem., 68 (1964) 2093.
P.Y. Whung, M.Sc. Thesis, National Taiwan College of Marine Science and Technology, Keelung, Taiwan, 1984.
K.W. Bruland, R.P. Franks, G.A. Knauer and J.H. Martin, Anal. Chim. Acta, 105 (1979) 233.
S.J. De Mora and R.M. Harrison, Anal. Chim. Acta, 153 (1983) 307.