PII S0360-3016(99)00421-6
PHYSICS CONTRIBUTION
TREATABLE DOMAIN AND OPTIMAL FREQUENCY FOR BRAIN TUMORS
DURING ULTRASOUND HYPERTHERMIA
W
IN-L
IL
IN, P
H.D.
†, C
HIHNG-T
SUNGL
IAUH, P
H.D.,* J
IA-Y
USHY
EN, P
H.D.,
‡Y
UNG-Y
AWC
HEN, P
H.D.,
§ ANDM
ING-J
IUMS
HIEH, M.D., P
H.D.
†*Department of Mechanical Engineering, Kun-shan Institute of Technology, Tainan, Taiwan;†
Institute of Biomedical Engineering, and Departments of‡
Mechanical Engineering and§
Electrical Engineering, National Taiwan University, Taipei, Taiwan
Purpose: To examine the optimal ultrasound frequency and the treatable domain determined by the tumor size and tumor depth when an external ultrasound heating system is employed for the brain tumor hyperthermia. Methods and Materials: This work employs a simplified model of a scanned ultrasound transducer power deposition (a cone with convergent/divergent shape) and a search algorithm to investigate the optimal frequency and the treatable domain. The distributions of temperature and SAR (specific absorption rate) ratio are used to determine the appropriateness of the acoustic window size and the input power level for a yielded set of tumor conditions. The factors considered are the acoustic window size, tumor size and depth, ultrasound frequency, and the acoustic absorption of the post-target bone behind the tumor.
Results: Simulation results demonstrate that the optimal frequency depends on the tumor depth and the acoustic absorption of the post-target bone. However, it is almost independent of the acoustic window size. The optimal frequency shifts to a higher level for a deeper tumor heating to reduce the effect of the high acoustic absorption of post-target bone. Moreover, the treatable domain is proportional to the acoustic window size and related to the ultrasound frequency.
Conclusion: It may not be possible to deliver appropriate ultrasonic energy to heat a brain tumor without overheating the normal brain tissue and/or the post-target bone under the constraints of the available acoustic window size for the ultrasonic beam, ultrasonic attenuation of brain tissue, high absorption of post-target bone, and high blood perfusion rate. The results of this study can be a guideline for designing an optimal ultrasound heating system, arranging the transducers, and implementing further treatment planning for the brain tumor hyperthermia. © 2000 Elsevier Science Inc.
External ultrasound hyperthermia, Brain tumors, Acoustic window, Post-target bone, Treatable domain, Opti-mal frequency.
INTRODUCTION
Quan et al. (1) have presented the calculated thermal fields in a two-dimensional (2D) brain model generated by an ultrasound applicator. Their results showed that focused ultrasound, especially focused arrays, are suited to trans-dural sonication. By choosing an optimum frequency, the gain at focus is sufficient to selectively heat a tumor a few centimeters deep in brain tissues. Scanned, focused ultra-sound (SFUS) (2) has been employed to achieve therapeutic temperature within brain tumors, with an acceptable level of toxicity (3). A preliminary craniectomy was performed, avoiding absorption of the ultrasound beam by the skull, and multiple thermal sensors were employed to ascertain intra-tumoral temperatures. The patients underwent a craniec-tomy at least 1.5 cm larger than the tumor in all directions for the treatment. Creating an appropriate size of bone
window as the acoustic window is deemed necessary to allow the ultrasound beam to penetrate into the brain tumor during treatments. The appropriate minimum size of tic window depends on the tumor size, tumor depth, acous-tic attenuation and absorption in the tissues, and the driving frequency of the ultrasound transducer (4). During external ultrasound hyperthermia for the brain tumor, it is also nec-essary to avoid overheating the post-target bone behind the tumor. Owing to the high absorption of ultrasound and the sensitivity toward heat for the basal dura of the skull, an allowable low level of ultrasound intensity should be main-tained to avoid the generation of high temperature in the post-target bone and/or discomfort for the patient.
To overcome the effect of ultrasound attenuation in the brain tissue and the overheating problem in the post-target bone, a convolutional average power deposition with a Reprint requests to: Win-Li Lin, Institute of Biomedical
Engi-neering, College of Medicine, National Taiwan University, No.1, Sec. 1, Jen-Ai Road, Taipei, Taiwan. Tel: 886-2-23970800, ext. 1445; Fax: 886-2-23940049; E-mail: [email protected]
Acknowledgments—The authors would like to thank the National
Science Council of the Republic of China for partially supporting this research under contract nos. NSC 87-2213-E-002-075 and 88-2213-E-002-015.
Accepted for publication 23 September 1999.
0360-3016/00/$–see front matter
convergent-divergent cone shape should be formed to ob-tain the appropriate heating. A scanned, focused ultrasound heating system (5–7) can yield a convolutional average power deposition close to this ideal shape by scanning spherically focused ultrasound beams with an appropriate selection of scan parameters (tilt and rotation angles, scan radius, focal depth, and input power level). In addition, 2D arrays of transducers (8, 9) can produce such a power deposition by controlling the amplitude and phase of each array element. This work employs a simplified model of ultrasound power deposition and a search algorithm based on temperature distribution to examine the optimal ultra-sound frequency and the treatable domain of tumor size and tumor depth. The size of acoustic window, tumor size and depth, ultrasound frequency, and the acoustic absorption of post-target bone have been investigated to search for the appropriate driving frequency of ultrasound transducer for a yielded tumor depth and tumor size. The domain of treatable tumor size and tumor depth for a given ultrasound fre-quency and acoustic window is also studied.
METHODS AND MATERIALS
The deposition of ultrasound energy within the brain is modeled as a cone of convergent/divergent shape as shown in Fig. 1. The brain is taken as a sphere with a diameter of 16 cm. The left side with a diameter of d(0) m is regarded as the opened skull window for the ultrasonic beam, and the right side with a diameter of d(zb) m is regarded as the
region for the ultrasound beam hitting on the skull bone, called the post-target bone in the following study, behind the tumor. The narrowest region with a diameter of d(zt) m
is regarded as the focal zone, and beyond this zone, the ultrasonic beam is propagated divergently. This type of power deposition can form an appropriate temperature dis-tribution for a deep-seated tumor heating while the bone window for the ultrasound beam is sufficiently large to overcome the ultrasonic attenuation caused by the brain tissue (4). It can also avoid overheating the region beyond the tumors because of the ultrasonic beam’s attenuation and divergence. The total ultrasound energy is attenuated ac-cording to the exponential law and the deposition of ultra-sonic intensity within the conical region is assumed as a uniform distribution at each depth (6, 10) to avoid overly complicated calculations,
For the brain tissue (0ⱕ z ⬍ zb):
Q共z兲 ⫽ Q(0) 䡠 e⫺2z⫹ R 䡠 Q(0) 䡠 e⫺2zb 䡠 e⫺2共 zb⫺z兲 (Eq. 1a)
⫽ Q(0) 䡠 关e⫺2z⫹ R 䡠 e⫺2共2zb⫺z兲兴
For the post-target bone (zbⱕ z):
Q共 z兲 ⫽ Q(0) 䡠 共1 ⫺ R兲 䡠 e⫺2zb 䡠 e⫺2b共 z⫺zb兲 (Eq. 1b)
where Q(0) denotes the total ultrasonic energy propagating through the acoustic window, A(0)⫽ [d(0)/2]2; d(0) is the
diameter of acoustic window; Q(z) represents the total ul-trasonic energy propagating through the cross-sectional area of the cone at depth z m; and b are the ultrasound
attenuation per unit path length in the brain tissue and the post-target bone, respectively; is 7.5 Np m⫺1MHz⫺1(11, 12) andbis a function of ultrasound frequency, and listed
in Table 1 (11, 12); and R is the energy ratio of the reflected ultrasound to the incident ultrasound beam at the interface of brain tissue and post-target bone.
I共 z兲 ⫽ Q共 z兲
A共 z兲 (Eq. 2)
where I(z) represents the ultrasonic intensity on the cross-sectional area of the cone at depth z m, A(z)⫽ [d(z)/2]2; d(z) is the diameter of the cross-sectional area of the cone at depth z m.
Assuming that the ultrasound intensities are not large enough to cause wave distortion, and attenuation and ab-sorption coefficients for the tissues are equal (all of the
Fig. 1. Schematic diagram of the geometry studied for the optimal frequency and the domain of treatable tumor size and tumor depth. The left side is the entrance window for the ultrasonic beam. The narrowest region is the focal zone, with a diameter of d(zt) and a distance ztfrom the acoustic window. The right side is considered to be the post-target bone region (assumed to be 4-cm thick during the simulation calculation) for the ultrasound beam projecting on the skull. The diameters of the spherical brain, the acoustic win-dow, and the post-target bone region are assumed to be 16 cm, d(0), and d(zb) m, respectively.
attenuated energy is absorbed in the heating field) (13), then the SAR (specific absorption rate) in homogeneous and uniformly attenuating media is proportional to the ultra-sound intensity. Hence, we can obtain the absorbed power density at the depth of z m as:
q共 z兲 ⫽ 2␣ 䡠 I共 z兲 (Eq. 3) ⫽
冦
2 䡠Q(0) A共 z兲 䡠 关e ⫺2z ⫹ R 䡠 e⫺2共2zb⫺z兲兴, for 0 ⱕz ⬍ z b 2b 䡠 共1 ⫺ R兲 䡠 Q(0) A共 z兲 䡠e ⫺2zb䡠 e⫺2b共 z⫺zb兲, for z b ⱕ zwhere q(z) is the absorbed ultrasound power density at the depth z m; symbol␣ is the ultrasonic absorption coefficient of the tissue (equal to for the brain tissue, or bfor the
skull bone in this study).
The ratio of SAR at the depth z to the acoustic window area is (a) For the brain tissue (0ⱕ z ⬍ zb):
SR(z;0)⫽SAR共z兲 SAR(0)⫽ q共z兲 q共0兲 ⫽ 2 䡠Q共0兲 A共z兲 䡠 关e ⫺2z⫹ R 䡠 e⫺2共2zb-z兲兴 2 䡠 Q共0兲 A共0兲 ⫽ d 2共0兲 d2共 z兲 䡠 关e⫺2z ⫹ R 䡠 e⫺2共2zb⫺z兲兴 (Eq. 4a)
(b) For the post-target bone (zbⱕ z):
SR共 z;0兲 ⫽q共 z兲 q共0兲 ⫽ 2b䡠 共1 ⫺ R兲 䡠 Q共0兲 A共 z兲 䡠e ⫺2zb䡠 e⫺2b共 z-zb兲 2 䡠 Q共0兲 A共0兲 ⫽b 䡠 d2共0兲 d2共 z兲 䡠 共1⫺ R兲 䡠 e⫺2zb䡠 e⫺2b共 z⫺zb兲 (Eq. 4b) where SR(z;0) is the ratio of specific absorption rate (SAR) of ultrasound at the depth z to the acoustic window area, SAR(z)/SAR(0); q(0) denotes the absorbed ultrasound power density on the acoustic window.
From Eq. 4a, we obtain
d共 zt兲 ⫽
d共0兲
关SR共 zt;0兲兴0.5䡠 关e
⫺2zt ⫹ R 䡠 e⫺2共2zb-zt兲兴0.5
(Eq. 5)
By considering the post-target bone, we can derive the ultrasound power deposition at the surface of post-target bone as, Q共 zb⫹兲 ⫽ 共1 ⫺ R兲 䡠 Q共0兲 䡠 e⫺2zb (Eq. 6) I共zb⫹兲 ⫽ 共1 ⫺ R兲 䡠 Q共0兲 䡠 e⫺2zb A共0兲 䡠d 2共z b兲 d2共0兲 ⫽ d 2共0兲 d2共 z b兲 䡠 共 1⫺ R兲 䡠 I共0兲 䡠 e⫺2zb with d共zb兲 ⫽ d共zt兲 ⫹
冋
zb ⫺ zt zt 䡠 共d共0兲 ⫺ d共z t兲兲册
(Eq. 7)where Q(zb⫹) denotes the total ultrasound energy deposited
onto the surface of post-target bone, A(zb)⫽ [d(zb)/2]
2 , at depth zbm; d(zb) is the diameter of ultrasound beam hitting
on the post-target bone; I(zb⫹) represents the ultrasound
intensity on the surface of post-target bone, Q(zb⫹)/A(zb).
Hence, the ratio of SAR at the depth z to the surface of post-target bone is,
For 0ⱕ z ⬍ zb: SR共 z;zb⫹兲 ⫽ q共 z兲 q共 zb⫹兲 ⫽ 2 䡠 I共 z兲 2b䡠 I共 zb⫹兲 (Eq. 8) ⫽ 2 䡠Q共0兲 A共 z兲 䡠 共e ⫺2z ⫹ R 䡠 e⫺2共2zb⫺z兲兲 2b 䡠 d2共0兲 d2共 z b兲 䡠 共 1⫺ R兲 䡠 I共0兲 䡠 e⫺2zb ⫽ d2共 z b兲 d2共 z兲 b 䡠 共e ⫺2z⫹ R 䡠 e⫺2共2zb⫺z兲兲 共1 ⫺ R兲 䡠 e⫺2zb
From Eq. 8, we obtain
d2共 z t兲 ⫽ d2共 z b兲 b 䡠 SR共 zt;zb⫹兲 䡠 共e ⫺2zt⫹ R 䡠 e⫺2共2zb⫺zt兲兲 共1 ⫺ R兲 䡠 e⫺2zb (Eq. 9) with d共 zb兲 ⫽ d共 zt兲 ⫹
冋
zb⫺ zt zt 䡠 共d(0) ⫺ d共 z t兲兲册
Hence, d共 zt兲 ⫽ zt⫺ zb 共2zt⫺ zb兲 ⫺ zt䡠冋
b 䡠SR共zt;zb⫹兲册
0.5 䡠冋
共e ⫺2zt⫹ R 䡠 e⫺2共2zb⫺zt兲兲 共1 ⫺ R兲 䡠 e⫺2zb册
⫺0.5 䡠 d共0兲 (Eq. 10)Temperature solver
Pennes’ (14) steady-state bioheat transfer equation (BHTE) was used to solve for the temperature distribution,
kⵜ2
T⫺ Wcb共T ⫺ Ta兲 ⫹ q ⫽ 0 (Eq. 11)
The above BHTE is a simplification that neglects the effects of discrete blood vessels and the redistribution of thermal energy within the local vascular network. However, the BHTE is a good approximation that offers a practical ap-proach for modeling biothermal processes (15–17) and per-forming general parameter studies. For convenience, this BHTE can also be written in other forms (18, 19) to provide a better description of the heat transfer in the tissue. The thermal conductivity (k) is 0.5 and 0.58 W m⫺1°C⫺1for soft tissue (20–22), and bone tissue (23), respectively. The spe-cific heat of blood (cb) is 3,770 J kg⫺1°C⫺1and the arterial
temperature (Ta) is 37°C. The absorbed ultrasonic power
density (q) was obtained using the above procedure for a given total input power Q(0). The input power level (Q[0])
is determined by the temperature constraints (see Fig. 2). All attenuated ultrasonic energy was assumed to be ab-sorbed by the tissue in the heating region. The anatomic and physiological properties were assumed to remain the same throughout the entire field, and metabolism was neglected due to its small contribution to the temperature changes (17, 24). The blood perfusion (W) for the post-target bone was maintained at 0 kg m⫺3s⫺1and 10 kg m⫺3s⫺1for the brain tissue (23) unless otherwise noted. The thickness of the post-target bone was taken as 4 cm for all simulations. The front surface and other boundary conditions were assumed as constants at a temperature of 37°C. The central axis was treated as adiabatic (6) because no energy transfer occurs in the radial direction at the central-line due to the symmetry of both the power distribution and the anatomical and phys-iological properties. The steady-state BHTE was numeri-cally approximated using the successive-over-relaxation technique and the method of central finite differences (25) to obtain the 2D temperature field (r–z) induced by the power deposition for a given set of tumor/bone conditions, acoustic window size, and input power level. The grid spacing used was 0.1 cm, the over-relaxation factor was 1.8, and the convergence criterion was the root mean square error less than 10⫺7. The acoustic window diameter was 5–12.5 cm, and the ultrasound frequency was 0.3–3.5 MHz.
RESULTS
The procedure shown in Fig. 2 is used to search for the appropriate diameter of the acoustic window and the input power level that will result in a temperature distribution to meet conditions 1–4 for each set of tumor. During the search, temperature constraints are employed as the deter-mination conditions for the process. The temperature at the focal zone is set to reach 45°C, and the greater value between the maximum temperature of the region close to the acoustic window and that of the post-target bone is set at 41.5°C. Those temperature conditions are used to obtain an appropriate input power level and acoustic window size which can raise the maximum temperature of the predeter-mined region to 45°C without overheating the post-target bone and the normal tissue, particularly the region close to the acoustic window.
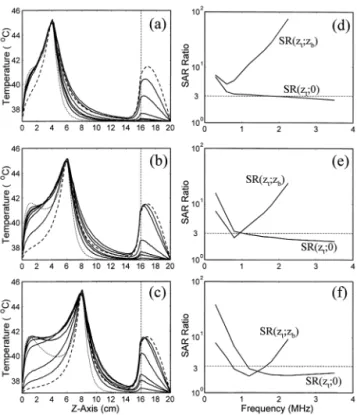
Figures 3a–c show the temperature distributions along the depth direction by using the search method of Fig. 2 to obtain an appropriate input power level and acoustic win-dow size for heating a 2.5-cm diameter tumor located at 4, 6, and 8 cm, respectively. The ultrasound attenuation for the brain tissue is 7.5 Np m⫺1MHz⫺1(11, 12) and those for the skull bone are listed in Table 1 (11, 12). The energy ratio (R) of the reflected ultrasound at the interface of brain tissue and post-target bone is assumed to be equal to 0. The figures reveal that the temperature rise in the post-target bone decreases; however, the rise close to the acoustic window increases when a higher frequency ultrasound is used. A higher frequency ultrasound attenuates faster in the tissues and hence a greater amount of energy is absorbed to
pro-Fig. 2. Flow chart of the search method used to determine the appropriate diameter of the acoustic window and the input power level for a given set of tumor conditions and ultrasound frequency. The temperature conditions (1–4) are employed as the constraint criteria to obtain an appropriate temperature distribution. Q0(0)
and d0(0) are the initial guess values of the total input power (Q[0])
propagating through the acoustic window and the acoustic window diameter (d[0])).
duce a higher temperature rise in the region close to the acoustic window, and the temperature rise is more obvious for a deeper tumor heating upon changing the ultrasound frequency. On the other hand, a lower frequency ultrasound attenuates slower and is able to penetrate deeper to produce a higher temperature rise in the post-target bone. Figures 3d–f present the relationship between SAR ratios (SR(zt;0),
SR(zt;zb)) and ultrasound frequency corresponding to Figs.
3a–c, respectively, based on Eqs. 4 and 8 for R⫽ 0. The SR curves show the variations of SR(zt;0) and SR(zt;zb) to the
ultrasound frequency when appropriate temperature distri-butions are obtained using the search method of Fig. 2. The value of SR(zt;0) decreases monotonously with ultrasound
frequency, while the value of SR(zt;zb) decreases first and
then increases. The closeness or intersection of these two curves appears in the low-frequency region for a shallow tumor heating, and it moves to the higher frequency region for a deeper tumor. When comparing to the temperature distributions (Figs. 3a–c), Figs. 3d–f show that the con-straint condition for the left side of the intersection is
the overheating of the post-target bone caused by low-frequency ultrasound, while the right side denotes that the constraint condition is the overheating of the region close to the acoustic window caused by high-frequency ultrasound.
Figures 4a and b show the appropriate acoustic window size and the input power level obtained from the search method of Fig. 2 for heating a 2.5-cm diameter tumor located at 4, 6, and 8 cm, respectively, with different ultra-sound frequencies. There exists a minimum value for each curve. Figure 4a denotes that the frequency corresponding to the minimum value of acoustic window increases with the tumor depth, whereas Fig. 4b displays that the frequency related to the minimum value of input power decreases with the tumor depth.
Optimal ultrasound frequency
Figure 5a depicts the relationship between the treatable tumor size (d(zt)) and ultrasound frequency when the search
method of Fig. 2 is used for a 10-cm diameter acoustic window (d[0]) and the tumor located at 4, 6, or 8 cm. During this search, the acoustic window size (d[0]) is fixed and the search outputs are the treatable tumor size (d[z]) and the required input power level (Q[0]). Q(0) and d(zt) are varied
during the search to meet the temperature conditions. The results show that a peak of treatable tumor size appears for each tumor depth curve. This peak indicates the maximum treatable tumor size that fulfills the temperature constraints, and the corresponding ultrasound frequency is called the optimal frequency. Hence, the optimal frequency is the one to be used to obtain the maximum treatable tumor size when
Fig. 3. (a–c) Temperature distributions obtained from the search method of Fig. 2 for d(zt)⫽ 2.5 cm, R ⫽ 0, and zt⫽ 4, 6, or 8 cm, while different ultrasound frequencies are used. (d–f) The relation-ship between SAR ratios (SR[zt;0], SR[zt;zb]) and ultrasound fre-quency corresponding to (a–c).
Fig. 4. Relationship between the acoustic window size, input power level, and ultrasound frequency obtained from the search method of Fig. 2 for d(zt)⫽ 2.5 cm, R ⫽ 0, and zt⫽ 4, 6, or 8 cm. The relative input power level is calculated based on the minimum value required for each tumor depth.
Table 1. The acoustic attenuation (or absorption) of skull bone related to ultrasound frequency (10, 11)
Frequency
(MHz) 0.3 0.6 0.8 1.2 1.6 1.8 2.25 3.5 Attenuation
the acoustic window size and the tumor depth are given. The curves mentioned above also reveal that the frequency for those peaks increases with the tumor depth. This finding suggests that a higher ultrasound frequency should be used for a deeper tumor to overcome the difficulty of the high acoustic absorption of post-target bone. This finding seems to be in contrast with the conventional concept that a lower ultrasound frequency should be used for heating a deeper tumor (13) when the post-target bone does not exist. Those curves also show that a range of frequencies can be used to meet the temperature requirements for a tumor located at the same depth but smaller than the maximum treatable tumor size. For instance, the range of frequency will be from 0.6 to 2.25 MHz for a tumor with a 2-cm diameter located at 8-cm deep. For this case, an overheating in the post-target bone appears if a frequency lower than 0.6 MHz is used. On the other hand, the overheating occurs in the region close to the acoustic window for frequency higher than 2.25 MHz. Figures 5b and c show the distributions of SAR ratio and temperature along the depth direction for those optimal cases in Fig. 5a.
Figure 6a provides the simulation results revealing that
the optimal ultrasound frequency is independent of the acoustic window size for a tumor located at a depth of 8 cm. According to this figure, the optimal frequency is main-tained at 1.2 MHz, but tends toward lower frequency for a smaller acoustic window. The maximum treatable tumor diameter is 4.1, 3.3, 2.4, and 1.3 cm for the acoustic window size of 12.5, 10, 7.5, and 5 cm, respectively. Figure 6b presents the temperature distributions for those optimal cases, showing that there is only a small variation of tem-perature rise in the post-target bone.
Domain of treatable tumor size and tumor depth
Figures 3d–f present the low bounds of SR(zt;0) and
SR(zt;zb) for an appropriate temperature distribution when
an external ultrasound hyperthermia for brain tumors is used. Low-frequency ultrasound can penetrate deeper and can cause an overheating in the post-target bone, while high frequency attenuates faster in the tissues and results in a high temperature close to the acoustic window. Hence, these figures show the low bounds of SR(zt;zb) and SR(zt;0) for
low and high ultrasound frequencies, respectively, and their values are of about 3, except in lower frequencies from 0.3 to 0.6 MHz. This indicates that we can analyze the relation-ship between the tumor conditions (zt, d[zt]) and the control
parameters (d[0], Q[0], frequency) based on SR(zt;zb) and
SR(zt;0). Equation 5 represents the relationship between
d(0), d(zt), zt, and ultrasound frequency based on SR(zt;0)
(SAR ratio at the tumor depth to that on the acoustic win-dow), while Eq. 10 shows the relationship between d(0), d(zt), zt, and frequency based on SR(zt;zb) (SAR ratio at the
tumor depth to that on the post-target bone).
Fig. 5. (a) Relationship between the treatable tumor size and ultrasound frequency obtained from the search method of Fig. 2 for d(0)⫽ 10 cm, R ⫽ 0, and zt⫽ 4, 6, or 8 cm.. (b–c) Distributions of SAR ratio and temperature for the maximum treatable tumor sizes at different depths. The vertical dashed-line at z ⫽ 16 cm represents the interface of brain tissue and post-target bone.
Fig. 6. (a) Relationship between the treatable tumor size and ultrasound frequency obtained from the search method of Fig. 2 for zt ⫽ 8 cm, R ⫽ 0, and d(0) ⫽ 5, 7.5, 10, or 12.5 cm. (b) Temperature distributions for the maximum treatable tumor sizes with different acoustic window sizes.
For practical hyperthermia treatment, the domain of treat-able tumor size and tumor depth must be known when an ultrasound frequency and an acoustic window are given. In other words, as the information of tumor size and tumor depth for a brain tumor patient is known, the appropriate frequency of the ultrasound transducer and the minimum acoustic window of the skull for the treatment must be estimated. Hence, Eqs. 5 and 10 are employed to investigate the domain of treatable tumor size and tumor depth. Figures 7a and b are obtained from Eqs. 5 and 10, respectively, for an ultrasound frequency of 1.2 MHz, SR(zt;0) and SR(zt;zb)
3, and acoustic window size from 5 to 12.5 cm. Both figures indicate that the maximum treatable tumor size increases with the acoustic window but decreases with the tumor depth. Figure 7c, the combination of Figs. 7a and b, displays the relationship between the treatable tumor size and tumor depth for different acoustic window sizes to fulfill the requirements of both acoustic window and post-target bone conditions. The region within each acoustic window curve is the domain formed by treatable tumor sizes and tumor depths. This finding suggests that a tumor whose size and depth located within this domain is treatable by using an ultrasound frequency of 1.2 MHz for the cases of SR(zt;0)
and SR(zt;zb) which are equal to 3. Figure 7c also indicates
the minimum size of acoustic window required to be chosen for a given tumor size and tumor depth. For a spherical tumor, the tumor center location and the tumor size are also required to meet the line, d(zt)⫽ 2zt, which means the tumor
depth is equal to the tumor radius. This finding suggests that the center of spherical tumor must be located within the house-like domain to be treated using the given acoustic window size.
To examine the effect of ultrasound frequency on the
domain of treatable tumor size and tumor depth, the acoustic attenuation of skull bone (b) listed in Table 1 is used, and
d(0), SR(zt;0), SR(zt;zb) in Eqs. 5 and 10 are taken as 10 cm,
3, and 3, respectively. Figure 8a depicts the treatable do-main for ultrasound frequencies from 0.6 to 1.8 MHz. The curve for each frequency is formed by two curves, repre-sented by Eqs. 5 and 10. All of the curves show that the treatable tumor diameter decreases with tumor depth. Un-like the acoustic window study, a larger acoustic window owns a larger treatable domain covering that owned by a smaller acoustic window, a higher frequency does not own a larger domain. Instead, these curves are a kind of mixture. The curve for 0.6 MHz owns the largest treatable tumor size for tumor depth shallower than 5 cm, and the curves for 0.8, 1.2, and 1.8 MHz denote the tumor which is located from 5 to 6.2 cm, 6.2 to 9.3 cm, and deeper than 9.3 cm, respec-tively.
The temperature distributions for points 1–8 in Figs. 7c and 8a are shown in Figs. 7d and 8b. The temperature peak in the post-target bone gets greater and shifts from the brain/bone interface to the deeper region of the bone for a lower frequency ultrasound. All temperature distributions fulfill the requirements except point 2 of Fig. 8a with a frequency of 0.6 MHz. This demonstrates that Eqs. 5 and 10, which are based on the SAR ratios, can be used to analyze the domain of treatable tumor size and tumor depth when appropriate values of SR(zt;0) and SR(zt;zb) are given.
However, more attention needs to be paid for low frequency ultrasound. By considering the practical clinical treatment (the tumor’s center is shallower than 8 cm) and the possi-bility of the overheating of post-target bone, the appropriate
Fig. 7. Domain of treatable tumor size and tumor depth when the acoustic window size varies from 5 to 12.5 cm for an ultrasound frequency of 1.2 MHz, R⫽ 0, and both SR(zt;0) and SR(zt;zb) equal to or greater than 3.0. (a) Curves for Eq. 5; (b) curves for Eq. 10; (c) curves to meet the requirements for both conditions (both SR(zt;0) and SR(zt;zb)ⱖ 3.0); and (d) temperature distributions for points 1–8 in (c). The left solid line in (c) is d(zt)⫽ 2zt.
Fig. 8. (a) Domain of treatable tumor size and tumor depth when ultrasound frequency varies from 0.6 to 1.8 MHz for d(0)⫽ 10 cm, R⫽ 0, and both SR(zt;0) and SR(zt;zb)ⱖ 3.0 in Eqs. 5 and 10; and (b) temperature distributions for points 1–8 in (a). The left solid line in (a) is d(zt)⫽ 2zt.
range of frequency to result in maximum treatable domain is between 0.8 and 1.2 MHz.
DISCUSSION
The above study investigates the optimal ultrasound fre-quency and the domain of treatable tumor size and tumor depth by using a search method based on a conical shape of convergent/divergent power deposition. This would result in a disk-shaped region with temperature higher than 43°C. To further examine the effect of tumor thickness on the distributions of temperature and SAR ratio, the tumor with a cylindrical segment of 3-cm diameter and 4-cm thickness and its center located at 6-cm deep is employed. The acous-tic window diameter is 10 cm, and two ultrasound frequen-cies are considered. Three scan planes, located at 4.5-, 6-, and 7.5-cm deep, have been used. Figure 9a shows the distributions of SAR ratio in the depth direction for 0.8 MHz with power weighting 23%, 24%, and 53% from the inner-most scan plane to the outerinner-most, and 1.2 MHz with 19%, 21%, and 60%. It reveals that the higher power weighting is used for the deeper scan plane. The figures indicate that (a) a uniform SAR ratio distribution within the tumor region and a sharp drop of the ratio outside the tumor region can be obtained; (b) the SAR ratio in the tumor region for 0.8 MHz is about 3.0, which is much higher than that for 1.2 MHz; (c) three ripple peaks in the tumor region indicate the three scan planes. Figure 9b presents the temperature distributions corresponding to Fig. 9a. The input power level is tuned to have the maximum temperature at the predetermined tumor
region to reach 44°C. Fig. 9b shows that an appropriate temperature for the treatment can be obtained—the temper-ature in the tumor region is higher than 43°C, the peak temperature in the post-target bone is below 41.5°C, and the temperature drop around the tumor boundary is sharp. While blood perfusion is a time-variational unknown during the hyperthermia treatment, feedback control algorithms (26, 27) can be employed to compensate for this factor.
Owing to the difference of the acoustic impedance of brain tissue and skull bone, part of the acoustic energy is reflected back to the brain tissue when the ultrasound beam propagates through the interface of brain tissue and post-target bone. This reflection will result in less ultrasound energy penetrating into the post-target bone and affect the temperature distribution, especially in the region around the interface. Figures 10a and b are the distributions of SAR ratio and temperature when d(zt), zt, and ultrasound
fre-quency of the peak values in Fig. 5a are used, and R (the energy ratio of reflected ultrasound) is taken as 0.3 (30% of the ultrasound energy reflected back to the brain tissue). The results obviously show that the peaks of SAR ratio at the interface and the temperature in the bone region are signif-icantly reduced, while those in the other regions have trivial changes (compared with Figs. 5b and c). This indicates that the assumption of ultrasound totally penetrating into the post-target bone is conservative for the temperature rise in the post-target bone (28).
CONCLUSION
The above study of brain tumor hyperthermia employs a simplified model of ultrasound power deposition and a
Fig. 9. Distributions of SAR ratio and temperature for a 3-cm diameter by 4-cm thickness cylindrical tumor located at 6-cm deep, while d(0)⫽ 10 cm, R ⫽ 0, and three scan planes located at 4.5-, 6-, and 7.5-cm deep were used. The power weighting for the scan planes is 23%, 24%, and 53% for frequency 0.8 MHz, and 19%, 21%, and 60% for 1.2 MHz. The input power level is tuned to have the maximum temperature in the tumor 44°C.
Fig. 10. Distributions of SAR ratio and temperature for the peaks of treatable tumor size in Fig. 5a with R⫽ 0.3, while d(0), zt, d(zt), and ultrasound frequency are maintained the same and the input power level is tuned to have the maximum temperature 45°C.
search algorithm to investigate the optimal frequency of ultrasound transducer as well as the domain of treatable tumor size and tumor depth.
Simulation results demonstrate to select the appropriate ultrasound frequency for a set of given tumor conditions. These results also indicate the domain of treatable tumor size and tumor depth for a given acoustic window and ultrasound frequency.
Findings of this study can be used as a guideline (a) to determine whether or not the tumor is treatable; (b) to select
the optimal frequency for ultrasound transducer and the minimum portion of skull to take off (minimum acoustic window) for a treatment, while the tumor size and tumor depth are known during the clinical treatment; and (c) to design an appropriate ultrasound heating system for brain tumors. These treatable domain and optimal ultrasound fre-quency are the initial results that could be used for addi-tional modeling, including the arrangement of transducer parameters, power control to meet the blood perfusion vari-ation, etc.
REFERENCES
1. Quan KM, Watmough DJ, Mallard JR. Theoretical consider-ations in relation to the treatment of brain tumors of local hyperthermia generated by ultrasound fields. Eur J Surg Oncol 1991;17:454–465.
2. Hynynen K, Roemer RB, Anhalt D, et al. A scanned focused multiple transducer ultrasonic system for localized hyperther-mia treatments. Int J Hypertherhyperther-mia 1987;21–35.
3. Guthkelch AN, Carter LP, Cassady JR, et al. Treatment of malignant brain tumors with focused ultrasound hyperthermia and radiation: Results of a phase I trial. J Neurooncol 1991; 10:271–284.
4. Lin W-L, Yen J-Y, Chen Y-Y, et al. Relationship between acoustic aperture size and tumor conditions for external ultra-sound hyperthermia. Med Phys 1999;26:818–824.
5. Dutton AW, Roemer RB, Gibbs FA. A clinically integrated scanned focused ultrasound hyperthermia. Proceedings of the 7th International Congress on Hyperthermic Oncology, Rome, Italy, 1996. Vol. 1, p. 92.
6. Lin W-L, Roemer RB, Moros EG, et al. Opitimization of temperature distribution in scanned, focused ultrasound hy-perthermis. Int J Hyperthermia 1992;8:61–78.
7. Lin W-L, Chen Y-Y, Lin S-Y, et al. Optimal configuration of multiple-focused ultrasound transducers for external hyper-thermia. Med Phys 1999;26:2007–2016.
8. Cain CA, Umemura S. Concentric-ring and sector vortex phased array applicators for ultrasound hyperthermia therapy.
IEEE Trans Microwave Theory Tech 1986;34:542–551.
9. McGough RJ. An optimal heating strategy for deep hyperther-mia with ultrasound phased arrays. Proceedings of the 7th International Congress on Hyperthermic Oncology, Rome, Italy, 1996. Vol. II, p. 564–567.
10. Moros EG, Roemer RB, Hynynen KH. Pre-focal plane high temperature regions induced by scanning focused ultrasound beams. Int J Hyperthermia 1990;6:351–366.
11. Goss SA, Johnson RL, Dunn F. Comprehensive compilation of empirical ultrasonic properties of mammalian tissues. J
Acoust Soc Am 1978;64:423–457.
12. Goss SA, Johnson RL, Dunn F. Compilation of empirical ultrasonic properties of mammalian tissues, II. J Acoust Soc
Am 1980;68:93–108.
13. Hynynen K. Biophysics and technology of ultrasound hy-perthermia. In: Gautherie M, editor. Method of external hyperthermic heating. Berlin: Springer-Verlag; 1990. p. 61– 116.
14. Pennes HH. Analysis of tissue and arterial blood temperatures in the resting human forearm. J Appl Phys 1948;1:93–122. 15. Arkin H, Xu X, Holmes KR. Recent developments in
model-ing heat transfer in blood perfusion tissues. IEEE Trans
Biomed Eng 1994;41:97–107.
16. Chato JC. Fundamentals of bioheat transfer. In: Gautherie M, editor. Thermal dosimetry planning. Berlin: Springer-Verlag; 1990. p. 1–56.
17. Roemer RB. Thermal dosimetry. In: Gautherie M, editor. Thermal dosimetry planning. Berlin: Springer-Verlag; 1990. p. 119 –214.
18. NCRP Report No.113. Exposure criteria for medical diagnos-tics ultrasound. I. Criteria based on the thermal mechanisms. Bethesda, MD: NCRP Publication; 1992. p. 52–60.
19. Nyborg WL. Solutions of the bio-heat transfer equation. Phys
Med Biol 1988;33:785–792.
20. Bowman HF. Heat transfer mechanism and thermal dosimetry.
J Natl Cancer Inst 1981;61:437–445.
21. Chato JC. Selected thermophysical properties of biological materials. In: Shitzer A, Eberhart RC, editors. Heat transfer in medicine and biology, analysis and applications. New York: Plenum; 1985. p. 413–418.
22. Gordon RG, Roemer RB, Horvath SM. A mathematical model of the human temperature regulatory system—transient cold exposure response. IEEE Trans Biomed Eng 1976;23:434– 444.
23. Sekins KM, Emery AF. Thermal science for physical medi-cine. In: Lehmann JF, editor. Therapeutic heat and cold. Baltimore: Williams and Wilkins; 1982. p. 70 –132.
24. Jain RK. Bioheat transfer: Mathematical models of thermal systems. In: Storm FK, editor. Hyperthermia Cancer Therapy. Boston: Hall; 1983. p. 9 – 46.
25. Ferziger JH. Numerical methods for engineering applications. New York: Wiley; 1981.
26. Chen Y-Y, Lin W-L, Liou H-L, et al. Self-tuning fuzzy logic control for ultrasound hyperthermia with reference tempera-ture based on objective functions. Med Phys 1999;26:825– 833.
27. Hutchinson E, Dahleh M, Hynynen K. The feasibility of MRI feedback control for intracavitary phased array hyperthermia treatments. Int J Hyperthermia 1998;14:39–56.
28. Tu SJ, Hynynen K, Roemer RB. Simulation of bi-directional ultrasound hyperthermia treatments of neck tumors. Int J