Short communication
Measurement of dimensions of pentagonal doughnut-shaped C-reactive
protein using an atomic force microscope and a dual polarisation
interferometric biosensor
Shiming Lin
a,b,∗, Chih-Kung Lee
b, Yu-Ming Wang
b, Long-Sun Huang
b, Yin-Hang Lin
c,
Shih-Yuan Lee
c, Bor-Ching Sheu
d, Su-Ming Hsu
eaCentre for Optoelectronic Biomedicine, National Taiwan University, College of Medicine, 1-1 Jen-Ai Road, Taipei 100, Taiwan bInstitute of Applied Mechanics, National Taiwan University, Taipei, Taiwan
cDepartment of Chemistry, Tamkang University, Tamsui, Taiwan
dDepartment of Obstetrics and Gynecology, National Taiwan University, Taipei, Taiwan eInstitute of Pathology, National Taiwan University, Taipei, Taiwan
Received 23 October 2005; received in revised form 20 December 2005; accepted 12 January 2006 Available online 28 February 2006
Abstract
In order to develop the C-reactive protein (CRP) sensor chips for clinical detection of atherosclerosis and coronary heart disease, we used an atomic force microscope (AFM) and a dual polarization interferometric (DPI) biosensor to probe the surface ultrastructure and to measure the dimensions of CRP. A single pentagonal structure was directly visualized by AFM, and quantitative measurements of the dimensions of the protein were provided. The average height calculated for each pentagonal CRP particle was approximately 3.03± 0.37 nm, which basically corresponds to that (36 ˚A in protomer diameter) previously obtained from the structure of CRP determined by X-ray crystallography. Moreover, a experiment using dual polarization interferometric (DPI) as a biosensor was then performed, and the average monolayer thickness value (3.18± 0.43 nm) that was calculated basically corresponds to that obtained from the experimental value (3.03± 0.37 nm) of the height measured by an AFM method for CRP. Further investigations will be performed to study the surface ultrastructure of a single pentagonal CRP molecule, and for this purpose a CRP sample (at low concentration) was scanned in vacuum by AFM. The higher-resolution images clearly revealed the presence of doughnut-shaped CRP molecules. In addition, phase images of CRP molecules were captured simultaneously with their height images, and the lateral dimensions of the doughnut-shaped CRP molecules were then measured. It was found that the average values calculated for the outer diameter (11.13± 1.47 nm) and pore diameter (3.52± 0.42 nm) are respectively close to those (102 ˚A in outer diameter and 30 ˚A in pore diameter) previously obtained from the structure of CRP determined by X-ray crystallography. This study represents the first direct characterization of the surface ultrastructure and dimensional measurement of the CRP molecule on the sensor chip.
© 2006 Elsevier B.V. All rights reserved.
Keywords: Dual polarization interferometry; Atomic force microscopy; C-reactive protein
1. Introduction
A number of epidemiologic studies have shown that acute-phase reactant C-reactive protein (CRP) is an important risk factor for atherosclerosis and coronary heart disease (Volanakis, 2001; Blake et al., 2003; Tracy, 2003). CRP has also proved useful as prognostic indicator in acute coronary syndromes and
∗Corresponding author. Tel.: +886 2 23123456x8458; fax: +886 2 23949125.
E-mail address: [email protected] (S. Lin).
in predicting future cardiovascular events in apparently healthy men and women (Benzaquen et al., 2002; Blake et al., 2003). CRP is a homopentamer composed of five noncovalently asso-ciated protomers arranged symmetrically around a central pore (Motie et al., 1996). The overall dimensions of the CRP pentamer are about 102 ˚A outside diameter with a central pore diameter of 30 ˚A and a protomer diameter of 36 ˚A (Shrive et al., 1996; Thompson et al., 1999). However, no previously reported studies have visualized the native pentagonal CRP. Quantitative obser-vations are needed for the measurement of CRP dimensions for the purpose of developing clinical CRP sensor chips to predict 0956-5663/$ – see front matter © 2006 Elsevier B.V. All rights reserved.
324 S. Lin et al. / Biosensors and Bioelectronics 22 (2006) 323–327
the risk of future cardiovascular events. Thus, our aim in this study was to measure the actual dimensions and shape of a native pentameric CRP using an atomic force microscope (AFM) and a dual polarization interferometric (DPI) biosensor, concentrat-ing on measurements of the actual diameters and heights of CRP subunits.
AFM, a nanoresolution technique needing no complex prepa-ration procedure for biological samples (Binning and Quate, 1986), has proved to be a suitable approach to imaging of native biomembranes (Czajkowsky et al., 2004; Shahin et al., 2005) and single biomolecules (Sitko et al., 2003; Kuznetsov et al., 2005). DPI, a new optical biosensor developed recently, has been intro-duced for the study of protein adsorption (Cross et al., 2003; Lu et al., 2004; Armstrong et al., 2004) and the evaluation of changes in protein structure (Swann et al., 2004). Differences in the waveguide mode dispersion between the transverse mag-netic (TM) and transverse electric (TE) modes can allow unique solutions for thickness and density of adsorbed proteins to be determined at all stages during the formation process (Cross et al., 2003, 2004; Worth et al., 2001).
Here, we extended the use of AFM and DPI biosensing tech-nique to the field of single molecular imaging of CRP. We used AFM to measure the three dimensions of CRP and observe their topography and surface ultrastructure and DPI to measure the average monolayer thickness of CRP. This study provides a new approach to the measurement of dimensions of pentago-nal doughnut-shaped CRP for future application in clinical CRP sensor chips.
2. Methods
2.1. AFM analysis
For AFM studies, CRP (0.01− 1 g/ml) in distilled water was attached through physical adsorption by placing in con-tact with a freshly cleaved mica. After cleaning the mica with methanol and distilled water, a drop of CRP solution was applied and incubated for 5 min at room temperature, fol-lowed by washing with distilled water (50l, 3×) and dry-ing in air prior to the AFM experiments. Various concen-trations of CRP (0.01− 1 g/ml) adsorbed on the mica were scanned by use of an SPA-300HV scanning probe micro-scope controlled by an SPI 3700 probe station unit (Seiko Instruments Inc., Chiba, Japan). Commercial silicon cantilevers SuperSharpSiliconTM SSS-SEIH (NANOSENSORS GmbH & Co. KG, Wetzlar-Blankenfeld, Germany) with a spring constant of 9 N/m were used for tapping modes in air. Tips were 225m long and had typical resonant frequencies between 110 and 150 kHz. Tapping mode (intermittent contact) was used, which involved maintaining a high amplitude set point relative to the free amplitude of the cantilever. At least six high-quality images were captured at 0.05g/ml concentration of CRP, and one image was selected from these for presentation. Phase images were captured simultaneously with height (topographic) images. Height images reveal the surface topography and are more accu-rate than phase images in detailing the height of features on the surface. Phase images have proved to yield better resolution in
detailing the lateral dimensional data of surface features ( Kopp-Marsaudon et al., 2000).
2.2. DPI analysis
The adlayer dimension of CRP on the aminated silicon was measured in real time with an AnaLight® Bio200 dual polar-ization interferometer (Farfield Sensors Ltd, Salford, UK). The fundamental science underpinning this instrumentation has been described elsewhere (Cross et al., 2004; Lu et al., 2004). The phase changes in, say, transverse magnetic (TM) polarization were deduced from the distance of the fringe movement. A second measurement was provided by introducing a second polarization of light, in this case the transverse electric (TE) polarization, at right angles to the first, into the stack. This responded differently to CRP protein adsorption, providing an independent second measurement. By use of classical optical theory, the two measurements in terms of the thickness and density of the adsorbed protein film were interpreted. With this technique, measurements were made to sub-atomic resolutions (typically to 0.01 nm) in CRP thickness in real time. Data gen-erated by the instrument were transferred, in real time, to a PC, where the data was viewed in real time and manipulated to pro-vide thickness and surface concentration measurements.
3. Results and discussion
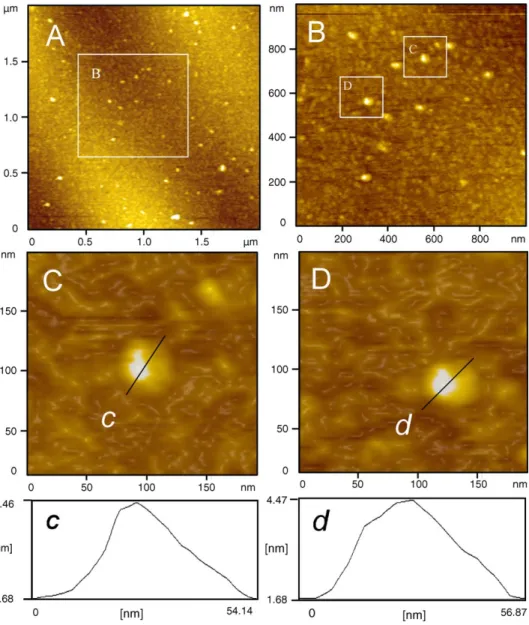
3.1. Each single CRP particle is readily distinguishable The detailed surface topographies of the native CRP molecules on the substrate were studied by use of an AFM (Fig. 1).Fig. 1A–D shows the AFM height images of the native CRP molecules on the mica. InFig. 1A, the substrate surface was uniformly covered with a number of spherical particles in air. An image acquired by zooming into the boxed area ofFig. 1A is displayed inFig. 1B. This higher-resolution image clearly shows that many individual spherical particles exist on the surface. Two images acquired by zooming into two boxed areas ofFig. 1B are displayed inFig. 1C and D, and the corresponding cursor profiles (Fig. 1c and d) clearly reveal that each single particle is read-ily distinguishable. The corresponding cursor profile provides quantitative measurements of the heights of the CRP particles on the surface. The profiles inFig. 1c and d show that the measured heights of CRP particles are 2.78 and 2.79 nm, respectively. More than 20 single CRP particles were then examined. The sur-face traces were reproducible, although some variations existed in the height of each single CRP particle. The average height of CRP particles calculated was approximately 3.03± 0.37 nm, which basically corresponds to that (36 ˚A in protomer diame-ter) previously obtained from the structure of CRP determined by X-ray crystallography (Shrive et al., 1996; Thompson et al., 1999).
3.2. CRP is a pentagonal doughnut-shaped CRP molecule In a previous study, a typical CRP molecule showed a pen-tamer composed of five noncovalently associated protomers
Fig. 1. Topographic images of the native CRP molecules scanned in air with AFM. The scanning areas are 2m × 2 m and 1 m × 1 m for the low-(A) and high-(B) resolution images, respectively. Two images acquired by zooming into the boxed areas of B are displayed in C and D, respectively. The high-resolution images (C and D) and their corresponding cursor profiles (c and d) clearly reveal the presence of CRP molecules.
arranged around a central pore, and thus it exists as a doughnut-shaped molecule (Motie et al., 1996), as displayed inFig. 2A. To investigate further the surface ultrastructure of a single pentago-nal CRP molecule, we scanned of CRP samples at very low con-centration (0.05g/ml) in vacuum (10−2–10−3Torr) with AFM. An AFM height image (scanning area 2m × 2 m) of CRP molecules is displayed inFig. 2B. The image reveals that some individual protrusions with a doughnut-shaped appearance, as indicated by arrows, are readily distinguishable and are simi-lar to those found previously by electron microscopy (Motie et al., 1996). A higher-resolution (scanning area 100 nm× 100 nm) height image (Fig. 2C) was obtained by zooming into the boxed areas displayed inFig. 2B. The higher-resolution image clearly reveals the presence of a doughnut-shaped CRP molecule. In addition, a phase image (Fig. 2D) was captured simultaneously with its height image (Fig. 2C), and it more clearly revealed the presence of a pentagonal CRP molecule. Moreover, the corresponding cursor profile shown in Fig. 2d indicates that
the lateral dimensions of the doughnut-shaped CRP molecule can be measured and were found to be about 10.43 nm outside diameter (red lines) and 3.77 nm central pore diameter (green lines). In phase imaging, the phase shift of the oscillating can-tilever is measured as a function of the tip position on the surface. Height images reveal the surface topography and are more accurate than phase images in detailing the height of fea-tures on the surface. Phase images have proved to yield better resolution in detailing the lateral dimensional data of surface features (Kopp-Marsaudon et al., 2000), but because the dif-ferent factors that cause a phase shift cannot be separated, the interpretation of phase images can be much more difficult. How-ever, phase imaging is useful as a complement to topographic imaging for providing information on the lateral dimensions of protein molecules. In this study, more than 10 single CRP molecules were then examined, and the average values calcu-lated in two lateral dimensions (outer diameter and pore diam-eter) of CRP molecules were approximately 11.13± 1.47 nm
326 S. Lin et al. / Biosensors and Bioelectronics 22 (2006) 323–327
Fig. 2. (A) The pentagonal structure of CRP viewed down the five-fold symmetry axis. (B) A topographic (height) image of the native CRP molecules scanned in vacuum with AFM. Height image and phase image acquired by zooming into the boxed area of B are displayed in C and D, respectively. The height image (C) reveals the presence of a doughnut-like CRP molecule. The phase image (D) reveals the presence of a pentagonal CRP molecule. The corresponding cursor profile displayed in (d) clearly indicates that the lateral dimensions of a doughnut-like CRP molecule can be measured and were found to be about 10.43 nm outside diameter (red lines) and 3.77 nm central pore diameter (green lines).
and 3.52± 0.42 nm, respectively. Moreover, it was found that the average values of the outer diameter (11.13± 1.47 nm) and pore diameter (3.52± 0.42 nm) are respectively close to those (102 ˚A in outside diameter and 30 ˚A in pore diameter) previ-ously obtained from the structure of CRP determined by X-ray crystallography (Shrive et al., 1996; Thompson et al., 1999). 3.3. Measurement of the average monolayer thickness of CRP by DPI
To be able to validate the results obtained with this AFM approach, we also measured the average thickness of the CRP monolayer by a dual polarization interferometric biosensor (Cross et al., 2003, 2004; Lu et al., 2004). Both the TM and TE phase response obtained from the CRP experiment are shown
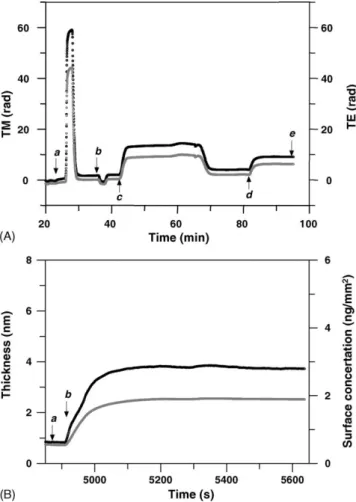
inFig. 3A. The first measurement is the calibration of the DPI slab waveguide sensor chip which following the 80% ethanol (point a) and distilled water (point b) added to get the exact thickness and refractive index of the sensor layer. Phosphate buffer solution (PBS), pH 7.2, providing a known refractive index 1.335, was passed over the chip until a stable baseline of phase (TM and TE) was achieved. The layer thickness increased by 0.88 nm after 4% glutaraldehyde (point c) activated the aminated surface. Then, 100g/ml CRP was flowed over and immobilized on the chip surface (point d), and the CRP layer was stabilized (point e). A simultaneous thickness measurement of CRP was resolved from the raw-phase data (Fig. 3A, point d–e) for CRP immobilization, as displayed inFig. 3B. Point a indicates the layer condition after the surface was functionalized by 4% glutaraldehyde and point b indicates the addition of
Fig. 3. (A) Raw phase data for the immobilization of CRP molecules to a dual waveguide sensor chip surface (black line denotes TM response and dotted line denotes TE response). Points a and b indicate addition of 80% ethanol and dH2O, respectively, for chip calibration. Point c indicates the addition of 4%
glutaraldehyde to activate the aminated chip surface, and point d indicates the addition of CRP. (B) Thickness and surface concentration measurement of CRP monolayer immobilized on the sensor chip (black line denotes thickness and dotted line denotes surface concentration). Point a indicates the layer condition after the surface was functionalized by 4% glutaraldehyde and point b indicates the addition of 100g/ml CRP to the chip surface. The monolayer thickness and surface concentration of the CRP after immobilization were observed to increase by approximately 2.85 nm and 1.29 ng/mm2, respectively.
100g/ml CRP to the chip surface. The layer thickness of the CRP after immobilization was observed to increase by 2.85 nm, whereas the surface concentration of CRP layer was observed to increase by 1.48 ng/mm2 (or 1.29× 10⁻¹⁴mols/mm2), which is equivalent to an area per molecule of 128 nm2. The area per molecule of about 128 at the CRP was close to what would be expected for a monolayer (about∼125 nm2/molecule) of CRP. Thus, the CRP was bound in a viable orientation with a mono-layer thickness on the aminated surface. Three experiments were
performed, and the average monolayer thickness value was cal-culated to be 3.18± 0.43 nm. This value basically corresponds to that obtained from the experimental value (3.03± 0.37 nm) of height as measured with an AFM method for CRP.
4. Conclusions
A single pentagonal and doughtnut-shaped structure was directly visualized by AFM, and measurements of the dimen-sions of the protein were provided by AFM and DPI. The physical measurements of the outer diameter, pore diameter, and protomer diameter in the pentagonal CRP by AFM and DPI may suggest how to recognize CRP molecules on the sen-sor chip. Unraveling the molecular ultrastructure and measuring the dimensions of CRP may provide new directions for future application in clinical CRP sensor chips for the detection of atherosclerosis and coronary heart disease.
References
Armstrong, J., Salacinski, H.J., Mu, Q., Seifalian, A.M., Peel, L., Free-man, N., Holt, C.M., Lu, J.R., 2004. J. Phys.: Condens. Matter 16, S2483–S2491.
Benzaquen, L.R., Yu, H., Rifai, N., 2002. Crit. Rev. Clin. Lab. Sci. 39, 459–497.
Binning, G., Quate, C.F., 1986. Phys. Rev. Lett. 56, 930–933.
Blake, G.J., Rifai, N., Buring, J.E., Ridker, P.M., 2003. Circulation 108, 2993–2999.
Cross, G.H., Reeves, A.A., Brand, S., Popplewell, J.F., Peel, L.L., Swann, M.J., Freeman, N.J., 2003. Biosens. Bioelectron. 19 (4), 383–390.
Cross, G.H., Reeves, A., Brand, S., Swann, M.J., Peel, L.L., Freeman, N.J., Lu, J.R., 2004. J. Phys. D: Appl. Phys. 37, 74–80.
Czajkowsky, D.M., Hotze, E.M., Shao, Z., Tweten, R.K., 2004. EMBO J. 23, 3206–3215.
Kopp-Marsaudon, S., Lecl`ere, Ph., Dubourg, F., Lazzaroni, R., Aim´e, J.P., 2000. Langmuir 16, 8432–8437.
Kuznetsov, Y.G., Daijogo, S., Zhou, J., Semler, B.L., McPherson, A., 2005. J. Mol. Biol. 347, 41–52.
Lu, J.R., Swann, M.J., Peel, L.L., Freeman, N.J., 2004. Langmuir 20, 1827–1832.
Motie, M., Brockmeier, S., Potempa, L.A., 1996. J. Immunol. 156, 4435–4441. Shahin, V., Albermann, L., Schillers, H., Kastrup, L., Schafer, C., Ludwig, Y.,
Stock, C., Oberleithner, H., 2005. J. Cell. Physiol. 202, 591–601. Shrive, A.K., Cheetham, G.M.T., Holden, D., Myles, D.A., Turnell, W.G.,
Volanakis, J.E., Pepys, M.B., Bloomer, A.C., Greenhough, T.J., 1996. Nat. Struct. Biol. 3, 346–354.
Sitko, J.C., Mateescu, E.M., Hansma, H.G., 2003. Biophys. J. 84, 419–431. Swann, M.J., Peel, L.L., Carrington, S., Freeman, N.J., 2004. Anal. Biochem.
329 (2), 190–198.
Thompson, D., Pepys, M.B., Wood, S.P., 1999. Structure 7, 169–177. Tracy, R.P., 2003. Int. J. Obes. 27, S29–S34.
Volanakis, J.E., 2001. Mol. Immunol. 38, 189–197.
Worth, C., Goldberg, B.B., Ruane, M., ¨Unl¨u, M.S., 2001. IEEE J. Sel. Top. Quant. Electron. 7 (6), 874–877.