and coercivity of the film occurred at a film composition of Fe50Pt50with thickness of about 200 nm
after annealing at 600 °C for 30 min. The analyses of transmission electron microscopy diffraction patterns indicated that this annealed Fe50Pt50film was nearly entirely in the fctg1-FePt phase. The
average grain size of this Fe50Pt50film was about 85 nm. The grain size was almost independent of
the cooling rate after annealing, but the magnetic hardening mechanism and coercivity of the annealed film was largely dependent on the cooling rate. © 1999 American Institute of Physics.
@S0021-8979~99!01404-8#
I. INTRODUCTION
FePt compound alloy has received significant attention because it has very high magnetocrystalline anisotropy en-ergy (Ku>73107erg/cm3), high coercivity, good corrosion resistance, and large energy products (BH)max.1 It suits for applying in magnetic recording media, permanent magnets such as magnetic bias films of magnetoresistive elements, microelectronic mechanics, and magnetic tips of magnetic force microscopy. Yung et al.2and Aboaf et al.3have inves-tigated large in-plane coercivity FePt thin films prepared by dc and rf sputtering. Early investigations have shown that the magnetic properties of FePt alloy are sensitive to process parameters.1–4
In this article, the FePt film is deposited on natural-oxidized silicon wafer substrate at room temperature. The effects of magnetic layer thickness, annealing temperature and annealing time on the magnetic properties parallel and normal to the Fe1002xPtx film plane are investigated. The as-deposited film is fcc g-FePt phase. A Fe50Pt50 film with
high in-plane coercivity and squareness~i.e., Mr/ Ms) is pro-duced after annealing at 600 °C for 30 min in vacuum. This film is nearly single phase of fct g1-FePt phase which is
precipitated from fccg-FePt phase. No antiphase boundaries
~APBs! and twins4–6
are observed in this film. Coercivities of the films with different cooling rates after annealing are com-pared to clarify the origin mechanism of the coercivity. II. EXPERIMENT
Fe1002xPtx (x525– 67) alloy thin films were produced by dc magnetron sputtering system onto natural-oxidized silicon wafer substrates at room temperature. The substrate was rotated in order to get uniform composition. Rotating rate of the substrate was 75 rpm. A mosaic target consisting
of high purity iron disk ~99.99%! overlaid with high purity platinum pieces ~99.99%! was used. This arrangement pro-vides a wide range of effective target compositions and therefore film compositions. The deposition rate was about 0.3 nm/s.
With 2 in. diameter sputtering gun, applied dc power source was set at 40 W. The base pressure in the sputter chamber was 531027 Torr, and after the high purity argon gas was introduced, sputter pressure was fixed at 5 mTorr. Film thickness was varied from 10 to 700 nm. The as-deposited film was sealed in quartz capsule then postan-nealed in vacuum of 131026 Torr.
The magnetic properties of the films were measured with vibrating sample magnetometer~VSM! and superconducting quantum interference device ~SQUID! at room temperature and their maximum applied fields were 12 and 50 kOe, re-spectively. The microstructure of the film was characterized by JOEL 100CX transmission electron microscopy ~TEM!, and phases of the film were examined by x-ray diffracto-meter with Cu Ka radiation. The average grain size of the film was measured by the TEM bright field image. The com-position and homogeneity of the films were determined by energy disperse x-ray diffractometer~EDX!. The thicknesses of the films were measured by aastep.
III. RESULTS AND DISCUSSION
Here, we change FePt composition, film thickness, an-nealing temperature, and anan-nealing time to examine the variation of magnetic properties parallel and normal to the film plane.
A. As-deposited films
Figure 1 shows the relationship between saturation mag-netization Ms in-plane coercivity Hci, perpendicular coer-civity Hc' and Pt content of the as-deposited FePt film at
a!Electronic mail: [email protected]
2264
room temperature. The film thicknessdis 200 nm. It can be seen that the Msvalue decreases with increasing Pt content. As Pt content of the film equals to 25 at. %, Msvalue of the film is about 940 emu/cm3. When Pt content is increased to 67 at. %, Ms value of the film decreases to about 610 emu/cm3. The decrease of Ms with increasing Pt content is due to that Msvalue of the film is diluted by Pt atoms.
2
The variations of Hciand Hc'with Pt content are small, and Hci is always lower than Hc' for the same Pt content. Hci is lower than 175 Oe and Hc'is lower than 625 Oe for the Pt content between 25 and 67 at. %. Although these as-deposited films are soft magnetic g-FePt phase,4large inter-nal stresses contribute to their coercivity. These interinter-nal stresses will make the as-deposited film with high Pt content produces some microcracks,2 but we find that these micro-cracks disappeared after annealing.
Typical TEM bright field image and diffraction pattern of as-deposited FePt film are shown in Fig. 2. Figure 2~a! is the TEM photograph of as-deposited Fe50Pt50 film. We can
see that it is polycrystalline. If we examine it in detail, aver-age grain size is very small and it is about 5 nm. The bright curve lines in the photograph are microcracks. The diffrac-tion pattern of Fig. 2~b! indicates that this film is fccg-FePt phase.
B. Post-annealed films
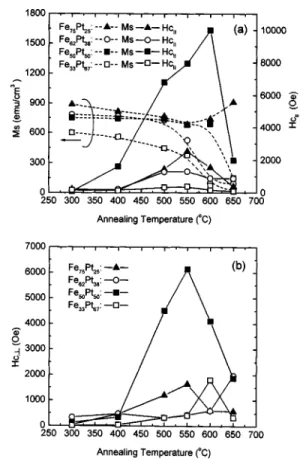
Figure 3~a! shows the relationships among Ms, Hci, Pt content and annealing temperature Tan of annealed
Fe1002xPtx(x525, 38, 50, and 67! films. The annealing time
tanis 30 min and the film thickness is 200 nm. We can see that the maximum Hci is lower than 2.5 kOe when Pt con-tents of the films are 25, 38, and 67 at. %. However, the Hci of Fe50Pt50film is higher than 7 kOe as Tanis in the range of 550 and 600 °C. The maximum Hci of the Fe50Pt50 film is about 10 kOe which occurs at annealing temperature of 600 °C. Msvalues of the films always decrease with increas-ing Tanexcept the Fe75Pt25film. For the Fe75Pt25film, the Ms value is decreased with increasing Tan as Tan,550 °C and
increased with increasing Tanas Tan.550 °C. Its Msvalue is about 910 emu/cm3 when Tan5650 °C. From x-ray diffrac-tion patterns of the Fe75Pt25films, we find that the increase of Ms with Tan as Tan.550 °C is due to that the presence of
a-Fe phase in the film.2By the observation of x-ray diffrac-tion patterns, Fe3Pt phase and FePt3 phase are not found in the low Pt and high Pt content films, respectively. From Fig. 3~b!, we can see that the relationship between Hc'and Tanis
FIG. 3. ~a! Variations of Msand Hciwith annealing temperature. Pt
con-tents of the films are 25, 38, 50, and 67 at. %, respectively.~b! Variations of
Hc' with annealing temperature. The film thickness is 200 nm and the
annealing time is 30 min. FIG. 1. Variations of Msand Hcwith Pt content of as-deposited Fe1002xPtx
films at room temperature. Pt content of the film is varied from 25 to 67 at. % and the film thickness is 200 nm.
FIG. 2. TEM micrograph and electron diffraction pattern of the as-deposited Fe50Pt50film.~a! is the TEM microstructure and ~b! its electron diffraction
similar to the relationship between Hci and Tanof Fig. 3~a!, but Hc' of the film is always lower than its Hci. This indi-cates that these films all have in-plane magnetic anisotropy. Maximum Hc' is occurred at Tan5550 °C for the Fe50Pt50 film, it is about 6 kOe. The increase of Hciand Hc'with Tan as Tan.400 °C is due to the increase of the amount of fct
g1-FePt phase which is transformed from the fcc g-FePt
phase in the film.2,7The fct g1-FePt phase has a high
mag-netocrystalline anisotropy constant. As Tan.600 °C, the de-crease of Hci with Tanis due to the growth of grain size and
the chemical interaction of FePt layer with Si substrate. The depth profiles of the films with different annealing tempera-tures examined by Auger electron spectrometer ~AES! con-firm that the chemical interaction of FePt layer with Si sub-strate is heavily as Tanis higher than 600 °C. The results of
AES analysis will be published elsewhere.
Figure 4 shows the relationships among the magnetic properties, average grain size, and annealing time tanof the
Fe50Pt50 film which annealed at 600 °C. The average grain
size is achieved by TEM observation. It indicates that Hci increases gradually with tanfrom 8.4 kOe for tan55 min to
10 kOe for tan530 min then decreases quickly with increas-ing tan. As tanlonger than 60 min, Hci decreases to about 600 Oe. However, grain size D of the annealed film always increases with tan. It can be seen that D585 nm for tan 530 min and D5103 nm as tan5120 min. Saturation
mag-netization Ms always decreases with increasing tan.
The relationship between Hc'and tanis similar to that of
Hci, but Hc' is always lower than Hci. Hc'is close to Hci as tan longer than 40 min. This indicates that the in-plane magnetic anisotropy of the Fe50Pt50 film is gradually de-stroyed by increasing tan. Yung et al.2 and Watanabe8 re-ported that origin of the high coercivity of FePt alloy is related to the degree of the imperfection of fct g1-FePt
phase. Because imperfection fcc g1-FePt phase will cause
the pinning of magnetic domain wall motion. Lower Tanand
shorter tancannot transform fccg-FePt phase to fctg1-FePt
phase. However, higher Tanand longer tanwill make the fct
g1-FePt phase more perfect and grain growth. Only suitable
heat-treatment conditions can get large amount of imperfect fct g1-FePt phase, single-domain grain size, and maximum
coercivity. The grain size of the fct g1-FePt phase is
in-creased with increasing Tanand tan. As grain size is larger
than single-domain size, coercivity of the film decreases rap-idly. From Fig. 4, we can see that the coercivity of the film is decreased rapidly as grain size is larger than 90 nm. Wa-tanabe et al.4 predicted that the critical diameter of single-domain particle of fct Fe50Pt50 phase was 600 nm, and the
diameter limit of superparamagnetic behavior was 3 nm. However, from the relationship between the coercivity and the grain size of Fig. 4, we speculate that the critical diam-eter of single-domain particle of the fct Fe50Pt50 phase may
be about 90 nm.
Figures 5~a! and 5~b! are TEM bright field image and electron diffraction pattern of post-annealed Fe50Pt50 film. It
reveals that this film is fctg1-FePt phase and its grain shape
is spherical. Comparing Figs. 5~a! and 2~a! we can see the growth of grains after postannealing. The grain size of the as-deposited film is about 5 nm and it increases to about 85 nm after 600 °C, 30 min annealing. The superlattice reflec-tions in the electron diffraction pattern of Fig. 5~b! indicate the formation of L10 orderedg1-FePt phase.
According to Tanaka et al.,6 single-domain size grains, APBs in the grain, and the interfaces between different ori-entation variants will effectively work as pinning sites against magnetic domain wall motion for bulk FePt alloy. Although APBs is not observed in our annealed Fe50Pt50film @see Fig. 5~a!#, the grain boundaries and interfaces of fcc/fct
phases in the film may act as a role of pinning sites of APBs. It is well known that the fcc g-FePt phase of as-deposited film is nucleation site of the fctg1-FePt phase. It is difficult
to transform the fcc g-FePt phase in the film to fct g1-FePt
phase completely by heat treatment.
Figure 6~a! shows the variation of the in-plane and out-plane coercivities with the film thickness d of annealed
FIG. 4. Variations of Hc, Ms, and average grain size with annealing time
of Fe50Pt50films. Average grain size is obtained from TEM photograph.
Solid lines are the magnetic properties and dash line is the mean grain size. The film thickness is 200 nm and the annealing temperature is 600 °C.
FIG. 5. TEM micrograph and electron diffraction pattern of post-annealed
Fe50Pt50film. The annealing temperature is 600 °C and annealing time is 30
Fe50Pt50 films. Hci is increased with the film thickness from 1 kOe ford516.5 nm to 10 kOe ford>200 nm then keeps small variation with further increasing d to 700 nm. Hc' is below 800 Oe when the film thickness is lower than 60 nm, and it increases rapidly with d to 6.8 kOe for d>200 nm then keeps small variation with increasingd. The variation of
Hc' withd has similar tendency to that of Hci withd. Figure 6~b! shows the relationships among the saturation magnetization Ms, in-plane squareness S~i.e., Mr/ Ms) and thicknessdof the post-annealed Fe50Pt50 films, where Mr is the remnant magnetization. For these films, the Ms value is about 680 emu/cm3 and it almost keeps constant with the variation ofd. The S value of the film is also not affected by the film thickness, it is about 0.8.
For bulk FePt alloys, Tanaka et al.6 thought that very high transition temperature ~1570 K! of disorder fccg-FePt phase to order fct g1-FePt phase and short transition time make the control of this transformation by heat treatment difficult. However, it is easier to get nearly single g1-FePt phase by thin film process. Tsoukatos et al.9had investigated the effects of film thickness on the magnetic hysteresis of CoPt films with film thickness lower than 200 nm, they found that average grain size and coercivity of the film were increased with film thickness. In Fig. 6~a!, it has similar ten-dency as the film thickness is lower than about 200 nm. However, as film thickness is larger than 200 nm, coercivity of the film only keeps small variation with further increasing film thickness. From TEM observation, we find that the grain size of the Fe50Pt50 film (D>90 nm! is not increased with
increasingdagain as it is thicker than 200 nm. This might be owing to that the film has not enough thermal energy for grain growth under constant Tanand tan. So, Hc of the film almost keeps constant with further increasing d because grain size is still in the single-domain size range.
Comparing Fig. 6~a! with Fig. 6~b!, we select Pt content as 50 at. %, d5200 nm, Tan5600 °C, and tan530 min to examine the in-plane magnetic properties of the films.
Figure 7 shows the relationships of Ms and coercivities of post-annealed Fe1002xPtx films (x525– 67) with Pt con-tent. The film thickness is 200 nm, Tanis 600 °C, and tanis
30 min. We can see that maximum Hciand Hc' all occur at Pt550 at. %. Tanaka et al.6indicated that the magnetic prop-erties of FePt alloy strongly depend on the composition as well as the heat-treatment conditions. From the composition point of view, maximum coercivity of the FePt film can be obtained after heat treating the film so as to obtain the high-est ratio of ordered fct g1-FePt phase to disordered fcc
g-FePt phase because g-FePt phase is magnetically soft but
g1-FePt phase has very high magnetocrystalline anisotropy
constant. From Fig. 7, we suspect that the highest@fct phase/ fcc phase# ratio may be occurred at about Pt550 at. % for our films. In general, Ms value of the FePt film is decreased with increasing Pt content for as-deposited g-FePt phase. However, this tendency is changed after the film is annealed. The reason is still not understood.
Figure 8~a! shows the M – H loops of VSM and SQUID, they are all measured at room temperature. Dash line is VSM loop and solid line is SQUID loop. From these loops we find that the Ms value of dash loop is much smaller than that of solid loop. This is due to that the maximum applied field of VSM ~i.e., 12 kOe! is not large enough to saturate the sample. In the past, it is recognized that annealed Fe50Pt50 film is fct g1-FePt phase and its Ms value is about 450 emu/cm3.5 From the M – H loop of SQUID ~it’s maximum applied field is 50 kOe! in Fig. 8~a!, we find that Msvalue of the fctg1-FePt phase is much larger than 450 emu/cm3. We
can see that the (BH)max value of this film is about 14
MG Oe as shown in Fig. 8~b!. This magnetic property is suitable for many permanent film applications. The ‘‘two shoulder’’ shape of SQUID M – H loop in Fig. 8~a! shows
FIG. 6. ~a! Variations of Hcwith film thickness of post-annealed Fe50Pt50
films,~b! variations of Msand the in-plane squareness ( Mr/ Ms) with film
thickness of post-annealed Fe50Pt50 films, the annealing temperature is
600 °C and the annealing time is 30 min.
FIG. 7. Variations of Ms and Hc with Pt content of post-annealed
Fe1002xPtxfilms. Pt content of the film is varied from 25 to 67 at. % and the
film thickness is 200 nm, the annealing temperature is 600 °C and the an-nealing time is 30 min.
the evidence of exchange coupling between magnetically hard fct g1-FePt phase and soft fcc g-FePt phase.
10
It also indicates that there have little amount of magnetically soft fcc g-FePt phase remained in this annealed film.
Figure 9 shows Hci versus applied field Ha of post-annealed Fe50Pt50film. Solid line is the Hciof the film which is quenched by ice water, and dash line is the Hciof the film which is slowly cooled in furnace. These Hci are obtained from VSM minor loops with Ha varied from 600 to 12 000 Oe. Figure 9 shows that the film which quenched by ice water exhibits domain wall pinning mechanism; and the film which slowly cooling in furnace ~cooling rate is about 4 °C/min) exhibits domain nucleation mechanism.11The co-ercivity of furnace-cooled film measured by SQUID is equal to 1.5 kOe for Tan5550 °C and 2 kOe for Tan5600 °C. These coercivities are only a fifth of the coercivities of ice-water-quenched films as shown in Fig. 6. However, from the observation of TEM bright field images, we find that average grain size of furnace-cooled film is about equal to that of ice-water-quenched film. For example, the average grain size of furnace-cooled Fe50Pt50 film after annealed at 600 °C for
30 min is about 90 nm and it is about 85 nm for
ice-water-quenched film. Figure 10 shows the x-ray diffraction patterns of furnace-cooled and ice-water-quenched Fe50Pt50 films.
Comparing the intensities and nonsymmetry of the fct~001! and~110! peaks of Figs. 10~a! and 10~b!, it reveals that the high coercivity of ice-water-quenched film is come from large amount of imperfect fct g1-FePt phase, which
trans-FIG. 8.~a! M – H loops of post-annealed Fe50Pt50film, they are all measured
along the film plane. Dash loop is achieved by VSM and solid loop is
obtained from SQUID.~b! B – H loop of this film, it is measured by SQUID.
The film thickness is 200 nm, the annealing temperature is 600 °C and the annealing time is 30 min.
FIG. 9. Hcivs Haof post-annealed Fe50Pt50film. Solid line is the Hciof the
film which is quenched by ice water and dash line is the Hciof the film
which is slowly cooled in furnace. These Hciare obtained by VSM minor
loops. The film thickness is 200 nm, the annealing temperature is 600 °C, and the annealing time is 30 min.
FIG. 10. X-ray diffraction patterns of post-annealed Fe50Pt50 films. ~a!
analysis of TEM electron diffraction pattern indicates that this film is nearly single phase of fct g1-FePt phase. From the observation of bright field TEM image, its average grain size is about 85 nm. The film’s Ms value is about 680 emu/cm3and (BH)maxvalue is about 14 MG Oe, Fe3Pt and
FePt3 phases are not found in our low Pt content films and
high Pt content films, respectively.
Comparing the coercivities of the minor loops of furnace-cooled film and ice-water-quenched film, it indicates that origin of the coercivity is domain wall pinning type for ice-water-quenched film and domain nucleation type for furnace-cooled film. The grain size of furnace-cooled film is similar to that of ice-water-quenched film, much higher
co-S. W. Yung, Y. H. Chang, T. J. Lin, and M. H. Hung, J. Magn. Magn.
Mater. 116, 411~1992!.
3J. A. Aboaf, T. R. McGuire, S. R. Herd, and E. Klokholm, IEEE Trans.
Magn. MAG-20, 1642~1984!.
4M. Watanabe, T. Nakayama, K. Watanabe, T. Hirayama, and A.
Tono-mura, Mater. Trans., JIM 37, 489~1996!.
5B. Zhang and W. A. Soffa, Scr. Metall. Mater. 30, 683~1994!.
6Y. Tanaka, N. Kimura, K. Hono, K. Yasuda, and T. Sakurai, J. Magn.
Magn. Mater. 170, 289~1997!.
7
K. Watanabe and H. Masumoto, Mater. Trans., JIM 24, 627~1983!.
8
K. Watanabe, Mater. Trans., JIM 29, 80~1988!.
9A. Tsoukatos, H. Wan, G. C. Hadjipanayis, Y. J. Zhang, M. Waite, and S.
I. Shah, J. Magn. Magn. Mater. 118, 387~1993!.
10J. P. Liu, C. P. Luo, Y. Liu, and D. J. Sellmyer, Appl. Phys. Lett. 72, 483
~1998!.