Metabolic changes and the resistance and resilience of a subtropical
1heterotrophic lake to typhoon disturbance
2Jeng-Wei Tsai1, Timothy K. Kratz2, Paul C. Hanson3, Nobuaki Kimura4, Wen-Cheng Liu4, 3
Fang-Pan Lin5, Hsiu-Mei Chou5, Jiunn-Tzong Wu6, Chih-Yu Chiu6*
4
1 Graduate Institute of Ecology and Evolutionary Biology, China Medical University, 91 5
Hsueh-Shih Road, Taichung, 404, Taiwan. 6
2Trout Lake Station, University of Wisconsin-Madison, 10810 County Highway N, Boulder 7
Junction, Wisconsin 54512, USA. 8
3Center for Limnology, University of Wisconsin–Madison, 680 N, Park St., Madison, WI 9
53706-1492, USA. 10
4Department of Civil and Disaster Prevention Engineering, National United University, No.1 11
Lienda, Miaoli 36003, Taiwan. 12
5National Center for High-performance Computing, No.7 R&D 6th Road, Hsinchu Science 13
Park, Hsinchu 300, Taiwan. 14
6Research Center for Biodiversity, Academia Sinica, 128 Academic Rd. II, Nankang, Taipei, 15
11529, Taiwan. 16
*
Corresponding author. Fax: +886-2-27899590#411. Tel: +886-2-27899590#410. E-mail 17
address: [email protected]
18
Keywords: lake metabolism, typhoon, resistance, resistance, high-frequency measurements
19
Abbreviated title: Stability of lake metabolism to typhoon
20 21 22 23 24 25 26 27 28 29
Abstract: We studied how typhoon strength affects the daily dynamics of ecosystem 30
metabolism of a subtropical alpine lake in Taiwan. We identified proximal agents of typhoon 31
disturbance and assessed the resistance (the extent of change induced by a disturbance) and 32
resilience (the rate of recovery after a disturbance) of lake metabolism to them. Gross primary 33
production (GPP), ecosystem respiration (ER), and net ecosystem production were estimated 34
from high-frequency dissolved oxygen and water temperature data provided by an 35
instrumented buoy. There were 15 typhoons of various magnitude (accumulated precipitation 36
[AP] ranged from 51.5 to 816.5 mm) recorded during this study. Typhoons resulted in 37
significantly lower GPP (3%–81% decrease), and higher ER (7%–828% increase) compared 38
to immediately before the events, and thus the lake became more heterotrophic (28%–852% 39
increase in heterotrophy). The resistance and resilience of lake metabolism depended on the 40
intensity of the typhoon. Smaller typhoons(with averagedaily AP (ADAP)< 200 mm•d-1) 41
had greater effects on lake metabolism than medium (ADAP 200–350 mm•d-1) and large 42
(ADAP >350 mm•d-1) typhoons. However, metabolism also recovered more quickly after 43
smaller typhoons than after medium or larger typhoons. Typhoon effects on ecosystem 44
metabolism is likely mediated by the magnitude and duration of typhoon-induced changes in 45
lake mixing, the quantity and quality of dissolved organic carbon, and the biomass of primary 46
producers. 47
Keywords: lake metabolism, typhoon, resistance, resistance, high-frequency measurements
Introduction
49
Factors influencing lake metabolism (defined here as those processes determining gross 50
primary production (GPP), ecosystem respiration (ER) and net ecosystem production (NEP)) 51
are topical because lake metabolism is an indicator of trophic status. In addition, lake 52
metabolism is a factor determining the extent to which lakes are net sources or sinks of 53
atmospheric carbon (Hanson et al. 2003; Kortelainen et al. 2006). Globally, lakes and 54
reservoirs may be a net carbon source to the atmosphere as well as sequestering an amount of 55
carbon in theirsedimentssimilarto thatreaching theworld’soceansfrom streamsand rivers 56
(Dean 1999). 57
Global warming is expected to alter the spatial and temporal distribution of precipitation, 58
potentially causing large functional changes in ecosystems (Kerr 2007; Zhang et al. 2007). 59
Although debates still exist, the number and frequency of intense tropical storm and typhoon 60
events is predicted to increase in subtropical areas (Hoyos et al. 2006; Vecchi et al. 2008). 61
More precipitation and greater frequency may increase surface runoff from watersheds to 62
recipient aquatic ecosystems, thus changing their biogeochemical cycling, food web structures 63
and ecosystem metabolism. 64
Subtropical alpine lakes are usually characterized by highly variable environmental 65
perturbations including typhoon-induced rapid flushing, high diel variation in irradiation, and 66
temperature fluctuations (ranging from 14 oC to 25 oC in summer), all of which might be 67
expected to affect physical and biogeochemical processes and, thus, lake metabolism (Frenette 68
et al. 1996; Dodds 2002). Because most lake metabolism studies are from temperate dimictic 69
lakes, metabolism of tropical and subtropical polymictic lakes, especially those subject to 70
severe, episodic events such as typhoons, is poorly understood. Several studies have focused 71
on the effect of typhoon disturbances on hydrodynamics, nutrient cycling, phytoplankton 72
structures and CO2flux in Lake Biwa, Japan, and Yuan Yang Lake (YYL), Taiwan (Frenette 73
et al. 1996; Robarts et al. 1998; Jones et al. 2009). Previous studies revealed that ecosystem 74
metabolism in YYL has seasonal patterns similar to those of temperate lakes; however, 75
monthly averages of GPP and ER are decreased by 50% and 25%, respectively, during the 76
typhoon season (July to October) from their peaks in mid-May (Tsai et al. 2008). Nevertheless, 77
the response to and recovery of lake metabolism from typhoon disturbances and proximal 78
drivers of change are still not understood at the time scales that are relevant to the lake's 79
dynamics. Because typhoons bring strong winds and large amounts of precipitation, they likely 80
cause vertical mixing of the water column as well as nutrient and dissolved organic carbon 81
(DOC) loading (Gaiser et al. 2009). The effects on lake metabolism are difficult to predict a 82
priori because nutrient loading would tend to push the lake toward autotrophy while DOC
83
loading would push the lake toward heterotrophy (Hanson et al. 2004). 84
Limited information about the impact of typhoons on lake metabolism results from 85
difficulties accessing study sites and research facilities, especially during or immediately after 86
the storm events. The advent of wireless sensor networks providing high-frequency data 87
immediately before, during and after these storm events has allowed researchers to fill in these 88
data gaps (Porter et al. 2005, 2009). The GPP and ER of freshwater ecosystems provide a 89
fundamental indication of cross-ecosystem connectivity responding to natural and human 90
disturbances. They are useful parameters for evaluating aquatic ecosystems’ response to 91
disturbances because both processes integrate energy and material flows through the ecosystem 92
(Uehlinger 2000; Williamson et al. 2008). The resistance (the amount of change caused by a 93
disturbance) and resilience (the speed of recovery following a disturbance) of an ecosystem are 94
key factors determine its ability to continue functioning under changing conditions (Orwin and 95
Wardle 2004). Understanding an ecosystem’s resistance and resilience to natural or 96
anthropological disturbances can help predict response to anticipated changes in the future. 97
Yuan Yang Lake (YYL) is a small, shallow, subtropical alpine lake located in northern 98
Taiwan. The lake experiences multiple typhoon events each year. A single typhoon can deliver 99
more than a meter of precipitation on the 4.5-m-deep lake, which results in rapid flushing (Tsai 100
et al. 2008). Here we present the results of 18 months of study of the metabolism of YYL by in 101
situ high-frequency diel dissolved oxygen (DO) measurements. Fifteen typhoon events were
102
recorded during this study. We aimed to assess how physical, chemical and biological changes 103
due to typhoons altered daily lake metabolic dynamics. 104
In a smaller lake ecosystem, we hypothesized that lake metabolism recovers more quickly 105
from small- and medium-sized typhoons (the size of typhoon was classified by their average 106
daily precipitation, for details please see Table 1) than from large typhoons. Small to moderate 107
precipitation events may tend to flush terrestrial nutrients or chemicals from the watershed and 108
lead to obviouschangesin thelake’smetabolism. In contrast, large typhoons might bring more 109
materials into the lake, however, extra precipitation associated with large typhoons may act to 110
dilute inputs to the lake. After large typhoons, lakes may be slower to recover than after small 111
to moderate events because primary producers and heterotrophs would be flushed out of the 112
system with the massive precipitation. To test this hypothesis and better understand the 113
mechanism of the impact of a typhoon on lake metabolism, we aimed to (1) assess how 114
typhoon strength affects lake metabolism and potential metabolic drivers, (2) clarify the 115
potential mechanisms causing these effects, and (3) assess the resistance and resistance of lake 116
metabolism to typhoon disturbances. 117
Materials and methods
118
Study site
119
Yuan Yang Lake (YYL) is in the north-centralregion ofTaiwan (24°35’N,15 121°24’E) 120
and is a small (3.6×10⁴ m2), shallow (4.5 m maximum depth) lake in a mountainous 121
catchment 1730 m above sea level (Fig. 1). The lake has no defined inlet and one outlet. The 122
lake and watershed (3.7×10⁶m2) was selected for long-term ecological study by the Taiwan 123
National Science Council in 2004 and joined the Global Lake Ecological Observatory 124
Network (GLEON) in 2004. The steep catchment is dominated by pristine Taiwan false 125
cypress forest. The lake is slightly colored, with an average DOC concentration of 6.1 mg•L-1 126
and mean pH of 5.9. The mean annual temperature is approximately 13oC (monthly average 127
ranges from -5 to 15 oC), and annual precipitation can exceed 4 m. The water column is 128
stratified from early spring to late autumn and is usually completely mixed in winter. Anoxia 129
is commonly observed in the hypolimnion during summer and autumn. The lake experiences 130
three to seven typhoons (in summer and autumn) each year, during which more than 40% of 131
the annual precipitation may fall. 132
High-frequency data collection
133
An instrumented buoy was deployed in April 2004 above the deepest location in YYL to 134
record surface DO concentration, water temperature and wind speed every 10 min (Fig. 1). 135
Surface DO concentrations were measured at 0.25 m depth by a Sonde (600-XLM, YSI, Inc. 136
Yellow Springs, OH, USA) fitted with a rapid-pulse oxygen-temperature electrode (YSI, 137
model 6562). The DO Sonde was calibrated in air, with a correction for barometric pressure 138
before deployment. This air calibration was checked during weekly calibration/maintenance 139
visits by placing the Sonde in water-saturated air for 60 min. Additional calibrations were 140
performed by measuring the DO concentration at 0, 0.25, 0.5, 1, 2, 3.5 m with a portable 141
water-quality multiprobe (Hydrolab minisonde 4a, Hach Environmental, Loveland, CO, USA) 142
to eliminate the potential bias induced by drift of in situ Sonde while being deployed. Water 143
temperature was measured through the water column at 0.5-m increments by use of a 144
thermistor chain (Templine, Apprise Technologies, Inc. Duluth, MN, USA). Wind speed was 145
measured 2 m above the lake by use of an anemometer (model 03001, R.M. Young, Traverse, 146
MI, USA). Precipitation, air temperature and downward photosynthetically active radiation 147
(PAR) were measured at a land-based weather station approximately 1 km from the lake using 148
a tipping bucket rain gauge, temperature probe (41382VC; R.M. Young) and a PAR sensor 149
(LI-190; Li-cor, Lincoln, NE, U.S.A.), respectively. Over the entire period of observation 150
(May 2004 to October 2005), data were successfully recorded on 446 days. 151
Limnological sample
152
Associated lake surface water samples were collected manually at weekly intervals during 153
the typhoon season (June or July to October). Additional sampling was conducted before the 154
onset of typhoons and immediately after typhoons when access permitted. Samples for DOC 155
(45 mL), Chl a (200 mL) and water color (18 mL) analyses were collected using a portable 156
hand pump with inline filters (Whatman, 47 mm GF/F, the nominal pore size is 0.7 µm, 157
Maidstone, Kent, UK). DOC samples were stored on ice no longer than two days after 158
collection until analysis with an O.I. TOC analyzer (Model 1010, O.I. Analytical, College 159
Station, TX, USA) with persulfate digestion. Filters of Chl a sample were stored in the dark at 160
4oC until Chl a was extracted with methanol and then was measured by a Portable Fluorometer 161
(10-AU-005-CE; Turner Designs, Sunnyvale, CA, U.S.A.) (Hanson et al. 2003). Total 162
phosphorus (TP) and total nitrogen (TN) were measured from unfiltered surface water samples. 163
TP samples (50 mL) were digested with concentrated sulphuric acid and later analysed by the 164
molybdenum blue method. TN samples of 6 mL were combined with potassium 165
peroxydisulphate and then digested in an autoclave. Nitrite content was determined by using a 166
Shishin flow injection analyser (FIA, ZC4000; Taipei, Taiwan). Water color samples were kept 167
on ice and brought back to the laboratory. Absorbance was measured by spectrophotometry 168
(Spectroquant, VEGA 400, Serial No: 00060093, Merck, Whitehouse Station, NJ, USA) in a 169
10-cm cuvette. Water color was expressed as wavelength-specific (440 nm) absorbance 170
coefficient: (a440, m-1): a440= 2.303 × (absorbance at 440 nm/0.1 m) (Houser 2006). 171
Estimation of lake metabolism
172
Daily GPP and ER were estimated from high-frequency measurements (every 10 min) of 173
DO concentration at 0.25 m depth. The metabolism model described by Cole et al. (2000) and 174
Hanson et al. (2003) was adopted for estimating GPP, ER and NEP from diel DO data. We 175
assumed that the additional loading of DO induced by external loadings of surface inflow, and 176
groundwater were negligible in the lake. In brief, ER was calculated as the atmospheric 177
diffusion-corrected changes in DO during nighttime. In keeping with previous work (Cole et al. 178
2000; Hanson et al. 2003; Tsai et al. 2008), we calculated GPP by assuming that ER during the 179
day and night was equal. NEP (=GPP-ER) was calculated as the diffusion-corrected increase in 180
surface-layer DO during daytime. Metabolic parameters were calculated for each day except 181
for the days of typhoons, because entraining of anoxic bottom waters (Tsai et al. 2008) and 182
potential DO loading from incoming waters may render the model invalid during (but not 183
immediately before or after) typhoon events. 184
Because of the effect of alpine topography and foggy weather on the availability of PAR 185
to primary producers, light intensity data from the meteorological station were examined at an 186
hourly time step to estimate the actual timing of photosynthesis.Weconsidered “daytime”to 187
betheperiod when themeasured lightintensity was>10 μmolephotonsm-2•s-1(Lauster et al. 188
2006). Exchange of oxygen between water column and atmosphere (Fatm) was estimated as 189
Fatm= k(O2sat–O2)/Z (μmol•m-3•h-1) (Cole et al. 2000, 2002), where Z is the depth of mixing 190
layer (m) and k isthetransfercoefficient(m•h-1) for oxygen. k is expressed as (Wanninkholf, 191 1992) 192 193 67 . 0 600 600 SCoxy k k , (1) 194 195
where k600(k for a Schmidt number of 600) was estimated as a function of wind speed at 10 m 196
(U10,m•s-1) above the lake by the equation of k600 2.070.21U101.7(Cole et al. 1994), and 197
SCoxyis the Schmidt number for oxygen and is calculated as follows (Wanninkholf, 1992): 198 199 SCoxy=1800.6-120.1×t+3.78×t2-0.05×t3, (2) 200 201
where t is the water temperature (oC). 202
O2(t) and O2sat(t) are the measured DO concentration and saturation concentration of 203
oxygen (mg•L-1) at toC, respectively. O2sat is a function of water temperature and altitude and 204
was estimated by the empirical equation given in Dodds (2002). 205
Data analysis
206
We used the difference between 3-day means of GPP, ER, and NEP immediately before and 207
after a typhoon event to quantify typhoon-induced metabolic change. The duration of typhoon 208
event itself was determined by the in-situ measured timing of typhoon-induced precipitation in 209
YYL. The index for resistance (RS) was calculated as follows (Orwin and Wardle 2004): 210 211
0 0 0 0 2 1 D C D t RS , (3) 212 213where D0 is the difference between the last measurement of metabolic parameters before 214
typhoon events (C0) and the maximal disturbed metabolic parameter occurring at time t0 after 215
the end of the typhoon. The index for resilience (RL) at time txwas calculated as follows: 216 217
2
1 ) ( 0 0 x x D D D t RL , (4) 218 219where tx is 3 days after the occurrence of the maximum disturbed parameter and Dx is the 220
difference between the C0 and the disturbed metabolic parameters at time tx. RS and RL both 221
range between -1 and 1. A value of 1 indicating that the disturbance has no effect in the 222
metabolic parameters (maximal resistance) and full recovery (maximal resilience) of response 223
variables to the level before the disturbance. An RS value of 0 indicates a 100% reduction or 224
enhancement and an RL value of 0 represents no recovery (i.e., D0 DX) in the metabolic 225
parameters after the end of the disturbance, respectively. Negative values of RS indicate more 226
than 100% change (i.e., where D0 ) and negative values for RL indicate negativeC0
227
recovery (i.e., the system continued to move away from its pre-typhoon state even after the 228
typhoon had ended). 229
We used one-way ANOVA with Tukey’spost-hoc test to evaluate the impact of typhoon 230
on lake metabolism by comparing 3-day averages of GPP, ER, and NEP values before a 231
typhoon with corresponding parameters measured in the subsequent post-typhoon periods. A 232
paired t-test was used to compare the RS and RL of GPP, ER, and NEP. Pearson correlation was 233
used to determine the quantitative relation between change in environmental and limnological 234
variables and the three ecosystem metabolic parameters (i.e., GPP, ER, and NEP). Stepwise 235
multiple linear regression analysis was performed to identify the factors that simultaneously 236
account for the RS and RL of lake metabolism. We used Statistica® software (StatSoft, Tulsa, 237
OK, USA) to calculate the coefficient of determination (R2). A p < 0.05 was considered 238
statistically significant. 239
Results
240
Typhoon disturbance regimes
241
Typhoon and storm disturbances were prevalent in YYL (Table 1), with seven typhoon 242
events in 2004 and eight events in 2005. The accumulated precipitation (AP) of a single 243
typhoon ranged from 51.5 to 816.5 mm, and the 10-min average wind speed ranged from 0.72 244
to 3.45 m•s-1. The AP was positively correlated with the corresponding wind speed (r=0.88, 245
p<0.05, n=15, Table 2 and Fig. 2d). Total precipitation in typhoon seasons accounted for
246
69.6% and 67.8% of the annual total precipitation in 2004 and 2005, respectively. Typhoon 247
disturbances changed a number of measured limnological variables. Although water color and 248
DOC concentrations increased quickly after the typhoons, the opposite was noted for Chl a 249
and TP. (Fig. 3). The change in limnological variables (%) was negatively correlated with the 250
AP of typhoons except for TP. Decreases in water color, DOC and TN were observed after 251
large typhoon (e.g., L1) (Fig. 3). 252
Response of lake metabolism to typhoons
253
Results of one-way ANOVA indicated that most of the typhoon events resulted in lowered 254
GPP (3.3%–81.0% decrease) and increase ER (7.1%–827.7% increase). The lake, therefore, 255
became more heterotrophic after typhoon events (27.6%–852.4% increase in heterotrophy) 256
(p<0.05, Figs. 2a-c). Daily changes in NEP were mainly controlled by ER dynamics. The daily 257
changes in NEP were mainly controlled by the dynamics of ER, because ER was more 258
responsive to typhoons than GPP (average change levels were 160.4% and -41% for ER and 259
GPP, respectively) (Figs. 2a-c). Nevertheless, the extent of metabolic changes and magnitude 260
of AP and wind speed were not correlated (Fig. 2). Typhoons induced obvious interruptions for 261
the time series of lake metabolism, surface DO and water temperature profiles. Water mixing 262
during typhoons was evident when temperature data from 0.25 and 3.5 m depths were 263
examined (Figs. 4a-d). The temporal trends of DO during and after disturbances were related 264
to the water mixing regime and time series of GPP and ER (Figs. 4). DO level in YYL 265
decreased (-16.7% to -58%) during medium and small typhoons (e.g., S2) but temporarily 266
increased during large events and then quickly dropped to low levels after the typhoon (e.g., 267
L1, +71%). Surface DO took 3-5 days to recover to pre-typhoon levels (Fig. 4e and f). The 268
regular diel DO cycle (i.e., DO level increased at day and decreased at night) also weakened or 269
even disappeared during typhoons but recovered within 1 or 2 days after a typhoon or storm. 270
Fatmincreased after small typhoons because decreased DO concentration enhanced the flux of 271
atmospheric O2 (Figs. 4g and h). All parameters took about 5-10 days to return to 272
pre-disturbance levels. 273
Resistance and resilience of lake metabolism
274
Although changes in GPP, ER and NEP were not correlated with the intensity of typhoons 275
(i.e., AP or wind speed), the RS of the three metabolic parameters showed a positive correlation 276
with the intensity of AP (Figs. 5a-c). Surprisingly, more negative values of RS occurred with 277
smalltyphoons(with average daily accumulated precipitation (ADAP)< ~200 mm•d-1), which 278
revealed that small events caused stronger effects on GPP, ER and NEP than medium (ADAP 279
200–350 mm•d-1) and large-sized events(ADAP >350 mm•d-1). Paired t-test results showed 280
that the RS of GPP was significantly greater than ER, again indicating that ER is more 281
responsive to typhoon disturbances than GPP. The RL of the three metabolic parameters was 282
negatively correlated with AP (Figs. 5d-f), which indicated that ecosystem metabolism 283
recovered faster after smaller disturbance events than after larger ones. Negative values of RL 284
for ER and NEP were observed only in one large event (L1). RL did not significantly differ 285
among the three metabolic parameters (p>0.05). 286
In addition to the direct effect of intensive precipitation and strong wind on the dynamics 287
of lake metabolism, changes in limnological factors were also correlated with the reaction and 288
recovery of lake metabolism to typhoons (Table 2 and 3). A positive correlation between 289
changes in TP and RS of GPP (r=0.71, Fig. 6a) suggested that the lower resistance of GPP to 290
small typhoons (Fig. 5a) may be mediated by decreased TP after most typhoons (Figs. 3d and 291
e). Results of stepwise multiple regressions showed that Chl a and water color accounted for 292
RL of GPP (p<0.05, Fig. 6d and Table 3), suggesting that the quicker GPP recovery rate after
293
small typhoons (Fig. 5d) might result from increases in Chl a and color in the lake. Changes in 294
TN and DOC both showed a significant positive correlation with changes in water color, and 295
these changes were all significantly driven by precipitation (p<0.05, Table 2). This correlation 296
implied that both colored N- and C-rich compounds were affected by the increase in 297
allochthonous organic matter after typhoons. 298
The RS of ER and NEP was negatively correlated with changes in TN (Table 2 and 3, 299
Fig. 6c). Small typhoons tended to increase TN (Fig. 3c). This finding explained why ER and 300
NEP were less resistant to smaller typhoons than large ones (Figs. 5b-c). Increases in the RL of 301
ER and NEP were associated with the increase in water color, TN and DOC (Table 2 and 3). 302
Changes in water color, TN and DOC were far less after typhoons with the least precipitation 303
(Figs. 3a-c) which may explain the higher recovery of ER and NEP after these smaller events 304
(Figs. 5d, e and f). Furthermore, changes in Chl a were correlated with RS and RL of ER and 305
NEP (Figs. 6b, e and f). Such changes suggest that the observed GPP and ER reaction to 306
typhoons may have been driven by autochthonous organic carbon. After typhoons, recovery 307
rate (i.e. of RL) was not correlated with either daily water temperatures or light intensity. (Figs. 308
4c and d). 309
Discussion
310
One of the most interesting observations of this study was that YYL became temporarily 311
heterotrophic after typhoons. The decreases in concentrations of TP and Chl a after typhoons 312
accounted for reductions in GPP (Figs. 3d and e, Fig. 6a). In this lake, typhoons caused 313
temporary partial or total mixing of water column and the water level to fluctuate (Figs. 4a-d). 314
This finding suggests that lake water was moved out of the lake during typhoon events. The 315
quick movement and renewal of lake water may reduce the concentration of Chl a and result in 316
reduced GPP, which suggests that the rapid response of lake metabolism may be controlled 317
simply by the change in hydrologic processes rather than by biological processes. This 318
phenomenon has been observed in freshwater systems i.e. flood-prone rivers and alpine 319
streams (Uehlinger et al. 2003; Acuña et al. 2004). Thus, bed-moving floods transiently reduce 320
both GPP and NEP in stream ecosystems and shift ecosystem metabolism towards 321
heterotrophy because of the reduction in primary producers (e.g., periphyton and diatoms). We 322
found that DOC and water color increased after majority of typhoons (Fig. 3a and b). The 323
increase in water color or DOC concentration might temporarily decrease light penetration 324
within the water column and thus inhibit GPP. Karlsson et al. (2009) indicated that light 325
availability is a strong limiting factor for ecosystem production in heterotrophic lakes and 326
natural changes in colored dissolved organic matter (CDOM) override the effects of natural 327
variations in nutrients (e.g., nitrogen and phosphorous) on ecosystem production. DOC of 328
terrestrial origin would strongly absorb solar radiation and thus reduce the light availability for 329
aquatic primary producers. Otherwise, the primary production of the phytoplankton 330
community is affected by both instantaneous irradiance and the short-term light history 331
(Obrien et al. 2009). Large quantities of algae were observed in the bottom layer of YYL 332
during the stratification period between typhoons (Tsai et al. 2008). Large and medium 333
typhoons destroyed the stratification that had characterized the water column between typhoon 334
events and caused temporary mixing of the lake (Fig. 4b). These algae might be quickly 335
released to the surface layer by the typhoon-induced vertical mixings and may have replaced 336
the original algal species. Primary production of these dark-acclimated algae from 337
hypolimnion may be more prone than the original light-acclimated species to photoinhibition 338
by the high incident light after storms and typhoons (Figs. 4c and d), thus decreasing GPP. The 339
change in phytoplankton community might also be responsible for the variation in GPP after 340
typhoon, because a size-dependent change in Chl a and changes in photosynthesis efficiency 341
were observed after typhoons (Frenette et al. 1996). 342
The major impact of typhoons on lake metabolism might be also mediated through the 343
effect of weather conditions on the dynamics of limnological variables. ER and NEP were 344
stimulated after typhoons (Fig. 2b), the RS of ER was negatively correlated to 345
typhoon-induced changes in water color, Chl a and TN and the RL of ER and NEP were 346
positively correlated to changes in water color, Chl a, TN, and DOC concentration (Table 2, 347
Figs. 6b-c). Water color (light absorbance at 440 nm) is a good predictor of terrestrially 348
produced dissolved organic matter in lakes (Carpenter et al. 2005). The increase in water color 349
and DOC was widely reported as resulting from elevated precipitation, which increases 350
loading of allochthnious carbon and affects ecosystem metabolism (Gergel et al. 1999, Pace 351
and Cole 2002). Several lines of evidence support inputs of terrestrial organic material from 352
landscapes substantially contributing to bacterial ER and resulting in reduced NEP in aquatic 353
ecosystems (Beisner et al. 2003; Hanson et al. 2003; Karlsson et al. 2007). YYL is a 354
persistently heterotrophic ecosystem (Tsai et al. 2008), which suggests that ER not only uses 355
the organic compounds originally produced by photosynthesis but is also fueled by 356
allochthonous carbon. 357
Temporary vertical mixing of the water column was prevalent during typhoons (Figs. 4a-d) 358
and may have accelerated the release or re-suspension of essential nutrients from the sediment 359
to the epilimnion, where they can be used by microbes, which results in increased ER (Robarts 360
et al. 1998; Kirchman et al. 2004; Pérez and Sommaruga 2006). A negative correlation 361
between the resistance of ER and change in Chl a (Fig. 6b) indicated that if typhoons cause a 362
large decrease in chlorophyll, ER also changes less (i.e., high resistance). The decrease in Chl a 363
after typhoons might provide a low autochthonous organic substrate for heterotrophic 364
organisms (Aoki et al. 1996) and thus low rates of changes in ER. Our findings suggest that 365
Chl a (i.e., the biomass of algal community) seems to be one of the key drivers for the response 366
and recovery of ecosystem respiration to typhoons. Several lines of studies indicated that the 367
release of nutrients from the autochthonous pool (e.g., sediment or littoral) after typhoons or 368
floods, rather than just allochthonous sources, might be responsible for the change in lake 369
metabolism because terrestrially derived carbon is often relatively refractory to biological use 370
(Cole et al. 2002; Pérez and Sommaruga 2006; Colangelo 2007). Although we did not intend to 371
assess the relative contribution of autochthonous and allochthonous carbon to post-storm 372
responses, both autochthonous and allochthonous organic matter might play a key role in 373
mediating the reaction of the lake metabolism to typhoon events. 374
DO concentrations decreased temporarily after typhoons. Two processes might account 375
for the dynamic changes in DO level. First, the large increase in ER, and to a lesser extent the 376
small decrease in GPP, after typhoons (Fig. 2b and Figs. 4g and h) can cause a steady decline 377
in DO levels. Second, entrainment of low DO water from the hypolimnion during and after 378
large typhoons could also account for the decrease in surface DO level after typhoons. 379
Consequently, the recovery rate of ER and restratification would therefore be the key 380
processes controlling the resilience of YYL metabolism. 381
Results of resistance and resilience assessments indicated that small typhoons (with
382
ADAP < 200 mm•d-1)) cause large changes (i.e., low resistance) in GPP, ER, and NEP as 383
compared with medium- and large-sized events (Fig. 5). The differential response of lake 384
metabolism to disturbance events of different intensity is an interesting observation. We found 385
that small to moderate precipitations might flush available DOC and nutrients (TN) from the 386
watershed, thus leading to increased concentrations of limnological drivers in the lake and 387
resulting in rapid changes (i.e., low resistance) in lake metabolism. Additional precipitation 388
associated with large typhoon events may merely serve to dilute the DOC (or nutrients) level 389
would have been loaded in small to moderate events (Figs. 3a-d). This dilution would be 390
manifested in a relatively higher resistance of lake metabolism to large typhoons (Fig. 5). The 391
reduced resilience of the lake metabolism to large typhoon events may be mediated by the 392
increased flushing, with massive precipitation substantially diluting the algal (Fig. 3d) and 393
microbial population abundance. Lower recovery of ER and NEP after large typhoons (Figs. 394
5e and f) is associated with loss of Chl a (Figs. 6e and f), which might occur because of the 395
decreasing nitrogen consumption due to the loss of Chl a after large typhoons. 396
Results of Pearson and stepwise multiple analyses indicated that frequency of typhoon 397
(DSLT) was not significantly correlated to the resistance and resilience of the lake metabolism 398
(Table 2 and 3). Nevertheless, the interval and sequence of storms might affect how the lake 399
reacts to the disturbance and determine the factors that affect the rate of metabolic recovery of 400
thesystem.Forexample,largertyphoonsmay havea major“cleaning”effect,transporting 401
DOC and/or other materials into the lake and thus reducing the amount of chemicals available 402
for transport during the following small typhoon (e.g., the cases between L1 and S4, and 403
between M3 and S6), resulting in smaller effects (i.e., higher resistance of the lake) compared 404
to other small typhoons (e.g., S3, Fig. 5b and c). In contrast, if a small or medium typhoon 405
following a sequence of typhoons with similar size, the resulting effects would be enhanced 406
(i.e., lower resistance of the lake) (e.g., S2, S3, S8 and S10 ). The effect of the first small 407
typhoon in each year is often large due to the abundance of materials accumulated since the 408
last typhoon season (e.g., S1, Fig. 5b and c). Assessment of the frequency and cumulative 409
effects of typhoons is in need of additional study, especially over multiple years. 410
In summary, this study revealed that episodic environmental events such as typhoons 411
altered the daily dynamics of ecosystem metabolism in YYL. Typhoons tended to decrease 412
GPP and stimulate ER, and thus the lake became more heterotrophic. Smaller typhoons caused 413
stronger effects on lake metabolism than did medium- and large-sized typhoons; however, 414
metabolism recovered more quickly after smaller typhoons than after medium or larger 415
typhoons. Typhoon-induced changes in the quantity and quality of limnological drivers such as 416
dissolved organic carbon and nutrients (TN and TP) and the biomass of primary producers 417
(Chl a) mediated the response and recovery of lake metabolism to typhoons. Thus, patterns of 418
typhoon intensity associated with corresponding changes in limnological drivers were key 419
predictors of the daily dynamics of lake metabolism immediately after typhoons. Results of 420
this study provide a scientific basis to predict how lakes might change as net sources or sinks 421
of carbon from the atmosphere in subtropical or tropical regions if global warming leads to an 422
increase in typhoon frequency. 423
Acknowledgements
424
We thank K.T. Hsu, S. Lin, Y. L. Chou for assistance with equipment maintenance, sample 425
collection and data analysis. We thank W.Y.B. Chang and Peter W. Arzberger for a critical 426
review of this manuscript. We appreciate the helpful comments of anonymous reviewer that 427
improved this manuscript. This study benefited from participation in the Global Lakes 428
Ecological Observatory Network (GLEON). This research was supported by Academia Sinica, 429
the Taiwan National Science Council (NSC 97-2621-B-039-001-MY2), the US National 430
Science Foundation, and the Gordon and Betty Moore Foundation. 431 432 433 434 References 435
Acuña, V., Giorgi, A., Muñoz, I., Uehlinger, U., and Sabater, S. 2004. Flow extremes and 436
benthic organic matter shape the metabolism of a headwater Mediterranean stream. Freshw. 437
Biol. 49(7): 960-971. doi: 10.1111/j.1365-2427.2004.01239.x. Available from: 438
http://www3.interscience.wiley.com/doiinfo.html 439
Aoki, T., Hayami, Y., Fujiwara, T., Mukai, H., and Tanaka, Y. 1996. Nutrient dynamics in the 440
North Basin of Lake Biwa: I. Changes in the vertical distribution of nutrients due to an 441
internal surge induced by a strong typhoon. J. Gt. Lakes Res. 22(2): 331-340. 442
doi:10.1016/S0380-1330(96)70959-0. 443
Beisner, B.E., Dent, C.L., and Carpenter, S.R. 2003. Variability of lakes on the landscape: 444
Roles of phosphorus, food webs, and dissolved organic carbon. Ecology 84(6): 1563-1575. 445
doi:10.1890/0012-9658(2003)084[1563:VOLOTL]2.0.CO;2. 446
Carpenter, S.R., Cole, J.J., Pace, M.L., and van de Bogert, M. 2005 Ecosystem subsidies: 447
terrestrial support of aquatic food web from 13C addition to contrasting lakes. Ecology 86 448
(10): 2737-2750. Available from: 449
http://www.ecostudies.org/reprints/Carpetner_et_al_Ecology%202005.pdf 450
Colangelo, D.J. 2007. Response of river metabolism to restoration of flow in the Kissimmee 451
River, Florida, U.S.A. Freshw. Biol. 52(3): 459-470. dol:10.1111/j.1365-2427.2006.01707.x. 452
Cole, J.J., Caraco, N.F., Kling, G.W., Kratz, T.K. 1994. Carbon dioxide supersaturation in the 453
surface waters of lakes. Science 265(5187):1568-1570. Available from: 454
http://www.sciencemag.org/cgi/reprint/265/5178/1568.pdf 455
Cole, J.J., Pace, M.L., Carpenter, S.R., and Kitchell, J.F. 2000. Persistence of net heterotrophy 456
in lakes during nutrient addition and food web manipulations. Limnol. Oceanogr. 45(8): 457
1718-1730. 458
Cole, J.J., Carpenter, S.R., Kitchell, J.F., and Pace, M.L. 2002. Pathways of organic carbon 459
utilization in small lakes: Results from a whole-lake 13C addition and couple model. Limnol. 460
Oceanogr. 47(6): 1664-1675. 461
Dean, W.E. 1999. The carbon cycle and biogeochemical dynamics in lake sediments. J. 462
Paleolimn. 21(4): 375-393. doi:10.1023/A:1008066118210. 463
Dodds, W. K. 2002. Aquatic chemistry controlling nutrient cycling: redox and O2.In
464
Freshwater ecology. Academic Press, San Diego, CA. pp. 212-213. 465
Frenette, J.J., Vincent, W.F., Legendre, L., and Nagata, T. 1996. Size-dependent phytoplankton 466
responses to atmospheric forcing in Lake Biwa. J. Plankton Res. 18(3): 371-391. 467
doi:10.1093/plankt/18.3.371. 468
Gaiser, E.E., Deyrup, N.D., Bachmann, R.W., Battoe, L.E., and Swain, H.M. 2009. Effects of 469
climate variability on transparency and thermal structure in subtropical, monomictic Lake 470
Annie, Florida. Limnol. Oceanogr. 54(6): 2228-2232. 471
Gergel, S.E., Turner, M.G., and Kratz, T.K. 1999. Dissolved organic carbon as an indicator of 472
the scale of watershed influence on lakes and rivers. Ecol. Appl. 9(4): 1377-1390. 473
doi:10.1890/1051-0761(1999)009[1377:DOCAAI]2.0.CO;2. 474
Hanson, P.,C., Bade, D.L., Carpenter, S.R., and Kratz, T.K. 2003. Lake metabolism: 475
relationships with dissolved organic carbon and phosphorus. Limnol. Oceanogr. 48(3): 476
1112-1119. 477
Hanson, P.C., Pollard, A.I., Bade, D.L., Predick, K., Carpenter, S.R., and Foley, J.A. 2004. A 478
model of carbon evasion and sedimentation in temperate lakes. Glob. Change Biol. 10(8): 479
1285-1298. doi: 10.1111/j.1365-2486.2004.00805.x. 480
Houser, J.N. 2006. Water color affects the stratification, surface temperature, heat content, and 481
mean epilimnetic irradiance of small lakes. Can. J. Fish. Aquat. Sci. 63(11): 2447–2455. 482
doi:10.1139/F06-131. 483
Hoyos, C.D., Agudelo, P.A., Webster, P.J., and Curry, J.A. 2006. Deconvolution of the 484
Factors Contributing to the Increase in Global Hurricane Intensity. Science 312(5770): 94-97. 485
Available from: http://www.sciencemag.org/cgi/reprint/sci;312/5770/94.pdf 486
Jones, S.E., Kratz, T.K., Chiu, C.Y., and McMahon, K.D. 2009. Influence of typhoons on 487
annual CO2flux from a subtropical, humic lake. Glob. Change Biol. 15(1): 243-254. doi: 488
10.1111/j.1365-2486.2008.01723.x. 489
Karlsson, J., Jonsson, M., and Jansson, A. 2007. Respiration of allochthonous organic carbon in 490
unproductive forest lakes determined by the Keeling plot method. Limnol. Oceanogr. 52(5): 491
603-608. 492
Kirchman, D.L., Dittel, A.I., Findlay, S.E.G., and Fischer, D. 2004. Changes in bacterial 493
activity and community structure in response to dissolved organic matter in the Hudson 494
River, New York. Aquat. Microb. Ecol. 35(3): 243-257. 495
Kortelainen, P., Rantakari, M., Huttunen, J.T., Mattsson, T., Alm, J., Juutinen, S., Larmola, T., 496
Silvola, J., Pertti, J., and Martikainen, P.J. 2006. Sediment respiration and lake trophic state 497
are important predictors of large CO2evasion from small boreal lakes. Glob. Change Biol. 498
12: 1554-1567. doi: 10.1111/j.1365-2486.2006.01167.x.
499
Kerr R.A. 2007. Global warming is changing the world. Science 316(5822): 188-190. Available 500
from: http://www.sciencemag.org/cgi/reprint/316/5822/188.pdf 501
Lauster, G.H., Hanson, P.C., and Kratz, T.K. 2006. Gross primary production and respiration 502
differences among littoral and pelagic habitats in northern Wisconsin lakes. Can. J. Fish. 503
Aquat. Sci. 63(5): 1130-1141. doi:10.1139/F06-018. 504
O'Brien, K.R., Burford, M.A., and Brookes, J.D. 2009. Effects of light history on primary 505
productivity in a phytoplankton community dominated by the toxic cyanobacterium 506
Cylindrospermopsis raciborskii. Freshw. Biol. 54(2): 272-282.
507
doi:10.1111/j.1365-2427.2008.02106.x. 508
Orwin, K.H., and Wardle, D.A. 2004. New indices for quantifying the resistance and resilience 509
of soil biota to exogenous disturbances. Soil Biol. Biochem. 36(11): 1907-1912. 510
doi:10.1016/j.soilbio.2004.04.036 511
Pace, M.L., and Cole, J.J. 2002. Synchronous variation of dissolved organic carbon and color 512
in lakes. Limnol. Oceanogr. 47(2): 333-342. 513
Pérez, M.T., and Sommaruga, R. 2006. Differential effect of algal- and soil-derived dissolved 514
organic matter on alpine lake bacterial community composition and activity. Limnol. 515
Oceanogr. 51(6): 2527-2537. 516
Porter J.H., Peter A., Braun H.W., Bryant P., Gage S., Hansen T., Hanson P.C., Lin C.C., Lin 517
F.P., Kratz T.K., Michener W., Shapiro S., and Williams T. 2005. Wireless sensor networks 518
for ecology. BioScience 55(7): 561-572. 519
doi:10.1641/0006-3568(2005)055[0561:WSNFE]2.0.CO;2. 520
Porter, J.H., Nagy, E., Kratz, T.K., Hanson, P.C., Collins, S.L., and Arzberger, P. 2009. New 521
eyes on the world: advanced sensors for ecology. BioScience 59(5): 385-397. 522
doi:10.1525/bio.2009.59.5.6. 523
Robarts, R.D., Waiser, M.J., Hadas, O., Zohary, T., and MacIntyre, M. 1998. Relaxation of 524
phosphorus limitation due to typhoon-induced mixing in two morphologically distinct basin 525
of Lake Biwa, Japan. Limnol. Oceanogr. 43(6): 1023-1036. 526
Tsai J.W., Kratz T.K., Hanson P.C., Wu J.T., Chang W.Y.B., Arzberger P.W., Lin B.S., Lin F.P., 527
Chou H.M., and Chiu C.Y. 2008. Seasonal dynamics, typhoons and the regulation of lake 528
metabolism in a subtropical humic lake. Freshw. Biol. 53(10): 1929-1941. 529
doi:10.1111/j.1365-2427.2008.02017.x. 530
Uehlinger, U. 2000. Resistance and resilience of ecosystem metabolism in a flood-prone river 531
system. Freshw. Biol. 45(3): 319-332. doi: 10.1111/j.1365-2427.2000.00620.x. 532
Uehlinger, U., Kawecka, B., and Robinson, C.T. 2003. Effects of experimental floods on 533
periphyton and stream metabolism below a high dam in the Swiss Alps (River Spöl). Aquat. 534
Sci. 65(3): 199-209. doi:10.1007/s00027-003-0664-7. 535
Vecchi, G.A., Swanson, K.L., and Soden, B.J. 2008. Whither Hurricane Activity? Science 322: 536
687-689. Available from: http://www.sciencemag.org/cgi/reprint/322/5902/687.pdf 537
Wanninkhof, R. 1992. Relationship between wind speed and gas exchange over the sea. J. 538
Geophys. Res. 97(C5): 7373-7382. 539
Williamson, C.E., Dodds, W., Kratz, T.K., and Palmer, M.A. 2008. Lakes and streams as 540
sentinels of environmental change in terrestrial and atmospheric processes. Front. Ecol. 541
Environ. 6(5): 247-254. doi: 10.1890/070140. 542
Zhang, X., Zwiers, F.W., Hegerl, G.C., Lambert, F.H., Gillett, N.P., Solomon, S., Stott, P.A., 543
and Nozawa, T. 2007. Detection of human influence on twentieth-century precipitation 544
trends. Nature 448(7152): 461-465. doi:10.1038/nature06025. 545
aTyphoon events reported by the Central Weather Bureau in Taiwan (CWBT). Data adapted 1
from the typhoon database of CWBT. Website: http://rdc28.cwb.gov.tw/. The duration of the 2
typhoon event was adjusted by the measured timing of typhoon-induced precipitation in 3
YYL. 4
bThe strength of typhoon is determined based on the criterion for the precipitation 5
classification of the Central Weather Bureau in Taiwan. Storms refer to small typhoon, if 6
the averaged daily accumulated rainfall(ADAP)> 50 mm•d-1;ADAP > 200mm•d-1, 7
referring to medium typhoon and largetyphoon if350 mm•d-1or more. Website: 8
Year Datea Code Strengthb Accumulated
precipitationc(mm) Mean wind speed c (m•s-1) 2004 8-9 June S1 Small 51.5 (51.5) 0.72 (5.3) 1-4 July S2 Small 160.0 (53.3) 1.35 (8.7) 11-14 Aug. S3 Small 205.0 (68.3) 2.19 (13.5) 23-25 Aug. L1 Large 816.5 (408.3) 3.25 (15.5) 11-12 Sept. S4 Small 115.5 (115.5) 1.29 (6.2) 24-26 Oct. S5 Small 256 (128.0) 2.13 (15.2) 3-4 Dec. M1 Medium 215.0 (215.5) 1.69 (5.7) Total 1741.0 Mean±SD 248.7±257.1 1.80±0.82 2005 17-19 July M2 Medium 650.0 (325.0) 2.67 (11.9) 3-5 Aug. M3 Medium 620.0 (310.0) 3.45 (16.4) 12-13 Aug. S6 Small 118.0 (118.0) 2.21 (7.8)
31 Aug.-1 Sept. L2 Large 380.0 (380.0) 2.13 (11.3)
10-13 Sept. S7 Small 79.0 (26.3) 2.06 (6.0) 21-23 Sept. S8 Small 102.5 (51.3) 1.35 (6.7) 1-3 Oct. S9 Small 293.0 (146.5) 2.26 (20.5) 7-9 Oct. S10 Small 156.0 (78.0) 1.72(5.9) Total 2379.0 Mean±SD 297.4±228.8 2.2±0.63
Table 1. The timing, total accumulated precipitation, mean wind speed, and strength of typhoons recorded in Yuang-Yang Lake (YYL) from May 2004 to October 2005.
http://www.cwb.gov.tw/V6e/observe/rainfall/define.htm. 1
cAccumulated precipitation is the total amount of rainfall during each typhoon, where values 2
in parentheses are the average daily precipitation of typhoon. Mean wind speed is expressed 3
as 10-min mean value during each typhoon, where values in parentheses are the maximal 4
measured wind speeds. Wind speed data and accumulated precipitation data were adapted 5
from the lake metabolism database. Website: http://lakemetabolism.org/. 6
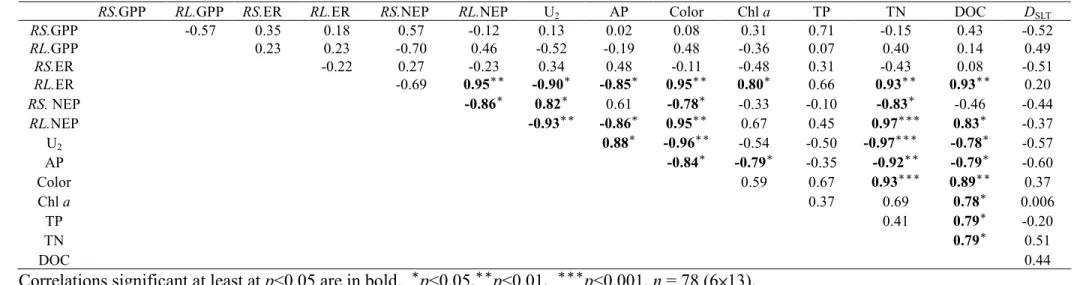
Table 2. Pearson correlation coefficients between resistance (RS) and resilience (RL) in gross primary production (GPP), ecosystem respiration 1
(ER), net ecosystem production (NEP) and averaged wind speed (U2), accumulated precipitation (AP), and changes in chlorophyll a (Chl a), 2
dissolved organic carbon (DOC), water color (Color), total nitrogen (TN), and total phosphorus (TP) in the pre- and post-typhoon periods, and the 3
interval between typhoons (DSLT). 4
5
Correlations significant at least at p<0.05 are in bold. *
p<0.05,**
p<0.01, ***
p<0.001. n = 78 (6×13).
6
RS.GPP RL.GPP RS.ER RL.ER RS.NEP RL.NEP U2 AP Color Chl a TP TN DOC DSLT
RS.GPP -0.57 0.35 0.18 0.57 -0.12 0.13 0.02 0.08 0.31 0.71 -0.15 0.43 -0.52 RL.GPP 0.23 0.23 -0.70 0.46 -0.52 -0.19 0.48 -0.36 0.07 0.40 0.14 0.49 RS.ER -0.22 0.27 -0.23 0.34 0.48 -0.11 -0.48 0.31 -0.43 0.08 -0.51 RL.ER -0.69 0.95** -0.90* -0.85* 0.95** 0.80* 0.66 0.93** 0.93** 0.20 RS. NEP -0.86* 0.82* 0.61 -0.78* -0.33 -0.10 -0.83* -0.46 -0.44 RL.NEP -0.93** -0.86* 0.95** 0.67 0.45 0.97*** 0.83* -0.37 U2 0.88* -0.96** -0.54 -0.50 -0.97*** -0.78* -0.57 AP -0.84* -0.79* -0.35 -0.92** -0.79* -0.60 Color 0.59 0.67 0.93*** 0.89** 0.37 Chl a 0.37 0.69 0.78* 0.006 TP 0.41 0.79* -0.20 TN 0.79* 0.51 DOC 0.44
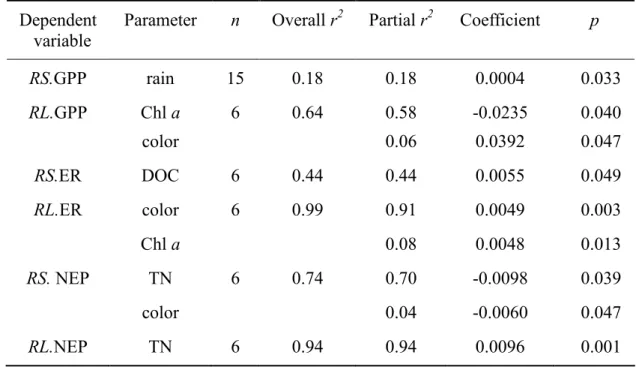
Table 3. Stepwise multiple linear regression analysis of effects of averaged wind speed (U2), 1
accumulated precipitation (AP), and changes in chlorophyll a (Chl a), dissolved organic 2
carbon (DOC), water color (Color), total nitrogen (TN) and total phosphorus (TP) in the pre-3
and post-typhoon periods, and the interval between typhoons (DSLT) on resistance (RS) and 4
resilience (RL) in gross primary production (GPP), ecosystem respiration (ER), net ecosystem 5
production (NEP). Only parameter with P < 0.05 are shown. 6
7
Dependent variable
Parameter n Overall r2 Partial r2 Coefficient p
RS.GPP rain 15 0.18 0.18 0.0004 0.033 RL.GPP Chl a 6 0.64 0.58 -0.0235 0.040 color 0.06 0.0392 0.047 RS.ER DOC 6 0.44 0.44 0.0055 0.049 RL.ER color 6 0.99 0.91 0.0049 0.003 Chl a 0.08 0.0048 0.013 RS. NEP TN 6 0.74 0.70 -0.0098 0.039 color 0.04 -0.0060 0.047 RL.NEP TN 6 0.94 0.94 0.0096 0.001
Figure legends
1
Fig. 1. Location and bathymetric map of Yuan-Yang Lake (YYL), showing the location of
2
the buoy, water level sensor and meteorological station (solid square). 3
Fig. 2. Quantitative change in metabolic parameters, including (a) gross primary production
4
(GPP), (b) ecosystem respiration (ER), and (c) net ecosystem production (NEP) between the 5
3-day mean value before and after typhoons and the corresponding total accumulated 6
precipitation and mean wind speed of typhoons. Typhoon events are ranked from lowest to 7
highest accumulated precipitation. Symbols: Solid bars, values of metabolic parameter before 8
typhoon; gray bars, values of metabolic parameter after typhoons. NS indicates no significant 9
changes (p>0.05). 10
Fig. 3. The percentage change in (a) water color, (b) dissolved organic carbon (DOC), (c)
11
total nutrients (TN), (d) chlorophyll a (Chl a), and (e) total phosphorous (TP) near the mixed 12
surface layer in the periods before and after typhoons of different magnitude. The 13
instantaneous data collected within 3 days before and after typhoons were available for only 6 14
of the 15 recorded typhoons. Symbols: Solid bars, values of limnological variables before 15
typhoon; gray bars, values of limnological variables after typhoons. The data below the 16
graphs indicate the level of total accumulated precipitation. 17
Fig. 4. Daily changes in water level and mixing depth (a, b), and time series of
18
high-frequency (10-min based) signals in (c, d) water temperature on 0 and 3.5 m depth and 19
light intensity. (e, f) Dissolved oxygen (DO) at the surface layer and daily precipitation before, 20
during and after selected typhoon disturbance scenarios (e.g. S2 and L1). The corresponding 21
daily performance of gross primary production (GPP, solid squares), ecosystem respiration 22
(ER, solid circles) and atmospheric flux (Fatm, open circles) are graphically summarized to 23
describe the process accounting for the temporal variance of DO signals (g, h). Shade bars 24
represent the duration of typhoons. 1
Fig. 5. The calculated values of resistance (RS) and resilience (RL) for GPP, ER, and NEP as a
2
function of the accumulated precipitation with a single typhoon. (n = 15) 3
Fig. 6. Scatter plots of RS and RL in metabolic parameters in relation to the percentage change
4
in limnological drivers following typhoons in YYL in (a) GPP and TP, (b) ER and Chl a, (c) 5
NEP and TN, (d) GPP and water color, (e) ER and Chl a, and (f) NEP and Chl a. 6
7 8 9 10