The evolutionary process and
collaboration in supply chains
Hsiu-Chun Cheng
Institute of Business and Management, National Chaio Tung University,
Taipei, Taiwan, Republic of China
Mu-Chen Chen
Institute of Traffic and Transportation, National Chiao Tung University,
Taipei, Taiwan, Republic of China, and
Chi-Kuo Mao
Ministry of Transportation and Communications, Taipei, Taiwan,
Republic of China
Abstract
Purpose – The primary aim of this paper is to investigate the evolutionary process and collaboration within Taiwan’s cut-flower supply chains. The paper also go on to discuss the enablement of supply chain coordination through information technology (IT) adoption and network effects, as well as performance improvements achieved by the introduction of the wholesale information sharing hotline (WISH) system.
Design/methodology/approach – This paper examines the evolutionary process in Taiwan’s cut-flower supply chains from a macro-study perspective, based upon primary data obtained from in-depth interviews. The paper also applies multiple regression analyses from a micro-study perspective, in order to gain insights into the evolution of market share within the supply chains, thereby facilitating the investigation of the effectiveness of the WISH system.
Findings – The results reveal that the auction houses are heavily dependent upon reliable sources of supply, and that in the earlier stages of the evolutionary process, they played a mediating role in the formulation of auction lines based upon retailer demand through the adoption of the e-auction mechanism. Since then, the operational performance of the auction houses has been improved considerably, with horizontal coordination being supported by information sharing through the WISH system. The network effect is found to have a positive correlation with the number of participants within the system.
Originality/value – This paper focuses specifically on the evolutionary process of the cut-flower supply chains in Taiwan, examining the simultaneous achievement of both vertical and horizontal collaboration through the advancement of IT.
Keywords Supply chain management, Auctions, Communication technologies, Taiwan, Generation and dissemination of information
Paper type Research paper
1. Introduction
In negotiations and transactions between the members of supply chains, including suppliers, manufacturers, distributors, and customers, the tendency in the past has been to establish arm’s length relationships; however, significant changes have The current issue and full text archive of this journal is available at
www.emeraldinsight.com/0263-5577.htm
This work was partially supported by National Science Council, Taiwan, Republic of China under Grant NSC 95-2221-E-009-361-MY3.
Evolutionary
process and
collaboration
453
Received 6 October 2009 Revised 4 December 2009 Accepted 29 December 2009Industrial Management & Data Systems Vol. 110 No. 3, 2010 pp. 453-474
q Emerald Group Publishing Limited
0263-5577 DOI 10.1108/02635571011030079
occurred over the years in the evolutionary process of supply chains, leading to a discernible shift from competition to collaboration (Spekman et al., 1998).
Several of the prior studies provide comparative analyses of the differences between competition and collaboration in supply chains (Lamming, 1993; Spekman et al., 1998; Humphreys et al., 2001), with adversarial competition generally being found to be the fundamental strategy, and with the primary focus being placed upon constant supply and restricted information sharing (Humphreys et al., 2001). It has, however, become clear that in terms of improvements in performance, where the participants consider the total benefits to the supply chain as a whole, collaboration clearly outperforms competition; thus, within the overall evolutionary process, the power has now shifted from suppliers to customers (Vargo and Lusch, 2004).
Recent years have witnessed the pursuit of several collaborative initiatives aimed at enhancing the mutual benefits of the parties and improving overall performance. There is compelling evidence that the efficacy of information technology (IT) has a positive effect on collaboration by the moderating effect of existing relationships (Chae et al., 2005); indeed, collaborative strategies of long-term relationship orientation, network governance, and IT advancement can foster inter-firm communication (Paulraj et al., 2008); with such collaborative communication will further bestead performance for both buyers and suppliers (Hadaya and Cassivi, 2007; Paulraj et al., 2008; Zelbst et al., 2009). It has become increasingly apparent, over recent years, that deeper and wider collaboration is now the new trend in supply chain management (SCM), not only from a perspective of vertical integration and collaboration, but also from a horizontal standpoint (Mason et al., 2007). Chan et al. (2004) set up a proposed central coordination system to assist vertical and horizontal supply chain collaboration for optimizing the demand allocations. With collaboration among small-to-medium-sized enterprises accessing to global markets, vertical connections yield manufacturing productivity along the supply chain, while horizontal relationships enable collective resource source and joint product innovation; indeed, dilemmas of vertical and horizontal cooperation can be overcome by relational governance, enhancing mutual ability to align goals and to craft common strategies (Mesquita and Lazzarini, 2008).
In Taiwan, for example, the cut-flower industry has gone through some major changes over recent years, particularly in the areas of supply chain strategy, behaviour and relationships. Therefore, we set out with the primary aim of describing the evolutionary process of supply chains, and go on to examine the ways in which vertical and horizontal collaboration has been achieved using the wholesale information sharing hotline (WISH) system.
We divide the overall evolutionary process into three stages to facilitate our examination of the changes in supply chains and the driving forces triggering these changes during each of these stages. Five auction houses, Tai-Pei Auction House (TPAH), Chang-Hua Auction House (CHAH), Tai-Nan Auction House (TNAH), Tai-Chung Auction House (TCAH) and Kao-Hsiung Auction House (KHAH), provide the trading platforms for producers and retailers.
In our exploration of SCM during these three distinct stages, we place particular focus on the adoption of IT, since this can simultaneously achieve both vertical and horizontal collaboration; and yet, this is an area in which there is relatively little evidence of any prior research. Thus, through our observations of the evolutionary path, we also demonstrate the network effects of IT within supply chain collaboration.
IMDS
110,3
The remainder of this paper is organized as follows. In the following section, we provide a review of the literature. This is followed in Section 3 by a description of the evolutionary process of supply chains based on a macro-study perspective. With a micro-study perspective, the methodology adopted for this study is subsequently presented in Section 4, followed in Section 5 by our presentation of the results and a brief discussion. The conclusions and limitations drawn from this study are presented in Section 6. Finally, Section 7 closes the paper with a brief discussion on managerial implications.
2. Literature review
2.1 Background to the evolution of the supply chain
Collaboration has become the core trading mechanism amongst supply chain partners over the past decade or so; such collaboration has nevertheless advanced still further over the latter part of this period, with several initiatives having succeeded in bringing about much deeper and wider collaboration. These initiatives include vendor-managed inventory (VMI), the e-marketplace and collaborative planning, forecasting and replenishment (CPFR).
In VMI, the vendor manages the buyer’s inventory, i.e. the vendor makes the decisions on the appropriate inventory levels within the previously agreed-upon bounds and the appropriate inventory polices (Simchi-Levi et al., 2008). CPFR is an initiative for supply chain collaboration developed by Voluntary Interindustry Commerce Standards (VICS). It is defined as a business practice that combines the intelligence of multiple trading partners in the planning and fulfillment of customer demand (VICS, 2004).
Members have traditionally carried out their business based upon arm’s length relationships, with an emphasis on individual activities and restricted information sharing (Chen et al., 2007). Such arm’s length relationships were invariably based upon only a single transaction, focusing mainly on price negotiations and the guarantee of a constant supply (Humphreys et al., 2001). Nowadays, the evolutionary stages of a supply chain essentially comprise of a flow from competition to cooperation and coordination, and ultimately, collaboration (Spekman et al., 1998).
Competition can be regarded as a network of firms competing with other firms along the entire supply chain. With the move to the cooperation stage, it becomes necessary to ensure the effective integration of the functions of all of the interdependent units in order to meet consumer needs. In the coordination stage, workflows and information linkages between the trading parties are further integrated. Finally, the collaboration stage involves the highest level of intensity of this relationship, within which the trading partners integrate their major consumer processes to achieve their common, desired goals based upon mutual trust and commitment (Spekman et al., 1998; Claro et al., 2006; Matopoulos et al., 2007).
Several of the prior studies have provided outline sketches of the critical differences between competition and collaboration (Lamming, 1993; Humphreys et al., 2001). These studies show that collaboration generally outperforms competition, particularly with regard to improvements in general performance.
The general approach to SCM has consequently shifted towards greater emphasis on considerations of global optimization, thereby taking into account the benefits accrued from the supply chain as a whole, as opposed to the benefits that may be accrued by individual firms. As a result, customers now have much greater power and
Evolutionary
process and
collaboration
455
influence over supply chains than ever before (Vargo and Lusch, 2004); thus, the focus in SCM has essentially shifted from supply management to demand management.
Several studies have noted that important driving forces, such as subtle changes over time in the attributes of consumption, stricter regulations and laws, globalization and consolidation, can each enhance the design and administration of supply chain relationships, thereby affecting the product and transaction characteristics to force an increase in intensity of collaboration (Matopoulos et al., 2007). In much of the prior related literature, the tendency has been to explore vertical integration amongst trading partners; however, successful integration within a supply chain will necessarily involve a combination of core processes across different echelons and organizational boundaries pertaining to coordination and partnership.
Within the overall process of supply chain integration and collaboration, the issues are generally seen as requiring a focus on two essential areas. First, there is the need to establish the strategies, types of behaviour and relationships that can most appropriately facilitate the integration of supply chain planning and processes, such as demand management, organizational interdependence, the formation of trust and commitment and the setting up of long-term partnerships (Patnayakuni et al., 2006; Hadaya and Cassivi, 2007; Klein, 2007; Paulraj et al., 2008).
Second, there is a clear requirement for all parties within the chain to recognize the need to embrace the types of IT systems that are now being widely applied to supply chain integration and collaboration to facilitate information pooling and sharing, as a result of which, there is clear potential for improvements in operational performance (Huang and Iravani, 2005; Barratt and Oke, 2007; Klein, 2007; Paulraj et al., 2008).
SCM has recently evolved into a process of much deeper and wider collaboration involving both vertical and horizontal cooperation and integration (Chan et al., 2004; Mason et al., 2007; Mesquita and Lazzarini, 2008). Mentzer et al. (2000) define supply chain collaboration as a situation in which all partners within supply chains can be seamlessly integrated into one virtual network with common achievable goals that are totally aligned. The three elements of collaboration which are regarded as enablers capable of effectively enhancing performance are information sharing, decision synchronization and incentive alignment (Mentzer et al., 2000; Simatupang and Sridharan, 2004).
2.2 Supply chain collaboration through IT
It is quite clear that IT has played an enabling role in supply chain collaboration; indeed, many of the prior studies indicate that information sharing through e-business technology is a fundamental element of supply chain integration and collaboration. As noted by both Swaminathan and Tayur (2003) and Klein (2007), e-business technology and the resultant-enabled information systems represent a business process which makes best use of internet to complete business transactions.
Patnayakuni et al. (2006) confirm that the integration of information flows is an essential element of supply chain integration, with all parties involved being required to share transactional, operational and strategic data. The actual extent of information sharing is exemplified by the level of visibility (Barratt and Oke, 2007). In support of information sharing and visibility, the primary aim of which is the achievement of supply chain collaboration, the range of IT available has proliferated (Klein, 2007).
Therefore, information sharing and visibility can clearly enhance benefits, such as improvements of operational performance, reductions in inventory levels, increases in
IMDS
110,3
fulfillment rates and responsiveness to changing demand. Organizations can also benefit from the information pooling effect across two supply chains (Huang and Iravani, 2005). The adoption of e-auction mechanisms ensures the necessary enhanced information sharing, whilst also brings additional benefits to buyers and sellers, with such benefits including reduced transaction costs, shorter order cycle times, increased visibility and efficiency, competitive purchase prices and the pooling of potential suppliers (Hartley et al., 2004). Within the cut-flower industry, for example, the joint effects of collaborative coordination with suppliers have been accomplished through the adoption of the Dutch auction system; as a result, in the context of such cooperative relationships, the moderating effect of information sharing was discernible between transaction-specific investments and collaborative effects, and such collaboration brought the benefits to both buyers and suppliers (Claro et al., 2006).
Lee and Kumara (2007) designed an auction involving the management of a supplier’s inventory to coordinate planning between the supplier and its customers; they demonstrated that such a coordinating mechanism was capable of providing agents with reasonable profits, and thereby also providing them with an additional motivation to share their information. Thus, through the e-auction system, buyers are able to engage in a coordination strategy with their suppliers as an effective means of reducing costs on the basis of accepted contracts (Hartley et al., 2004).
Chen et al. (2007) further revealed that when selecting an appropriate collaborative scenario, members need to consider the level of technology possessed by their partners. According to the evaluations undertaken by Gowrisankaran and Stavins (2004), technology adoption and advancement can facilitate network effects to a significant degree, with positive network effects increasing with network participants. Indeed, Zhao et al. (2007) confirmed that the overall benefits for firms are generally determined by the quality of their collaboration and the number of other firms adopting the system due to the positive network effect which it provides.
3. Taiwan’s cut-flower industry and the WISH system
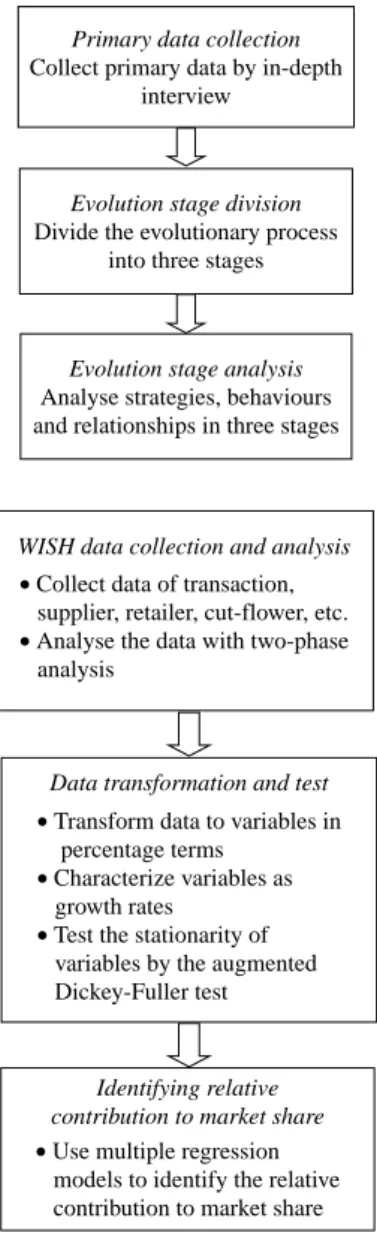
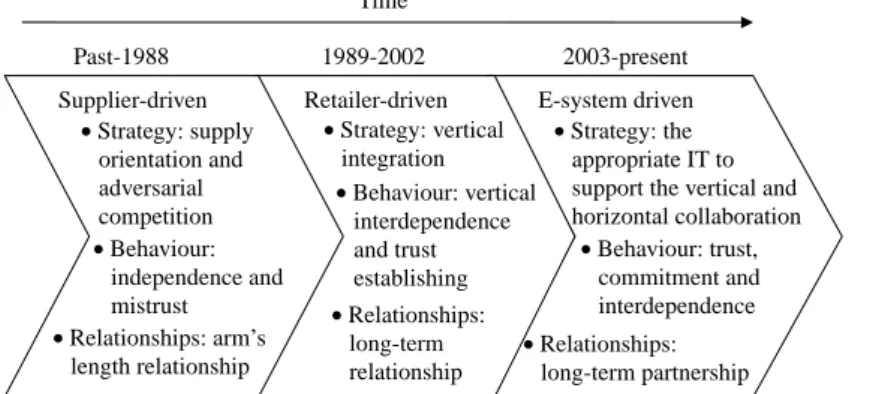
Significant changes have taken place in the cut-flower industry in Taiwan over the past two decades, with a discernible shift in some supply chains from traditional adversarial competition, based upon individual firms, towards deeper inter-firm collaboration. In this paper, the analytical process consists of two perspectives, macro-study and micro-study (Figures 1 and 2). In the macro-study perspective, a case study approach is adopted since it allows us to conduct with the aim of identifying forces that facilitate the evolution of supply chains, as well as factors that have an influence on such evolution; the method of research was carried out following the inductive case study by Mintzberg and McHugh (1985) with a longitudinal approach through direct observation and in-depth interviews. More generally, case studies are recognized not only as an especially valuable in exploratory research, but also as a good approach in attempt to understand what and why observed patterns occur. In principle, an historical reconstruction is either more feasible or more desirable; therefore, we set out in this study to investigate three evolution stages and characteristics of strategies, behaviours and relationships in these stages (Figure 3), which are identified and classified according to the primary data from the in-depth interview with senior managers and the founder of WISH system. In this section, the evolution of Taiwan’s cut-flower supply chains is discussed by using the macro-study.
Evolutionary
process and
collaboration
457
3.1 The evolution of supply chains
Our primary concern in this study is the evolutionary process of supply chains, with particular focus on strategies, behaviours and relationships in support of the development of the cut-flower industry during the different stages of evolution. Such evolution comprises of three distinct stages, characterized as “supplier-driven,” “retailer-driven,” and “e-system-driven” stages. In the following part, we describe the essential elements of SCM throughout these three stages of evolution.
3.1.1 The supplier-driven stage (pre-1988). During this introductory stage, a time when most of productions and sales were driven by individual growers providing Figure 1.
The flowchart of macro-study perspective
Primary data collection
Collect primary data by in-depth interview
Evolution stage division
Divide the evolutionary process into three stages
Evolution stage analysis
Analyse strategies, behaviours and relationships in three stages
Figure 2. The flowchart
of micro-study perspective
WISH data collection and analysis
• Collect data of transaction, supplier, retailer, cut-flower, etc. • Analyse the data with two-phase analysis
Data transformation and test
Identifying relative contribution to market share
• Use multiple regression models to identify the relative contribution to market share • Transform data to variables in percentage terms
• Characterize variables as growth rates
• Test the stationarity of variables by the augmented Dickey-Fuller test
IMDS
110,3
a rather scattered system of supply, traditional transaction mechanisms, such as bargaining and open-auction trading by auctioneers, were applied to the negotiation of all cut-flower transactions. These transactions were negotiated separately in different supply chains based upon single spot transactions.
In this stage, competition was much more prevalent than cooperation in the same supply chain, as well as across various supply chains. All members operated independently, with very little communication or coordination. Based on the comparison with other industries, provision of flowers was accordingly constrained by product features such as limitations due to weather conditions, discontinuous supply, volatile demand, greater surpluses and higher transaction costs. In other words, all of these factors would tend to hinder the establishment and maintenance of trust and commitment between members. As a result of all of these challenges, coordination was difficult to achieve.
The e-auction mechanism, which emerged in 1988, represented the start of the shift from the supplier-driven supply chain towards a retailer-driven system; there was a discernible shift in market power from suppliers to customers. As noted earlier, the fragmented exchange of flowers throughout the cut-flower industry had led to some challenges during the supplier-driven stage could be reduced in the retailer-driven stage as a result of better demand management.
3.1.2 The retailer-driven stage (1989-2002). During this second evolutionary stage, auction houses became not only the aggregators of cut flowers, but also trading platforms for producers and retailers. The trading mechanism was the electronic auction clock system, based upon the Dutch auction system, which follows a price-reduction principle. This auction mechanism has the capability of effectively determining price setting by coordinating partnerships with the entire auction-house force within the same supply chain.
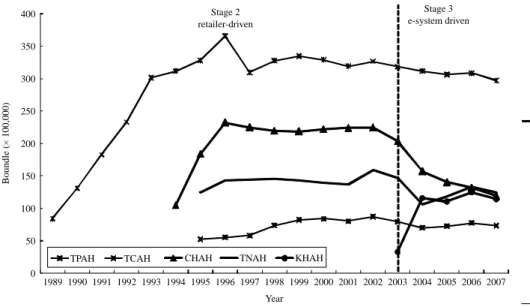
In 1989-1994, three e-auction houses were established, designed specifically for retailers. TPAH had been founded in March 1988. Following the achievement of a growth rate of 38.6 percent in the total supply of flowers between 1989 and 1993 (Figure 4), CHAH was set up in April 1994, with TNAH also being established in the same year. The total transaction quantity throughout the auction lines saw a further significant increase of 38.3 percent between 1993 and 1994, with the main contribution to this market growth having been made by CHAH. The total transaction volume
Figure 3. The evolutionary process of supply chains in Taiwan’s cut-flower industry E-system driven • Behaviour: trust, commitment and interdependence • Relationships: long-term partnership Retailer-driven • Strategy: vertical integration • Behaviour: vertical interdependence and trust establishing • Relationships: long-term relationship Supplier-driven • Strategy: supply orientation and adversarial competition • Behaviour: independence and mistrust • Relationships: arm’s length relationship Past-1988 1989-2002 2003-present Time • Strategy: the appropriate IT to support the vertical and horizontal collaboration
Evolutionary
process and
collaboration
459
continued to increase rapidly between 1994 and 1995 (by about 65.4 percent), with the mainly contributed by CHAH and TNAH.
By 1995, the auction houses were accounting for most of the retail sales; the cut-flower market was therefore almost exclusively controlled by the three supply chains referred to above. Thus, the setting up of TCAH in January 1995 actually occurred by accident, with the formation of TCAH arising not out of concern for market forces, but simply as a result of government policy.
With the continuing evolution of the cut-flower industry, the total transaction volume throughout the auction lines had grown by approximately 15.5 percent between 1995 and 1996; however, the contributions to growth had come mainly from TPAH, CHAH, and TNAH, and not from the latest addition to the auction house, TCAH (Figures 4 and 5). This represents that the government policy implemented at this time had little effect on market growth. Nevertheless, from 1996 onwards, these four auction houses were together accounting for all market share of the cut-flower industry in Taiwan. It should be noted that during this period, the soaring growth in cut flowers was mainly due to the adoption of the e-auction mechanism.
Based upon the e-auction platform, producers and retailers had begun to form partnerships; thus, it represents a very important period in the overall evolution of the cut-flower industry. With such partnerships, agents in the auction houses were able to engage in reverse integration with producers and in forward integration with retailers based upon fixed auction lines. Thus, auction houses had succeeded in overtaking suppliers to emerge as the more powerful players, in terms of overall procurement decision making based upon customer demand.
In this stage, producers were requested to provide information on the types of flowers that they were planning to provide to auction houses, and in what quantities, one week in advance of the auction date. Retailers usually purchasing their flowers in the neighboring auction houses. Furthermore, partnerships could offer substantial Figure 4.
The trend of the total supply in Taiwan’s cut-flower industry 0 100 200 300 400 500 600 700 800 900 1989 1990 1991 1992 1993 1994 1995 1996 1997 1998 1999 2000 2001 2002 2003 2004 2005 2006 2007 Year Stage 2 retailer-driven Stage 3 e-system-driven TPAH CHAH and TNAH TCAH KHAH and WISH system Bundle (× 100,000)
IMDS
110,3
460
benefits, such as improvements in operational efficiency and a reduction in both transaction costs and surplus cut flowers within the supply chain. Indeed, examples of closer and deeper vertical cooperation were already an established feature of the supply chain evolution within the cut-flower industry.
3.1.3 The e-system-driven period (2003-present). During this final stage of evolution, the cut-flower industry has become characterized by a much more sophisticated and collaborative structure. Collaboration has evolved during this stage to become an essential mechanism and characteristic of SCM. Through collaboration, formerly dispersed supply chain partners are integrated into a single virtual network with all goals and operational and strategic activities being effectively aligned. Horizontal collaboration across supply chains is supported by the WISH system. The adoption of WISH causes an effect of information pooling and sharing. The attraction of new participants including suppliers and retailers (increasing by 13.9 and 13.5 percent, respectively), can generate positive network effects. The WISH system facilitates such externality effects in the cut-flower supply chains; that is, the system and the community of traders can mutually reinforce each other.
As IT systems continue to become more advanced, the e-supply chain has the capability of leverage the benefits from visibility across supply chains leading to improved performance, appropriate responses to changing demand and increasingly developed retailer services.
KHAH was founded in September 2003, in an attempt to satisfy the requirements of retailers; as a result, many of the nearby producers and retailers were subsequently attracted to trade in cut flowers within KHAH. Thus, whilst total market sales remained stable, there were significant reductions between 2003 and 2004 in the total transaction quantity from growers for CHAH and TNAH. It represents that the introduction of KHAH results in the redistribution of market shares in Taiwan’s cut-flower supply chains.
Figure 5. The Trend of the total supply in five auction houses in Taiwan’s cut-flower industry 0 50 100 150 200 250 300 350 400 1989 1990 1991 1992 1993 1994 1995 1996 1997 1998 1999 2000 2001 2002 2003 2004 2005 2006 2007 Year Stage 2 retailer-driven Boundle (× 100,000) Stage 3 e-system driven
TPAH TCAH CHAH TNAH KHAH
Evolutionary
process and
collaboration
461
From an holistic viewpoint of the flower market in Taiwan, the development of these five auction houses meant that they were now covering virtually all retail sales, with the traders in these auction houses being widely geographically dispersed throughout the island.
By observing the changing circumstances in the three defining stages described above, we can clearly identify the evolution of the supply chains in Taiwan’s cut-flower industry. As described in the foregoing sections, deeper and wider collaboration has continued to develop amongst all partners in the same auction lines, as well as across the various auction lines. It is therefore quite clear from the scenario examined in this study that collaboration is an essential strategic element of modern-day SCM.
3.2 The WISH system
The WISH system, which was established in 2002, formally began operations, involving the sharing of raw transaction data, in September 2003. This system comprises of several data marts and a data warehouse engaging in the automatic collection and transmission of daily transaction data from auction clocks in each of the auction houses via the internet (Figure 6).
The software used in this system includes PowerPlay Web Server, and Impromptu and Visualizer from Cognos in Canada. The system is also equipped with advanced data analysis tools, such as on-line analytical processing, on-line analytical mining, and decision support system (DSS), enabling it to efficiently integrate and analyze all daily transaction data. There are a total of 12 dimensions in this system, including date, week, type of supplier, location of supplier, location of retailer, flower assortment, flower grade, auction line, container, auction house, celebration (e.g. Valentine’s day and so on) and lunar calendar. In addition to these dimensions, a total of 24 performance measures are recorded within the system.
4. Methodology
In the macro-study with a case, we found that vertical collaboration amongst supply chain members is formulated through the e-auction mechanism, whilst the WISH
Figure 6.
The information flow of the WISH system
Auction houses TPAH Data warehouse On-line transaction processing; OLTP CHAH TNAH TCAH KHAH DSS OLAM OLAP Dimensions Measures Implicit parameters in model Wholesalers Retailers Producers Auction clock Data warehouse technique Transaction File
transmission Transmitto server Transfer Datamart
IMDS
110,3
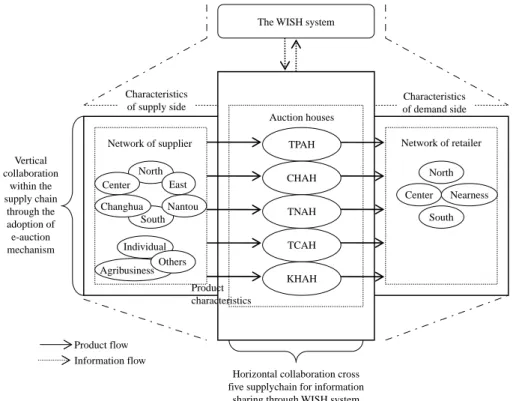
system has also enabled the horizontal collaboration of transaction information across the five auction houses (Figure 7). In order to manage both demand and supply, and to reduce daily surpluses, the agents in auction houses can monitor the daily supply of cut flowers from suppliers as well as the transaction volume of retailers. Adopting a micro-study perspective, we go on in this study to verify, and provide insights into, the evolution of market share in the supply chains, and to investigate the effectiveness of the WISH system. The adoption of multiple regression models to examine whether market share has been extended in order to clearly identify the evolution of supply chains based on the time series data collected from the WISH system.
It is noted that those adopting the e-auction system have higher annual sales and substantially higher market share than those who elect not to adopt the system (Hartley et al., 2004); indeed, the redistribution of market share is seen as a direct effect of the evolution of the network. Clark and Chatterjee (1999) demonstrated that network effects have direct impacts on the evolution of market share, since enhancements to product quality attract more customers, thereby raising market share. From in-depth analyses carried out on e-auction systems in a business-to-business situation, the potential antecedents were categorized as inputs, processes and outcomes, with inputs being considered as the characteristics of suppliers, retailers, and products (Parente et al., 2004).
Apart from the variable of market share, other variables are considered in this study, including the attributes of both retailers and suppliers and product characteristics. The different sources of supply and demand have direct influences
Figure 7. The diagram of vertical and horizontal collaboration Vertical collaboration within the supply chain through the adoption of e-auction mechanism
Network of supplier Network of retailer
Product characteristics TPAH CHAH TNAH TCAH KHAH Characteristics of supply side Characteristics of demand side
Horizontal collaboration cross five supplychain for information
sharing through WISH system The WISH system
North East South Nantou Center Changhua Individual Others North Center South Nearness Auction houses Agribusiness Product flow Information flow
Evolutionary
process and
collaboration
463
on auction quantity; this represents the evolution of agents within the supply chains, since the evolutionary stage has now shifted from “retailer-driven” to “e-system-driven.” The effective reduction in the overall costs arising from waste products through the use of e-auctions further verifies the effectiveness of WISH and its influence on market share.
4.1 Data collection
This empirical study adopts a two-phase analysis aimed at exploring the evolution of supply chains, to determine the major implications for SCM. We use transaction data on all participants. The monthly transaction data used in this study, covering the period from January 1998 to July 2008, are retrieved from the WISH system and then divided into two sub-periods; the earlier period, which runs from January 1998 to August 2003, is used to explore the way in which the market shares of TPAH CHAH, TNAH, and TCAH were extension based on different source of supply, sales of retailer, flower characteristics and reducing surplus ratio, whilst the later period, which runs from September 2003 to July 2008, is adopted to examine how TPAH, CHAH, TNAH, and TCAH were affected by the setup of KHAH, the evolution of agents and the performance improvement by WISH were investigated.
Other important data, such as location and type of participants and product characteristics, are also collected by the WISH platform, and since producers and retailers are interconnected by the auction houses through their establishment of contractual relationships, they are requested to provide their current profile. The auction price and volume are automatically generated by the WISH system for each day apart from those days when the auction houses announce that they will be closed. Any surplus flowers cannot be traded on the following day.
4.2 Summary of the data
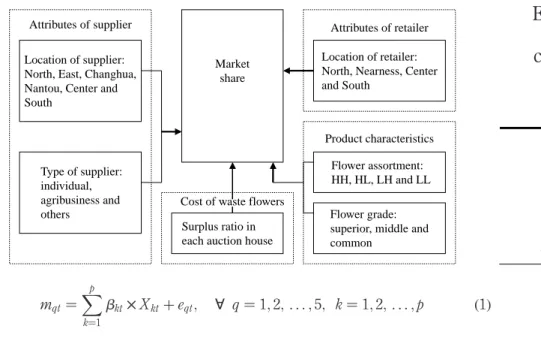
As noted earlier, the variables considered in this paper include surplus ratio, type of supplier, location of supplier, location of retailer, flower assortment, and flower grade (the relationships and comprehensive descriptive statistics of variables are shown in Figure 8 and Table I). Market share, which indicates the percentage of auction quantity in each auction house, is taken as the dependent variable.
The variables are presented in percentage terms so as to remove all factors relating to trends and seasonality. We adopt the augmented Dickey-Fuller test (Dickey and Fuller, 1981) as the unit root test to examine the stationarity of each variable due to the potential problem of spurious regressions (Granger and Newbold, 1974). To avoid the problem of spurious regressions, all variables are transformed into the form of
ðzt2 zt21Þ=zt21 in this study.
4.3 The analytical models
This study adopts multiple regression models for the systematic analysis data collected from the WISH system. In order to clearly identify the relative contribution to market share by each of the independent variables, the impacted market share index
comprises of a systematic component ðPpk¼1bkt£ XktÞ and a stochastic component
(eqt), with mqt,q denoting each auction house:
IMDS
110,3
mqt¼
Xp
k¼1
bkt£ Xktþ eqt; ; q ¼ 1; 2; . . . ; 5; k ¼ 1; 2; . . . ; p ð1Þ
where eqt ¼Pni¼1bieqt2iþ uqtþPmj¼1hjuqt2j is the Cochrane-Orcutt procedure; uqt
represents the disturbance term; and bi(jbij , 1) and hjrepresent the parameters to be
estimated for i ¼ 1, 2, . . . , n, j ¼ 1, 2, . . . , m. The Cochrane-Orcutt procedure corrected for autocorrelation in order to satisfy the assumptions of classical linear regression.
In the interpretation of Model 1, the systematic component is a linear combination of the
independent variables (Xkt), in which the coefficientsbktcorrespond with the variable k
(k ¼ 1, 2, . . . , p) at time t (t ¼ 1, 2, . . . , 67) for the first period, t ¼ 1, 2, . . . , 58 for the second period). The residual term is also tested to fit the classical normal linear assumptions. All of the analyses are performed using the EVIEW statistical software package.
5. Results and discussions
We first of all analyze the data covering the period from January 1998 to August 2003 using the ordinary least square method to estimate the coefficients of each model. The models are summarized in Tables II and III. Table II presents the multiple regression models of four auction houses (Models 1-4), and revealing each market share extension from the relative contribution of independent variables.
Certain findings are discernible from the results shown in Table II, the results are summarized in Table IV, and two major points arise from these results:
(1) All auction houses are heavily dependent upon reliable sources of supply. (2) There was room for improvement in the operational performance of both TPAH
and CHAH in the early stages, since their surplus ratios have had negative impacts on the growth rate in market share.
Analysis of the data covering the period from September 2003 to July 2008 reveals the way in which the growth in market shares of TPAH, CHAH, TNAH, and TCAH were affected by the introduction of KHAH, the evolution of agents in the network and
Figure 8. The relationship amongst variables Market share Attributes of supplier Location of supplier: North, East, Changhua, Nantou, Center and South Type of supplier: individual, agribusiness and others Attributes of retailer Location of retailer: North, Nearness, Center and South
Product characteristics Flower assortment: HH, HL, LH and LL Flower grade: superior, middle and common
Surplus ratio in each auction house Cost of waste flowers
Evolutionary
process and
collaboration
465
TPAH (%) CHAH (%) TNAH (%) TCAH (%) KHAH (%) Variable Phas e 1 Phas e 2 Phas e 1 Phas e 2 Phas e 1 Phas e 2 Phas e 1 Phas e 2 Phas e 1 Phas e 2 Defi nition mqt 40. 4 37. 5 29. 5 18. 4 19. 5 17. 8 10. 7 9.8 n/a 16. 5 M arket share in each aucti on house rqt 4.0 2.7 5.3 4.0 6.0 4.3 6.5 5.3 n/a 4.8 Surpl us ratio equals surplus div ided by supply s_ locatio nt North 6.1 6.8 3.5 4.1 3.1 5.2 3.1 3.7 n/a 6.1 Location of supplier rep resents a supplier being East 8.0 6.1 0.7 1.0 8.1 11. 9 8.9 13. 0 0.9 reg istered in the area, including No rth, Eas t, Changhua 31. 2 27. 8 54. 2 42. 9 44. 9 36. 0 28. 2 24. 4 39. 1 Changhua (the large st sourc e of supply in Nant ou 24. 4 21. 9 15. 7 16. 3 17. 3 16. 6 21. 8 21. 7 19. 0 Ta iwan), Na ntou (the secondary sourc e of Center 12. 7 18. 9 10. 7 13. 9 10. 3 12. 8 25. 1 25. 0 13. 1 supply in Taiwan), Center or So uth South 17. 6 18. 5 15. 2 21. 8 16. 3 17. 5 12. 9 12. 2 21. 8 s_ type t Indiv idual 59. 9 71. 0 11. 1 14. 7 29. 6 33. 7 13. 4 16. 9 n/a 60. 0 Type of supplier repres ents a supplier being Agribusiness 30. 0 21. 9 85. 6 80. 7 63. 3 55. 0 84. 3 80. 6 29. 8 reg istered as individual farmer, agribusiness or Other s 10. 1 7.1 3.3 4.6 7.1 11. 3 2.3 2.5 10. 2 oth ers r_ lo cation t North 11. 9 10. 7 0.7 1.9 0 0 13. 6 12. 4 n/a 0 Location of retai ler represents a retai ler being Nearn ess 81. 7 83. 5 28. 6 44. 7 50. 2 70. 4 25. 9 29. 9 43. 7 reg istered in the area, including N orth, Nearnes s, Center 3.7 2.5 27. 3 34. 8 2.8 5.6 49. 3 47. 6 0 Ce nter or Sout h; whe re Nearn ess ind icates South 2.7 3.3 43. 3 18. 6 47. 0 24. 0 11. 2 10. 1 54. 5 whe ther the location of retai ler is registered as being in close proxi mity to an aucti on house FA t HH 30. 5 31. 6 23. 0 24. 5 21. 6 24. 3 27. 8 26. 3 n/a 22. 7 Fl ower assor tment (FA) is class ified unde r fou r HL 39. 3 36. 1 53. 6 52. 7 53. 7 47. 8 38. 3 37. 1 42. 0 qua drants, wit h H H rep resen ting hig h au ction LH 9.0 6.6 7.3 6.3 5.6 4.2 4.9 4.1 6.7 ra tio an d hig h price, HL rep resen ting hig h LL 21. 2 25. 7 16. 1 16. 5 19. 1 23. 7 29. 0 32. 5 28. 6 au ction ratio and low pri ce, LH rep resenting low au ction rat io an d high pri ce and LL representing low au ction ratio and low pri ce FG t Supe rior 91. 9 93. 7 86. 6 90. 0 90. 0 91. 8 86. 4 89. 0 n/a 94. 2 Fl ower grade (F G) rep resents the flowe r bei ng Midd le 7.1 5.5 12. 5 8.9 10. 2 7.5 12. 3 9.7 5.2 cla ssified unde r three classes , wit h superior, Comm on 1.0 0.8 0.9 1.1 0.8 0.7 1.3 1.3 0.6 middl e or com mon Table I. Summary descriptions of all variables in two-phase study
IMDS
110,3
466
Model 1 Model 2 Model 3 Model 4 Models m1 t ¼ 0: 09 £ s_center1 t ð0 :02 Þ þ 0: 16 £ s_unit t ð0 :06 Þ 2 0: 01 £ r1t ð0 :00 Þ þ 0: 16 £ HH t þ e1t ð0 :04 Þ m2 t ¼ 0: 12 £ s_changhua t ð0 :05 Þ þ 0: 03 £ s_north t ð0 :01 Þ 2 0: 02 £ r2t ð0 :00 Þ þ 0: 30 £ HL t þ e2t ð0 :07 Þ m3 t ¼ 0: 09 £ s_changhua t ð0 :09 Þ 2 0: 47 £ s_unit t ð0 :19 Þ þ 0: 43 £ HL t þ e3t ð0 :10 Þ m4 t ¼ 2 0: 30 £ s_center t ð0 :08 Þ þ 0: 13 £ s_nantou t ð0 :04 Þ 2 0: 17 £ r_center t ð0 :10 Þ þ 0: 11 £ HH t þ e4t ð0 :06 Þ where e1t ¼ 0: 08 £ e1t2 1 þ u1t 2 0: 98 £ u1t2 1 where e2t ¼ u2t 2 0: 71 £ u2t2 1 where e3t ¼ 2 0: 18 £ e3t2 1 þ u3t where e4t ¼ u4t 2 0: 45 £ u4t2 1 Residual test Mean (SD) 0.00 (0.03) 0.00 (0.03) 0.00 (0.05) 0.01 (0.04) JB-test; p -value 0.36; 0.84 3.76; 0.15 0.04; 0.98 5.15; 0.08 Autocorrelation No No No No Notes: s_center1 t represented s_center t and s_changhua t ; p , 0.05 Table II. Multiple regression models of the growth in market shares of TPAH, CHAH, TNAH, and TCAH from January 1998 to August 2003
Evolutionary
process and
collaboration
467
Model 5 Model 6 Model 7 Model 8 Models m1 t ¼ 2 0: 02 £ m5 t ð0 :01 Þ þ 0: 10 £ s_noea t ð0 :04 Þ þ 0: 71 £ superior t ð0 :28 Þ þ e1t m2 t ¼ 2 0: 04 £ m5 t ð0 :01 Þ þ 0: 09 £ r_south t ð0 :04 Þ 2 0: 11 £ r_center t ð0 :07 Þ 2 0: 09 £ LH t ð0 :04 Þ þ 0: 12 £ middle t þ e2t ð0 :03 Þ m3 t ¼ 2 0: 06 £ m5 t ð0 :02 Þ þ 0: 36 £ r_south t ð0 :05 Þ þ 0: 49 £ HL t þ e3t ð0 :15 Þ m4 t ¼ 2 0: 02 £ m5 t ð0 :01 Þ þ 0: 11 £ s_nantou t ð0 :02 Þ þ 0: 10 £ s_noea t ð0 :03 Þ þ 0: 04 £ r_north t þ e4t ð0 :02 Þ where e1t ¼ u1t 2 0: 74 £ u1t2 1 where e2t ¼ 2 0: 60 £ e2t2 1 þ u2t where e3t ¼ u3t 2 0: 60 £ u3t2 1 where e4t ¼ u4t 2 0: 96 £ u4t2 1 Residual test Mean (SD) 0.00 (0.04) 2 0.00 (0.04) 0.02 (0.08) 0.00 (0.04) JB-test; p -value 1.71; 0.43 5.53; 0.06 2.51; 0.28 2.61; 0.27 Autocorrelation No No No No Notes: s_noea t represented s_north t and s_east t ; p , 0.05 Table III. Multiple regression models of the growth in market shares of TPAH, CHAH, TNAH, and TCAH from September 2003 to July 2008
IMDS
110,3
TPAH CHAH TNAH TCAH Relationship with KHAH Negative Negative Negative Negative Surplus ratio Phase 1 Negative Negative Irrelevant Irrelevant Phase 2 Irrelevant Irrelevant Irrelevant Irrelevant Attributes of supplier Phase 1 The reliable supply from Changhua (the largest source of supply in Taiwan) and central Taiwan, where most of the suppliers being registered as agribusiness Reliable supply sources from Changhua, and Northern Taiwan The reliable supply source from Changhua whilst the unreliable suppliers being registered as agribusiness The reliable supply source from Nantou (the secondary source of supply in Taiwan) whilst the unreliable supply source from central Taiwan Phase 2 The reliable supply sources from Northern and Eastern Taiwan Irrelevant Irrelevant The reliable supply sources from Nantou, Northern and Eastern Taiwan Attributes of retailer Phase 1 Irrelevant Irrelevant Irrelevant The unstable sales in central Taiwan Phase 2 Irrelevant The reliable sales in Southern Taiwan but unstable sales in Northern Taiwan The reliable sales in Southern Taiwan The reliable sales in Northern Taiwan Product characteristics Phase 1 The reliable auction quantity of HH flower assortment The reliable auction quantity of HL The reliable auction quantity of HL The reliable auction quantity of HH Phase 2 The reliable auction quantity of superior grade The reliable auction quantity of middle grade whilst the unreliable auction quantity of LH The reliable auction quantity of HL Irrelevant Table IV. Comparison with four auction houses involving surplus ratio and attributes of supplier, retail, and product in the two periods
Evolutionary
process and
collaboration
469
the effectiveness of WISH were investigated. Our analysis involves Models 5-8, shown in Table III. The results are summarized in Table IV.
Three major points arise from these results:
(1) Since KHAH was established by retailer force, and since many nearby producers and retailers carry out their business in KHAH, the growth in the market share of KHAH has had negative impacts on those of TPAH, CHAH, TNAH, and TCAH.
(2) The mainly reliable sources of supply have changed in TPAH, CHAH and TNAH, and the reliable sales of retailers also have transferred in CHAH, TNAH and TCAH.
(3) Since the surplus ratio has no relevance to the growth rate in market share, there have been improvements in the operational performance of all of the auction houses in this final evolutionary stage.
Observing the comparison of results from two periods, we summarize two important findings. First, the evolution of network in terms of the changes of retailers and suppliers is seen as a direct effect on the dynamics of market share. Second, the operational performance has improved in auction houses since coordination for information sharing is supported by the WISH system.
This study provides empirical evidence in the evolution of network and the improvement of operational performance. Based on the general value of presented models, on the one hand, such models can be applied to other industries, such as other agricultural industries and manufacturing domain, for investigating the evolutionary process of supply chains with a longitudinal approach; on the other hand, the characteristics of networks influencing the evolution of supply chains are addressed in terms of most aspects of collaboration through IT.
6. Conclusions and limitations
This study describes the evolutionary process of supply chains in the cut-flower industry in Taiwan, with particular focus on a discussion of both vertical and horizontal collaboration, enabled by the WISH system. From a macro-study perspective, we divide the evolutionary process into three stages in order to explore the forces that facilitate the evolution of cut-flower supply chains and the types of strategies, behaviours, and relationships that exist within the supply chain.
We find that, similar to other industries, the power has gradually shifted from suppliers to retailers. There is now a greater tendency for the new supply chain strategies to move towards deeper and wider collaboration in an effort to focus more on demand management, with the relationships between the members having changed from the traditional arm’s length transactions to long-term partnerships. The behaviour of members is now characterized by mutual trust, commitment and interdependence. Furthermore, the attraction of new suppliers and retailers to the WISH system had generated positive network effects.
We confirm the evolutionary process through our empirical analyses, from a micro-study perspective, using time series data collected from the WISH system. The results reveal that all auction houses are heavily dependent upon reliable sources of supply and that they play a mediating role in the formulation of auction lines which were established on the basis of retailer demand in the earlier stages. However, there is
IMDS
110,3
room for improvement in the operational performance of both TPAH and CHAH. The evidence also shows that the operational performance of the auction houses was improved considerably in the later stage, with horizontal collaboration being supported by WISH.
With the continuing evolution of market share, the establishment of a new auction house ultimately had a negative effect on growth in market share of the existing auction houses; this simply reflects the redistribution of existing market share, with our results revealing that the growth rate in the market share of KHAH subsequently had a negative impact on those of TPAH, CHAH, TNAH, and TCAH. There has, however, been a tendency for all auction houses to shift towards greater coordination, applying demand management and transshipment systems across supply chains, and thereby maintaining their own market position without any blurring of their mutual positions.
Considering the problem of the generalization in this research, despite, we adopted an example of Taiwan’s cut-flower industry and collectively gathered overall data to investigate the supply chain evolution and collaboration through IT; the fact that this research approach is limited by a case study, whilst the results drawn from this study are confident in evidence.
7. Managerial implications
This study confirms the supply chain evolution and collaboration through IT in the three evolutionary stages, summarizing some of the important implications as follows. First, managers need to establish effective inter-firm partnerships based upon horizontal coordination, going beyond the traditional relationship characterized by vertical coordination. Horizontal collaboration has become the new trend in SCM nowadays, with several cases having been reported between some studies (Chan et al., 2004; Mason et al., 2007; Mesquita and Lazzarini, 2008); such horizontal collaboration can be overcome by relational governance, enhancing mutual ability to align goals and to craft common strategies (Mesquita and Lazzarini, 2008).
Horizontal coordination has also been successfully achieved in Taiwan’s cut-flower industry, with its establishment having clearly been facilitated by the WISH system, a system which has provided the support needed for the effective integration of traders and supply chains. The effective inter-firm relationships are established on the basis of certain incentives. It is important that within this horizontal coordination, participants can maintain their own market position without any unnecessary blurring of their positions.
Next, the adoption of appropriate IT can assist in the achievement and advancement of supply chain collaboration, since IT plays an enabling role in the sharing of information and knowledge. Focusing on the evolution of IT, compatible technologies have advanced from electronic data interchange (EDI) to web-based and radio frequency identification (RFID)-enabled mechanisms with corresponding collaboration having also evolved from VMI to CPFR and RFID-enabled (Pramatari, 2007). EDI is a common transaction format which allows enterprises to electronically transmit data (Simchi-Levi et al., 2008). RFID is an important technology development for the sophisticated replacement for bar codes. Although, RFID is still in the early stages of adoptions, it has been widely supported by some large companies such as HP and Wal-Mart (Simchi-Levi et al., 2008).
Evolutionary
process and
collaboration
471
With the adoption of the e-auction system, the benefits accrued by participants between 1989 and 2003 include rapid growth in sales and improvements in operational performance. Such an e-auction mechanism is particularly useful in cases of uncertain sources of supply (involving, for example, agri-products) or uncertain customer demand (such as the demand of cut-flowers). Furthermore, it is quite clear that the e-auction system can be successful, provided that the participators focus less on price competition, and more on improving their operational and transactional activities, thereby reducing both time and costs (Hartley et al., 2004).
The WISH system has enabled traders to achieve mutual reinforcement through information sharing, taking advantage of positive network effects to attract new suppliers and retailers, and virtually eliminating flower wastage. However, a related negative network effect has been the reduction in available capacity due to market congestion. To avoid users migrating back to conventional information sources, the WISH system managers should aim to improve technology and increase the capacity of the system to relieve such congestion.
An essential task in modern-day SCM is the selection of the appropriate IT tools that will effectively facilitate collaboration. RFID is now the most widely prevailing technology, and there is still much untapped potential for use in supply chain collaboration. Whilst the WISH web-based platform provides such support for information exchange and collaboration in Taiwan’s cut-flower supply chains, RFID technology can also be used to further promote collaboration in unique product identification and in tracing back sources of supply and trading processes.
This study focuses primarily on the evolutionary process of supply chains and vertical and horizontal collaboration through IT in distinct evolutionary stages. There is, as yet, relatively little evidence on horizontal coordination cross supply chains, despite the fact that it is very clear that this is an important trend in SCM. This is an issue which is of considerable interest and importance, clearly in need of further study by the research community. Future studies should try to place greater emphasis on the types of mechanisms which might better facilitate the successful adoption of supply chain collaboration, as well as the types of IT that can provide effective support for collaboration in both vertical and horizontal dimensions. Indeed, network characteristics in terms of most aspects of long-term relationships and coordinative strategies likely have a conspicuous effect on the evolution of supply chains; it deserves enhanced attention in future research.
References
Barratt, M. and Oke, A. (2007), “Antecedents of supply chain visibility in retail supply chains: a resource-based theory perspective”, Journal of Operations Management, Vol. 25 No. 6, pp. 1217-33.
Chae, B., Yen, H.R. and Sheu, C. (2005), “Information technology and supply chain collaboration: moderating effects of existing relationships between partners”, IEEE Transactions on Engineering Management, Vol. 52 No. 4, pp. 440-8.
Chan, F.T.S., Chung, S.H. and Wadhwa, S. (2004), “A heuristic methodology for order distribution in a demand driven collaborative supply chain”, International Journal of Production Research, Vol. 42 No. 1, pp. 1-19.
Chen, M.-C., Yang, T. and Li, H.-C. (2007), “Evaluating the supply chain performance of IT-based inter-enterprise collaboration”, Information and Management, Vol. 44 No. 6, pp. 524-34.
IMDS
110,3
Clark, B.H. and Chatterjee, S. (1999), “The evolution of dominant market shares: the role of network effects”, Journal of Marketing Theory and Practice, Vol. 7 No. 2, pp. 83-96. Claro, D.P., de Oliveira Claro, P.B. and Hagelaar, G. (2006), “Coordinating collaborative joint
efforts with suppliers: the effects of trust, transaction specific investment and information network in the Dutch flower industry”, Supply Chain Management: An International Journal, Vol. 11 No. 3, pp. 216-24.
Dickey, D.A. and Fuller, W.A. (1981), “Likelihood ratio statistics for autoregressive time series with a unit root”, Econometrica, Vol. 49 No. 4, pp. 1057-72.
Gowrisankaran, G. and Stavins, J. (2004), “Network externalities and technology adoption: lessons from electronic payments”, RAND Journal of Economics, Vol. 35 No. 2, pp. 260-76. Granger, C.W.J. and Newbold, P. (1974), “Spurious regressions in econometrics”, Journal of
Econometrics, Vol. 2 No. 2, pp. 111-20.
Hadaya, P. and Cassivi, L. (2007), “The role of joint collaboration planning actions in a demand-driven supply chain”, Industrial Management & Data Systems, Vol. 107 No. 7, pp. 954-78.
Hartley, J.L., Lane, M.D. and Hong, Y. (2004), “An exploration of the adoption of e-auctions in supply management”, IEEE Transactions on Engineering Management, Vol. 51 No. 2, pp. 153-61.
Huang, B. and Iravani, S.M.R. (2005), “Production control policies in supply chains with selective-information sharing”, Operations Research, Vol. 53 No. 4, pp. 662-74.
Humphreys, P.K., Shiu, W.K. and Chan, F.T.S. (2001), “Collaborative buyer-supplier relationships in Hong Kong manufacturing firms”, Supply Chain Management: An International Journal, Vol. 6 No. 4, pp. 152-62.
Klein, R. (2007), “Customization and real time information access in integrated eBusiness supply chain relationships”, Journal of Operations Management, Vol. 25 No. 6, pp. 1366-81. Lamming, R. (1993), Beyond Partnership: Strategies for Innovation and Lean Supply,
Prentice-Hall, Hemel Hempstead.
Lee, S. and Kumara, S. (2007), “Decentralized supply chain coordination through auction markets: dynamic lot-sizing in distribution networks”, International Journal of Production Research, Vol. 45 No. 20, pp. 4715-33.
Mason, R., Lalwani, C. and Boughton, R. (2007), “Combining vertical and horizontal collaboration for transport optimization”, Supply Chain Management: An International Journal, Vol. 12 No. 3, pp. 187-99.
Matopoulos, A., Vlachopoulou, M., Manthou, V. and Manos, B. (2007), “A conceptual framework for supply chain collaboration: empirical evidence from the agri-food industry”, Supply Chain Management: An International Journal, Vol. 12 No. 3, pp. 177-86.
Mentzer, J.T., Foggin, J.H. and Golicic, S.L. (2000), “Collaboration: the enablers, impediments, and benefits”, Supply Chain Management Review, Vol. 4 No. 4, pp. 52-8.
Mesquita, L.F. and Lazzarini, S.G. (2008), “Horizontal and vertical relationships in developing economies: implications for SMEs’ access to global markets”, Academy of Management Journal, Vol. 51 No. 2, pp. 359-80.
Mintzberg, H. and McHugh, A. (1985), “Strategy formation in an adhocracy”, Administrative Science Quarterly, Vol. 30 No. 2, pp. 160-97.
Parente, D.H., Venkataraman, R., Fizel, T. and Millet, I. (2004), “A conceptual research framework for analyzing online auctions in a B2B environment”, Supply Chain Management: An International Journal, Vol. 9 No. 4, pp. 287-94.
Evolutionary
process and
collaboration
473
Patnayakuni, R., Rai, A. and Seth, N. (2006), “Relational antecedents of information flow integration for supply chain coordination”, Journal of Management Information Systems, Vol. 23 No. 1, pp. 13-49.
Paulraj, A., Lado, A.A. and Chen, I. (2008), “Inter-organizational communication as a relational competency: antecedents and performance outcomes in collaborative buyer-supplier relationship”, Journal of Operations Management, Vol. 26 No. 1, pp. 45-64.
Pramatari, K. (2007), “Collaborative supply chain practices and evolving technological approaches”, Supply Chain Management: An International Journal, Vol. 12 No. 3, pp. 210-20.
Simatupang, T.M. and Sridharan, R. (2004), “Benchmarking supply chain collaboration: an empirical study”, Benchmarking: An International Journal, Vol. 11 No. 5, pp. 484-503. Simchi-Levi, D., Kaminsky, P. and Simchi-Levi, E. (2008), Designing and Managing the Supply
Chain: Concepts, Strategies and Case Studies, 3rd ed., McGraw-Hill, New York, NY. Spekman, R.E., Kamauff, J.W. Jr and Myhr, N. (1998), “An empirical investigation into supply
chain management: a perspective on partnerships”, Supply Chain Management, Vol. 3 No. 2, pp. 53-67.
Swaminathan, J.M. and Tayur, S.R. (2003), “Models for supply chain in e-business”, Management Science, Vol. 49 No. 10, pp. 1387-406.
Vargo, S.L. and Lusch, R.F. (2004), “Evolving to a new dominant logic of marketing”, Journal of Marketing, Vol. 68 No. 1, pp. 1-17.
VICS (2004), Collaborative Planning, Forecasting, and Replenishment, An Overview, Voluntary Interindustry Commerce Standards, Lawrenceville, NJ.
Zelbst, P.J., Green, K.W. Jr, Sower, V.E. and Reyes, P. (2009), “Impact of supply chain linkages on supply chain performance”, Industrial Management & Data Systems, Vol. 109 No. 5, pp. 665-82.
Zhao, K., Xia, M. and Shaw, M.J. (2007), “An integrated model of consortium-based e-business standardization: collaborative development and adoption with network externalities”, Journal of Management Information Systems, Vol. 23 No. 4, pp. 247-71.
Further reading
Cochrane, D. and Orcutt, G.H. (1949), “Application of least squares regression to relationships containing autocorrelated error terms”, Journal of the American Statistical Association, Vol. 44, pp. 32-61.
Engle, R.F. and Granger, C.W.J. (1987), “Cointegration and error correction: representation, estimation and testing”, Econometrica, Vol. 55, pp. 251-76.
Sanders, N.R. (2007), “An empirical study of the impact of e-business technologies on organizational collaboration and performance”, Journal of Operations Management, Vol. 25 No. 6, pp. 1332-47.
Corresponding author
Mu-Chen Chen can be contacted at: [email protected]
To purchase reprints of this article please e-mail: [email protected] Or visit our web site for further details: www.emeraldinsight.com/reprints