Effects of Burn-off and Activation Temperature on Preparation of Activated
Carbon from Corn Cob Agrowaste by CO
2and Steam
Chiung-Fen Chang,∗ Ching-Yuan Chang,∗,1and Wen-Tien Tsai†
∗Graduate Institute of Environmental Engineering, National Taiwan University, Taipei 106, Taiwan; and †Department of Environmental Engineering and Health, Chia Nan College of Pharmacy and Science, Tainan 717, Taiwan
Received February 24, 2000; accepted August 21, 2000
Previous studies have successfully demonstrated that corn cob is a suitable precursor for production of good activated carbon by chemical activation. However, respond to the need for cleaner pro-duction, this study focuses on the physical activation by gasifying agents such as CO2 and steam. The activation temperatures
un-der investigation are 1073 and 1173 K. Within the limit of 50 wt% burn-off, experimental results reveal that the BET surface area, pore volume, and average pore diameter of the resulting activated car-bon generally increase with the extent of burn-off in both gasifying agents and at both temperatures. The higher activation tempera-ture can overcome the drawbacks of a longer period of activation required to attain larger surface area and can offer higher potential to produce activated carbon of greater adsorption capacity from agriculture wastes such as corn cobs. Additionally, the BET surface areas of properly prepared activated carbons can satisfy commercial requirements, when compared with commercial activated carbon. The BET surface areas of the activated carbons after about 71 and 59 wt% burn-off of CO2and steam activations at 1173 K are 1705
and 1315 m2/g, respectively, indicating high adsorption capacities.
Thus, it is feasible to produce high-quality microporous activated carbon from corn cob agrowaste using N2 carbonization followed
by physical activation with CO2or steam. °C2000 Academic Press Key Words: burn-off; activation; activated carbon; corn cob; car-bon dioxide activation; steam activation.
INTRODUCTION
Activated carbons are widely used as highly porous industrial adsorbents for separation, purification, and recovery processes. Over the past few years, numerous studies have been made on the precursor materials and preparation methods of activated carbon from biomass. Any inexpensive material with high car-bon content, but low inorganics, can be used as raw material for the production of activated carbon (1). As is generally rec-ognized, there are two different processes for the preparation of activated carbon, namely, physical activation and chemical activation. Chemical activation is performed in only one step for carbonization and activation at low temperatures (e.g., 673– 1073 K) (1). Physical activation involves the carbonization of 1To whom correspondence should be addressed. Fax: 886-2-2363-8994.
E-mail: [email protected].
a carbonaceous precursor followed by the gasification of the resulting char in the presence of suitable oxidizing gasifying agents such as CO2and steam at high temperatures (e.g., 1073– 1373 K) (1). In chemical activation, the precursor materials are impregnated with chemical agents such as ZnCl2and H3PO4to inhibit the formation of chars, reduce the evolution of volatile matter, and enhance the yield of the resulting activated carbon. In our previous works (2, 3), the agricultural byproduct corn cob was used as the precursor material through chemical preparation with ZnCl2. The BET surface areas of the resulting activated car-bons were greater than 1400 m2/g. It is obvious that the agricul-tural byproduct corn cob was a suitable carbonaceous precursor for the production of activated carbon. However, chemically ac-tivated carbon has considerable inorganic content, which may cause environmental contamination. In order to heed the appeal for cleaner production, physical activation is more favorable than chemical activation.
The purpose of this study is to investigate the feasibility of using physical activation to manufacture activated carbon from the agricultural byproduct corn cob. Process parameters, such as gasifying agents, activation temperatures, and burn-off, on system performance and the characteristics of resulting activated carbon are examined in this paper.
EXPERIMENTS AND METHODS
Precursor Material
Corn cob was ground and sieved to the size of 12–16 mesh (i.e., 1.19–1.68 mm) and dried at 378 K overnight before car-bonization. A typical analysis of corn cob was as follows: mois-ture, 4.3 wt%; volatiles, 78.7 wt%; fixed carbon, 16.1 wt%; ash, 0.9 wt%. A typical elemental analysis of corn cob was as follows: C, 45.21 wt%; H, 6.12 wt%; N, 0.94 wt%; O, 47.73 wt%. The results reveal that corn cob has high carbon, but low ash, content, which makes it a good precursor material for adsorbents.
Experimental Apparatus and Methods
The apparatus and experimental methods used for physical activation were similar to those for chemical activation, as re-ported previously (2, 3).
45 0021-9797/00 $35.00
Copyright°C2000 by Academic Press All rights of reproduction in any form reserved.
Carbonization. About 10 g of corn cob was put into a stain-less steel crucible (i.d. 45 mm) and heated at 10 K/min from 303 K to a specific temperature (1073 or 1173 K) under a con-stant N2stream of 200 cm3/min (measured at room temperature).
Activation. The char obtained from carbonization was
fol-lowed by activation at the final carbonization temperature for the specified time. For the activation agent, CO2(purity of 99.99%), the flow rate was maintained at 200 cm3/min (measured at room temperature). In the steam runs, water flow rates of 0.6 and 0.05 g/min at activation temperatures of 1073 and 1173 K, re-spectively, were maintained by a syringe pump (Model 355, Sage Instruments). The water was injected into a quartz reactor wrapped with a heating belt (catalog no. HT353, Electrothermal Engineering Ltd.) to produce water vapor by evaporation, using N2at a flow rate of 100 cm3/min (measured at room temperature) as a carrier gas. The subsequent experiments were conducted to different burn-off levels, which are defined as the difference be-tween the masses before and after activation and are a function of activation time (i.e., soaking time). All flow rates were me-tered precisely to the experimental reactor system using mass flow rate controllers (Model HFC202, Hastings Instruments).
For characterization measurements, the resulting char and ac-tivated carbon were mixed with 100 cm3of 3 N HCl and stirred at 250 rpm for 1 h. After filtration, the sample was washed with deionized water and then dried in a vacuum oven at 378 K.
Characterization measurements. Specific surface areas and
pore volumes of the resulting chars and activated carbons were determined by N2 gas adsorption at 77 K with an automated adsorption instrument (ASAP 2000, Micromeritics). Prior to the determination of isotherm analysis, the sample (about 0.2 g) was degassed for 24 h at 573 K in a vacuum of about 10−5mmHg to remove moisture and other volatiles from the sample.
The specific surface areas ( AB) of the resulting chars and activated carbons were obtained by the standard BET method applied in a relative pressure range from 0.06 to 0.2. The total pore volume (Vt) was obtained by converting the amount of N2 gas adsorbed (expressed in cm3/g STP) at a relative pressure of 0.99 to the volume of liquid adsorbate. The average pore diameter (≈4Vt/AL) can be estimated according to the Langmuir surface area ( AL) and the total pore volume, by assuming that the pores are straight, cylindrical, and not interconnected and that they have the same diameter and depth (4). The micropore surface area ( Ai) and volume (Vi) were determined by the t -plot method (5).
RESULTS AND DISCUSSION
Carbonization and Activation
From our previous study (6), the pyrolysis of corn cob at a heating rate of 10 K/min under a N2stream can be divided into three regions: 373–523, 523–673, and 673–1273 K. The peaks of evolution rates of volatiles were sharp before 673 K. The curve of mass losing rate was gradually smooth after 673 K. The results
showed that when the temperature of carbonization was higher than 673 K, the resulting chars became richer in carbon and had built the fundamental porous structure. The porosity of resulting char was not obtainable because disorganized materials resulting from the deposition and decomposition of tar filled or blocked the pores of the resulting char (7). As is widely known, activa-tion with steam and CO2as gasifying agents involves the C–H2O and C–CO2reactions, respectively, resulting in the removal of carbon atoms and causing the main weight loss of the resulting char (7). This is the chief mechanism of development of micro-pore volume and diameter in the resulting char. The extent of activation of the resulting char depends on the extent of burn-off, as shown in Table 1. The correlation coefficients (r2) of plots of burn-off vs soaking time in all cases are greater than 0.98, when applying least-squares regression analysis. This indicates that the slopes representing the gasification burn-off rates for the four cases studied are almost constant throughout the entire experimental range. For the CO2activation, the rate of activation at 1173 K is about four times faster than that at 1073 K. In ad-dition, it also indicates a similar tendency (about 2.5 times) for the steam activation, although the amount of water at 1173 K is 1/12th that at 1073 K. As a result, activation temperature is more important in controlling activation extent than the concentration of gasifying agents in this study. Regarding the comparison of activation rates between the two gasifying agents, activation rate in steam is faster than that in CO2(7), which is consistent with the findings of Walker (8) when dealing with other precursor materials.
Surface and Pore
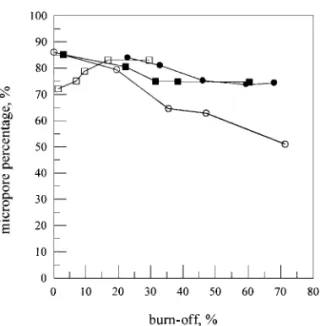
The characteristics of the resulting activated carbons deter-mined by N2gas adsorption at 77 K are illustrated in Table 1. The percentage of microporous volume in total pore volume of the activated carbons is presented in Fig. 1. The surface areas of the chars (i.e., 0% burn-off) at 1073 and 1173 K are 91 and 549 m2/g, respectively, indicating that the higher temperature char has a more developed pore structure. Also, high tempera-ture can obviously reduce the activation time of the same burn-off. Thus, higher temperature can overcome the drawbacks of a longer period of activation time required to attain a larger sur-face area and offer higher potential to produce activated carbon of greater adsorption capacity from agriculture waste corn cob. Additionally, the BET surface areas of resulting activated car-bons which are properly prepared are close to or larger than the 1000 m2/g of the commercial activated carbon Calgon F-400. This implies that gasification by CO2 and steam not only re-moves the disorganized materials but also efficiently develops microporosity and widens the micropore with increasing burn-off.
The BET surface area ( AB), total pore volume (Vt), and per-centage of micropores are all raised with burn-off in the case of CO2activation at 1073 K, due to the opening of blocked pores and the development and widening of microporosity. Neverthe-less, different results are observed in three other cases. As is
TABLE 1
Characteristics of Resulting Activated Carbons by Nitrogen Gas Adsorption at 77 K
Surface area (m2/g) Pore volume (cm3/g)
Soaking Micropore Average pore
Time Burn-off Langmuir BET area ( Ai) Total Micro Mesoa Macroa diameter
(min) (wt%) ( AL) ( AB) (m2/g) (Vt) (Vi) (Ve) (Va) (A a )b CO2activation at 1073 K (h) 0 0 NAc 91 21 0.022 NAc 0.012 0.010 9.6d 20 1.34 543 405 302 0.194 0.140 0.033 0.021 14.3 40 6.94 634 473 392 0.245 0.184 0.043 0.018 14.4 60 9.41 814 608 497 0.297 0.234 0.051 0.012 14.6 90 16.64 883 658 572 0.324 0.269 0.053 0.002 14.7 120 29.39 924 670 578 0.342 0.284 0.056 0.002 14.8 Steam activation at 1073 K (j) 20 2.90 762 568 495 0.275 0.234 0.031 0.010 14.4 40 22.10 1106 823 701 0.411 0.331 0.066 0.014 14.6 60 31.34 1213 897 725 0.452 0.339 0.099 0.014 14.9 90 38.20 1279 930 763 0.483 0.362 0.108 0.013 15.1 120 60.20 1341 998 819 0.511 0.382 0.117 0.012 15.2 CO2activation at 1173 K (s) 0 0 698 549 466 0.251 0.216 0.030 0.005 14.4 20 19.35 758 569 471 0.277 0.220 0.033 0.002 14.6 40 35.38 1297 863 555 0.441 0.285 0.185 0.004 14.6 60 46.96 1441 1014 697 0.545 0.343 0.197 0.005 15.1 80 71.26 2295 1705 1000 0.884 0.452 0.404 0.028 15.4 Steam activation at 1173 K (d) 20 22.76 918 685 600 0.337 0.283 0.038 0.016 14.7 30 32.77 1356 1006 861 0.501 0.406 0.082 0.013 14.8 40 45.97 1617 1201 965 0.600 0.452 0.129 0.019 14.8 50 59.28 1774 1315 1035 0.657 0.485 0.148 0.024 14.8 60 67.88 1443 1063 847 0.536 0.399 0.0119 0.018 14.9 Calgon F-400 — — 1391 1026 627 0.614 0.289 0.288 0.037 17.65 aCalculated by using V
t− Vi= Ve+ Va, with the Barrett–Joyner–Hanlenda (BJH) adsorption pore distribution, which gives the proportions of mesopore to
macropore volumes. bCalculated by using 4V
t/AL.
cNA, not available. dCalculated by using 4V
t/AB.
FIG. 1. Relation between percentage of microporous volume in total pore volume and burn-off (see Table 1 for symbols).
widely known, the microporosity of the resulting chars can be effectively developed during the activation, and the specific sur-face area ( A) and pore volume (V ) commonly increase with soaking time and burn-off. However, in the case of steam activa-tion at 1173 K, the surface area and total pore volume at 60 min of soaking time are smaller than those at 50 min. This may be attributed to the fact that, for the burn-off at 60 min, destruction of high porosity by external ablation of carbon particles is more pronounced than development and widening of microporosity (7). As a result, the BET surface area and total pore volume are reduced at 60 min. In the case of steam activation at 1073 K and CO2activation at 1173 K, the BET surface areas increase while the percentage of micropore volume decreases with increase of burn-off, indicating not only the development of microporosity but also the great widening of microporosity due to reactions of crystallites on the opened walls with gasifying agents. The increases of pore size of the activated carbons in these two cases (Table 1) agree with the deduction of the percentage of micro-pore volume. In summary, the characteristics of the activated
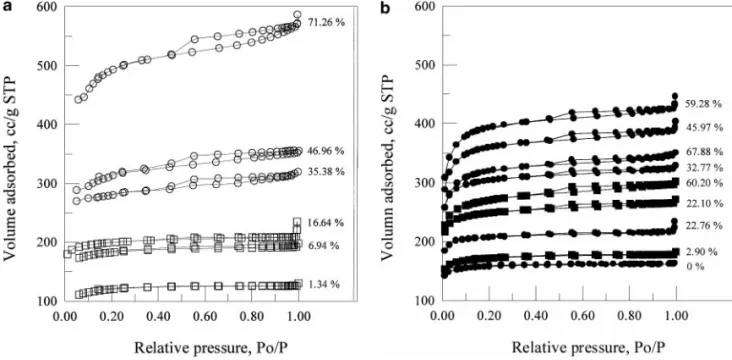
FIG. 2. Adsorption and desorption isotherms of N2at 77 K of activated carbons at various extents of burn-off (see Table 1 for symbols): (a) from CO2activation;
(b) from steam activation.
carbons, such as the BET surface area, pore volume, and aver-age pore diameter, increase with extent of burn-off, within the limit of 50 wt% burn-off.
Comparison of the results with different gasifying agents at 1173 K indicates that the activated carbons obtained with steam activation have greater microporosity (micropore vol-ume) and smaller pore diameter at the same BET surface ar-eas. In this study, using steam in N2 with a concentration of 40 vol% as the gasifying agent was more favorable in pro-ducing an activated carbon of greater microporosity than pure CO2. Similar experimental results were reported by
Rodriguez-FIG. 3. SEM of activated carbons obtained with CO2activation: (a) 29 wt% burn-off at 1073 K; (b) 47 wt% burn-off at 1173 K.
Reinoso and Molina-Sabio (7) for olive stone with pure CO2 and steam–N2 mixture (10 vol%) activations. They attributed the great development of microporosity when using steam ac-tivation to the low partial pressure of steam, which would pro-duce a more selective attack on the carbon structure, while in the case of pure CO2, the much higher concentration was less selective.
Figures 2a and 2b present the adsorption and desorption isotherms of N2 on activated carbons obtained with CO2 and steam activation, respectively. It is seen that the adsorption isotherms of N2for adsorbed volume below or near 200 cm3/g
STP belong to Type I of the BDDT (Brunnauer–Deming– Deming–Teller) classification with well-defined plateaus, sup-porting that the pores are microporous. With increasing N2 ad-sorbed volume, the adsorption isotherms change to Type II, representing that the original micropores are transformed into mesopores with increasing burn-off. In addition, the adsorption– desorption curves show hysteresis loops at high extents of burn-off. The lower curves in both figures are Type H4 in the IUPAC classification, with nearly parallel branches, being an indication of microporosity (5), while the upper curves resemble a combi-nation of Types H3 and H4. Both Types H4 and H3 stand for the existence of slit-shaped pores.
Scanning Electron Microscopy
Scanning electron micrographs of the surface structures of 29 wt% burn-off at 1073 K and 47 wt% burn-off at 1173 K from CO2 activation are illustrated in Figs. 3a and 3b, respectively, showing a great difference between these two activated carbons. The former has a smoother surface, while the latter displays a much more rough and irregular surface structure. This indicates a gross attack on the exterior surface and interior pore wall at high temperature and burn-off. As a result, it effectively creates new pores and increases the total pore volume and surface areas (i.e., greater adsorption capacity) as illustrated in Table 1.
CONCLUSIONS
The BET surface areas of the activated carbons obtained in this study can satisfy the commercial requirement, compared with Calgon F-400. The largest BET surface area obtained from the resulting activated carbons by CO2 activation at 1173 K with about 71 wt% burn-off is 1705 m2/g. In addition, the higher
activation temperature has a higher potential to produce an acti-vated carbon of greater adsorption capacity. The levels of devel-opment and widening of microporosity depend on the activation temperature, activation time, and gasifying agents. Comparison of all resulting activated carbons indicates that steam activation at 1173 K with low water flow rate can produce microporous ac-tivated carbons, while CO2activation at 1173 K is able to man-ufacture mesoporous activated carbons. From the foregoing, it is obvious that agricultural byproduct corn cob is a suitable car-bonaceous precursor for the production of activated carbon by physical activation using CO2or steam, plus, of course, chemical activation.
ACKNOWLEDGMENTS
The authors thank the National Science Council, Taiwan (Contract NSC 88-2211-E-041-006), for support, and are grateful for the assistance of the Powder Technology Laboratory, Chemical Engineering Department, National Taiwan University.
REFERENCES
1. Bansal, R. C., Donnet, J. B., and Stoeckli, F., “Active Carbon,” Dekker, New York, 1988.
2. Tsai, W. T., Chang, C. Y., and Lee, S. L., Bioresource Technol. 64, 211 (1998).
3. Tsai, W. T., Chang, C. Y., and Lee, S. L., Carbon 35, 1198 (1997). 4. Smith, J. M., “Chemical Engineering Kinetics,” 3rd ed. McGraw–Hill, New
York, 1981.
5. Gregg, S. J., and Sing, K. S. W., “Adsorption, Surface Area and Porosity,” 2nd ed. Academic Press, New York, 1982.
6. Chang, C. F., Chang, C. Y., Lee, S. L., Wang, S. Y., Chiang, P. C., Tseng, S. K., and Tsai, W. T., J. Chin. Inst. Environ. Eng. 8, 227 (1998).
7. Rodriguez-Reinoso, F., and Molina-Sabio, M., Carbon 30, 1111 (1992). 8. Walker, P. L., Carbon 34, 1297 (1996).