Nonlinear refraction and absorption measurements
with chirped femtosecond
laser pulses: experiments and simulations
J.-K. WangCenter for Condensed Matter Sciences, National Taiwan University, Taipei, Taiwan T.-L. Chiu, C.-H. Chi, and C.-K. Sun
Graduate Institute of Electro-Optical Engineering, National Taiwan University, Taipei, Taiwan Received July 27, 1998; revised manuscript received November 5, 1998
We report an extension of the spectrally resolved two-beam coupling technique to measure the nonlinear in-tensity index of refraction (n2I) and the two-photon absorption coefficient (b) by use of chirped laser pulses. The linear chirp parameter b is incorporated into the derivation of a more general model than the previous one [Opt. Lett. 22, 1077 (1997)]. We have also analyzed the validity of this linear chirp model through a compari-son of the experimental results for fused silica with the numerically accurate calculation that considers higher-order chirps obtained by second-harmonic generation frequency-resolved optical gating. The results show that this method potentially can be used to extract the chirp. Finally, we applied this transient spectrally resolved nonlinear transmittance spectroscopy to semiconductor-doped glasses to extract their n2I andb.
© 1999 Optical Society of America [S0740-3224(99)00804-8] OCIS codes: 190.7110, 320.7100, 320.7110, 320.1590.
1. INTRODUCTION
In media with inversion symmetry (such as gases, liquids, and noncrystalline materials), third-order optical nonlin-earity is the lowest-order nonlinnonlin-earity allowed under the electric-dipole approximation. Third-harmonic genera-tion, phase conjugagenera-tion, saturagenera-tion, self-focusing, the op-tical Kerr effect, and two-photon absorption can all be at-tributed to this optical nonlinearity. There has been a great deal of research directed to investigating these phe-nomena in various materials and in pursuing their application.1 The nonlinear intensity index of refraction n2I and the two-photon absorption coefficientb are
nor-mally used to quantitatively characterize these kinds of self-action nonlinear optical behavior. The dependence of n2Iand b on the third-order nonlinear optical
suscep-tibilityx(3)are given by n
2I5 (3/4e0cn02)Re@x1111(3)# and
b 5 (3k0/2e0cn02)Im@x1111(3)#, respectively.1 Many
ex-perimental techniques have been developed to measure the magnitude and the dynamics of third-order optical nonlinearities. The three most commonly used methods are four-wave mixing, optical-heterodyne-detected optical Kerr gating, and beam distortion measurements (Z scan).1 The first two methods directly measure the third-order nonlinear susceptibility and usually involve a com-plicated experimental setup. The third method utilizes the self-focusing effect on the beam’s propagation prop-erty to measure the nonlinear refractive index. The most commonly used method to extractb, on the other hand, is, the nonlinear transmittance method, which measures the transmittance of the laser beam through the medium as a function of the laser’s intensity.
Among these three methods for measuring x(3), the
Z-scan technique is the simplest and deserves the most discussion.2 It measures the transmission change in a single focused laser beam through an aperture as a func-tion of the relative posifunc-tions of the beam’s focal posifunc-tion and the sample. Because of the intensity-induced change in the refractive index, a peak-and-valley feature shows up in the transmission measurement. A well-defined beam profile is a necessity for extraction of the real and the imaginary parts of x(3). This method has been
ap-plied successfully to many materials. However, the Z-scan technique has two major limitations. First, it is relatively insensitive. It thus requires a high laser power density, leading to the possibility of other side ef-fects such as laser-induced damage and other higher-order optical nonlinearities. It is thus more often applied to thick samples to accumulate a larger effect for obser-vation. Second, because the beam spot on the sample during the measurement varies, nonuniform samples may cause serious scattering, which will affect this trans-mission measurement.
Recently Kang et al. demonstrated a new method for measuring both n2I and b.3 It relies on two-beam
cou-pling between the pump and the probe pulses. The phase change (cross-phase modulation) and the energy loss (two-photon absorption) of the probe beam caused by the pump beam vary the transmission of the probe beam at a wavelength away from its central wavelength. An analytical model of the normalized transmittance varia-tion based on transform-limited pulses was derived and used to fit the experimental results on fused silica and CdS samples. Nonlinear phase shifts as small as ;1026rad and two-photon absorption coefficients as
small as 1024cm/GW have been demonstrated. It is a highly sensitive technique for measuring the two nonlin-ear optical constants.
To extend the use of this sensitive technique, we present here our theoretical and experimental studies of this method with chirped femtosecond laser pulses. In Section 2 we describe the derivation of the analytical linear-chirp model with linearly chirped Gaussian laser pulses. In Section 3 we arrive at a fundamental under-standing of the chirp-free and linear-chirp models through the simulation results. The experimental setup for the two-beam coupling method and the frequency-resolved optical gating (FROG) apparatus are given in Section 4. Our experimental results and their compari-son with the theoretical simulations are presented and discussed in Section 5. Section 6 concludes the paper.
2. THEORY
For an intense pump pulse copropagating with a weak probe pulse in a nonlinear medium with only third-order optical nonlinearityx(3), the equations that describe the nonlinear interactions (nonlinear refraction and two-photon absorption) between the strong pump and the weak probe beams are
]Ipu ]z 1 1 vg ]Ipu ]t 5 2~a 1 bIpu!Ipu, (1) ]fpu ]z 1 1 vg ]fpu ]t 5 2kn2IIpu, (2) ]Ipr ]z 1 1 vg ]Ipr ]t 5 2~a 12bIpu!Ipr, (3) ]fpr ]z 1 1 vg ]fpr ]t 5 22kn2IIpu. (4)
Ipr(Ipu) is the intensity of the temporal envelope of the
probe (pump) beam, fpr (fpu) is the phase of the probe
(pump) beam,a is the linear absorption coefficient, vg is
the group velocity, k 5 2p/l, where l is the wavelength in vacuum, and n2Iis the nonlinear intensity index of
re-fraction. The slowly varying envelope approximation is assumed and group-velocity dispersion (GVD) is ne-glected in the derivation of Eqs. (1)–(4). The former ap-proximation is valid when the spectral width of the pulse is much smaller than its central frequency, as it normally is for typical femtosecond laser pulses. Ignoring GVD can be justified only when the dispersion length (LD
5 t2/k9) is greater than the nonlinear length (L NL
5 j0/n2IIpu), where k95 d2k/dv2,j05fpc/n0v0, and
fp is the peak phase shift induced in the measurement
(;1023rad). For a 100-fs laser pulse (t 5 85 fs) at 800 nm propagating in fused silica (k95 0.0362 ps2/m at 800
nm), the dispersion length is;20 cm. Inasmuch as n2I
5 2.2 3 10220m2/W for fused silica, the nonlinear length
is ;4 mm for Ipu5 1012W/m2, which is the typical peak
power density achieved by focusing of femtosecond mode-locked laser pulses. Because the sample thickness L se-lected for experiments is ;3 mm, both L and LNL are
much shorter than LD, and the GVD of the sample can be
neglected in the analysis.
Assuming a transform-limited laser pulse, E(t) ; exp(2t2/t2), Kang et al. derived the nonlinear
trans-mittance of the probe beam as a function of the time delay Dt between the pump and the probe pulses and the detec-tion detuningd5v 2 v0between the central frequency
of the laserv0 and the detecting frequency3:
DT T ~Dt,d! 5 2
A
3exp~d 2t2/6!exp@22~Dt!2/3t2# 3 @2DF sin~2dDt/3! 2 q cos~2dDt/3!#, (5) where DF 5 kn2IIpu0L, q 5bIpu0L, Ipu0is the peakin-tensity of the pump pulse, and L is the interaction length. In the derivation, both DF and q are assumed to be less than ;0.1 and linear absorption in the medium is ne-glected. Furthermore, the pump pulse is assumed to be invariant while it is propagating in the medium. Equa-tion (5) can be considered a Gaussian envelope modulated at a radial frequency of 2d/3. The effect of the two-photon absorption is simply a phase shift of this modula-tion.
The chirp in femtosecond laser pulses is in normally produced laser pulses at the direct output of the model-locked laser owing to uncompensated GVD in the laser cavity,4although chirp-free laser pulses can be achieved with extracavity dispersion compensation with a prism sequence. In performing the spectrally resolved two-beam coupling measurement, one therefore cannot apply the simple model of Kang et al.3to the cases with chirped laser pulses. Here, for the first time to our knowledge, we derive analytically a more general nonlinear transmit-tance model with the inclusion of linear chirp. When a linearly chirped pulse is assumed,
E~t! 5 E0exp~2t2/t21 ibt21 iv
0t!, (6)
where b is the linear chirp parameter. Because a specific spectral component of the probe pulse after it interacts with the pump pulse is selected for detection, the follow-ing derivation is given in the frequency domain. Accord-ing to the nonlinear wave propagation equations for the probe beam [Eqs. (3) and (4)], the probe electric field after it interacts with the pump pulse in the medium is given by Epr~z 5 L, v! 5 FT@Epr~z 5 L, t 2 Dt!# 5 FT
$
Epr~z 5 0, t 2 Dt! 3 expF
2i2v0 c n0n2 ILI pu~t! 2bLIpu~t!G
' FTH
Epr~z 5 0, t 2 Dt!F
1 2 i2DF 3 expS
22t 2 t2D
2 q expS
22 t2 t2DGJ
5 FT@Epr~z 5 0, t 2 Dt!# 1 FT@DEpr~z 5 L, t 2 Dt!#, (7)whereDF and q are defined as above, Dt is again the time delay between the pump and the probe pulses, and FT
represents the Fourier transformation from the time do-main to the frequency dodo-main. Here we also assume that both nonlinearity parameters are small such that the expansion in Eq. (7) extends only to the first-order term. The nonlinear transmittance change of the probe pulse can be written as DT T ~v! 5 uEpr~z 5 L, v!u22 uEpr~z 5 0, v!u2 uEpr~z 5 0, v!u2 5 uEpr~z 5 0, v! 1 DEpru 22 uE pr~z 5 0, v!u2 uEpr~z 5 0, v!u2 ' 2 Re DEpr Epr~z 5 0, v! 5 2 ReFT@DEpr~z 5 L, t 2 Dt!# FT@Epr~z 5 0, t!# , (8)
where DEpr! Epr(z5 0,v) is assumed. After some
derivation, Epr~z 5 0, v! 5 Epr0
S
pt2 12 ibt2D
1/2 expF
2 d 2t2 4~1 2 ibt2!G
. (9) In addition,DEprcan be given byFT@DEpr~z 5 L, t 2 Dt!# 5 Epr0~i2DF 1 q!
S
pt2 3 2 ibt2D
1/2 3 expF
~4Dt 1 idt 2!2 4t2~3 2 ibt2!2 2 ~Dt!2 t2G
. (10)Finally, after some algebra, the normalized transmittance change of the probe pulse can be written as
DT T ~Dt,d! 5 2
F
~3 1 b2t4!21 4b2t4 ~9 1 b2t4!2G
1/4 3 exp@g~b,d,t!# 3 expH
2@~Dt! 2 Ts~b,d,t!# 2 @G~b,t!#2J
3 ~2DF sin Q 2 q cos Q!, (11a) where Ts5 2dbt4 2~3 1 b2t4!, (11b) G 5t
F
91 b 2t4 2~3 1 b2t4!G
1/2 , (11c) g5 d 2t2 2~1 1 b2t4!~3 1 b2t4!, (11d) and Q 5 4b 91 b2t4S
Dt 1 3d 4bD
2 2 d 2 4b~1 1 b2t4! 2 1 2tan 21S
2bt 2 3 1 b2t4D
. (11e)Equation (11a) is similar to Eq. (5), whereas the envelope function has a time shift TS(b,d,t) that is linearly
pro-portional tod. Its width parameterG depends only on b and t. The time-delay dependence on the sinusoidal modulation function is, however, much more complicated, and the time shift is also different. The second-order de-pendence of this time-delay dede-pendence indicates that the modulation in the observed transient must have a chirp. This complication is caused by the linear chirp parameter in the phase of the probe pulse. From the complicated equations (11), we expect that the transient nonlinear transmittance performed with non-transform-limited la-ser pulses will be different from the one with unchirped pulses. According to Eqs. (11), chirp parameter b is non-negligible when bt2; 1, corresponding to a time–
bandwidth product 1.4 times that of a transform-limited Gaussian laser pulse. This is not unusual for 100-fs la-ser pulses directly from a mode-locked Ti:sapphire oscil-lator. Finally, for b5 0, Eq. (11a) can easily be reduced to Eq. (5).
Apparently, the linear chirp model is still too simpli-fied. It is, however, not feasible to derive a complete ana-lytical solution to include the effect of higher-order chirps. To further explore the effects of the higher-order chirps in the nonlinear transmittance measurement we have thus developed a computer program to perform accurate simu-lations. The generalized electric field is represented as
E~t! 5 Epr0exp
S
2t2
t2
D
exp~iv0t!exp@if~t!#, (12)wheref(t) is the total phase, which can be obtained from the FROG measurements.5 Furthermore, the dispersion
of material was again neglected in this simulation. With these two assumptions, the program calculates the non-linear transmittance data,
DT T ~v, Dt! 5 uEpr~z 5 L, v, Dt!u22 uEpr~z 5 0, v!u2 uEpr~z 5 0, v!u2 , (13) by substituting Eq. (12) into Eq. (13). There is no ap-proximation similar to Eqs. (7) and (8) in the calculation. This accurate simulation can thus verify the error in the linear chirp model. Here we adopt a Gaussian envelope function in Eq. (12) for the purpose of comparison with the analytical result obtained with the linear chirp [Eq. (11a)]. Although Ti:sapphire lasers do not necessarily emit Gaussian pulses, the Gaussian fitting to the ex-tracted intensity data from the FROG measurement is very satisfactory, as shown in Fig. 7 below. Finally, uti-lizing the extracted nonlinear phase variation in the laser pulses from the FROG result, we can then compare the experimental data with the prediction made by this pro-gram. An analysis of these data is made in Section 4.
3. SIMULATIONS: CHIRP-FREE AND
LINEAR-CHIRP MODELS
In this section we first present the chirp-free model, the case in which no chirp is involved in the calculation, to help in a fundamental comprehension of the experimental results in the technique. The sophisticated nonlinear formula of the linear-chirp model is discussed subse-quently to illustrate the importance of linear chirp.
A. Chirp-Free Model
The analytical solution of the two-beam coupling equa-tions for chirp-free laser pulses has been derived [Eq. (5)]. The resultant formula can be understood as the product of two parts: DT T ~Dt,d! 5 f~d,t, Dt!z~d,Dt, DF, q!, (14a) with f~d,t, Dt! 5 2
A
3 expS
d 2t2 6D
expS
2 2Dt2 3t2D
, (14b) z~d,Dt, DF, q! 5 @~2DF!21 q2#1/2sinS
2dDt 3 2uD
, (14c) where tanu 5 q 2DF. (14d)The envelope function f(d,t, Dt) comprises the frequency-detuning-dependent amplitude exp(d2t2/6) and
the time-delay-dependent Gaussian function
exp(22Dt2/3t2). This Gaussian dependence is a result of
the frequency-domain third-order autocorrelation A(Dt,v)@5*2`` E(t2 Dt)uE(t)u2exp(2iv t)dt# performed in the measurement. The amplitude part, on the other hand, reflects the dependence of the frequency detuning on the signal strength in the nonlinear transmittance measurements. With the detection at a wavelength away from the central wavelength of the probe beam, the relative variation of the signal strength induced by the probe beam with respect to the original probe signal is larger. This is so because the unperturbed probe signal at a larger frequency detuning is smaller with the same amount perturbation by the pump beam. In Fig. 1(a) we demonstrate the dependence of frequency shift d on the envelope function, based on Eq. (14b). Here DF 5 3.8 3 1024rad andt is 85 fs. As is shown in this figure, the
larger the frequency detuning is, the larger the envelope function is. Furthermore, according to Eq. (14b), the am-plitude part depends on the absolute value ofd, not on its sign.
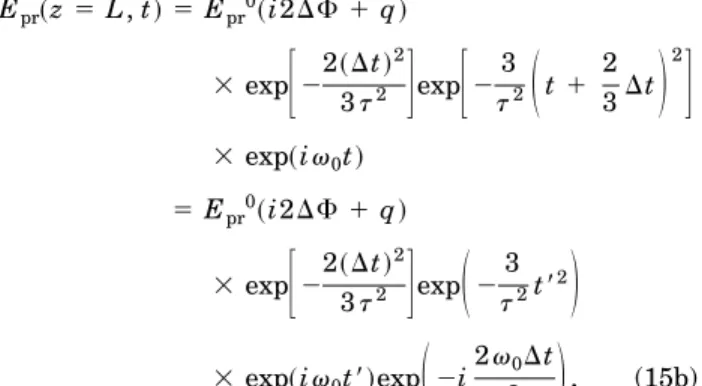
The origin of the modulation function z(d,Dt, DF, q) can easily be illustrated first for the condition of absence of two-photon absorption (q5 0). For the chirp-free la-ser pulses, Epr(z5 0, t) and DEpr(z5 L, t) can be
writ-ten as
Epr~z 5 0, t! 5 Epr0exp~2t2/t2!exp~iv0t!, (15a)
DEpr~z 5 L, t! 5 Epr0~i2DF 1 q! 3 exp
F
22~Dt! 2 3t2G
expF
2 3 t2S
t1 2 3DtD
2G
3 exp~iv0t! 5 Epr0~i2DF 1 q! 3 expF
22~Dt! 2 3t2G
expS
2 3 t2t82D
3 exp~iv0t8!expS
2i 2v0Dt 3D
, (15b)where t85 t 1 2Dt/3. Comparing the time dependences of these two electric fields, we see a time shift 2Dt/3 be-tween their envelope functions. Furthermore, Eq. (15b) indicates that there is a phase shift exp(2i2v0Dt/3) in the
carrier wave with respect to the center of the envelope function. When the change in the transmitted probe in-tensity is detected, the interference between Epr(z
5 0, t) and DEpr(z5 L, t) is in effect monitored. After
the monochromator, only a specific frequency component of the probe beam is selected, yielding a phase shift exp(i2vDt/3) at DEpr(z5 L, t). The total phase shift is
therefore equal to exp@i2(v 2 v0)Dt/3# 5 exp(i2dDt/3). It
is this phase shift between Epr(z5 0, t) and DEpr(z
5 L, t) that leads to the modulation function in Eq. (5). Figure 1(b) shows the change in normalized transmit-tance as a function of the pump–probe time delay for dif-ferent frequency detunings. It displays an antisymmet-ric oscillatory behavior, and the different d values vary only the signal amplitude not the oscillatory feature. With two-photon absorption (q Þ 0), it in effect induces
Fig. 1. Simulated nonlinear transmittance transients with the chirp-free model at three frequency detunings d. (a) Envelope function f(Dt), (b) total transient signal. The induced phase shiftDF is 4 3 1024rad.
an imaginary phase in the probe beam. This time-delay-dependent imaginary phase and the real phase caused by DF lead to a complex constant i2DF 1 q in DEpr(L,v).
This complex constant thus induces a constant phase shift in the modulation function.
B. Linear-Chirp Model
For the linearly chirped Gaussian pulses used in the two-beam coupling measurements, Equations (11) provide an analytical expression for the transmitted probe beam at a frequency detuningd. In this subsection we calculate the results of this equation with different parameters. We choose the material parameters of fused silica in the cal-culation as L5 2 mm, n2I5 2.2 3 10220m2/W, n0
5 1.45332, andb 5 0. Furthermore, the peak intensity of the pump pulse is 1012W/m2, the central wavelength is
793 nm, andt 5 85 fs. These laser parameters are cho-sen to be close to our experimental conditions.
Similar to Eq. (5), Eq. (11a) can be regarded as the product of an envelope function,
f~Dt! 5 h~b,t!exp@g~b,d,t!#
3 exp$2@Dt 2 Ts~b,d,t!#2/@G~b,t!#2%,
(16) where h(b,t) is the amplitude in Eq. (11a) with a modu-lation function
2DF sin Q 2 q cos Q. (17)
Figure 2 shows the calculation results at two frequency-detuning values for b5 9 3 1025s22. In
com-parison with the chirp-free results, the increase here in
the negative frequency detuning shifts the peak of the en-velope function toward the positive time-delay position for a positive chirp [Fig. 2(a)]. The positive frequency detun-ing, on the other hand, shifts the envelope function to the negative time delay. This feature is evidenced by the lin-ear dependence of Ts(b,d,t) ondin Eq. (11b). The
posi-tive b represents that the low-frequency component of the laser pulse is ahead of the high-frequency component. Because the low-frequency component of the probe pulse is shifted to the rising edge, the effective peak position in time of the probe pulse ford, 0 is then moved to an ear-lier time with respect to the original pulse. From Eqs. (11), the normalized transmittance signal is therefore largest when the pump pulse is situated at the rising edge of the probe pulse, namely, at the positive time delay, where the maximum temporal overlap between the pump pulse and the effective probe pulse appears. Apparently, the larger the positive chirp is, the more the peak position of the signal is shifted toward the positive time delay.
As in the discussion of the case without chirp, the change in the linearly chirped probe field after interaction with the pump beam in the sample can be written as
DEpr~z 5 L, t! 5 Epr0~i2DF 1 q!exp
F
2 2~Dt!2 3t2G
3 expS
23 t2t8 2D
exp~iv 0t8!exp~ibt82! 3 expS
2i2v0Dt 3D
3 expH
2ibF
4Dt 3 t1 4 9~Dt! 2GJ
, (18)where t85 t 1 2Dt/3. The total phase shift between Epr(z5 0, t) and DEpr(z5 L, t) after the
monochro-mator is therefore equal to exp
S
i2dDt 3D
expH
2ibF
4Dt 3 t1 4 9~Dt! 2GJ
.Note that it does not disappear, even whend5 0, which is the opposite of the case without chirp, as shown in Fig. 2(b). Furthermore, the second-order time dependence in the phase from the linear chirp leads to the second-order dependence onDt in the total phase shift, yielding a non-linear period in the modulation function, as shown in Eqs. (11) and Fig. 2(b). In comparison with the chirp-free case [Fig. 1(b)], the transient signal in Fig. 2(b) would not nec-essarily reach zero at Dt 5 0, and the oscillatory feature depends on thedvalue.
Finally, a discussion of the effect of the linear chirp pa-rameter b is given below. Both the envelope function and the total nonlinear transmittance were calculated with three positive linear chirp parameters: 0, 53 1025, and 9 3 1025s22. The larger the positive chirp is, the more
the low-frequency component is shifted to the rising edge of the laser pulse, yielding a larger time shift in the peak position, as shown in Fig. 3(a). Notice that the larger b is, the smaller the envelope function f(Dt) is. When lin-ear chirp parameter b is involved in the frequency-domain third-order autocorrelation A(Dt,v), the linear Fig. 2. Simulated nonlinear transmittance transients with the
linear-chirp model at three frequency detuningsd. (a) Envelope function f(Dt), (b) total transient signal. Arrows denote the peak positions of f(Dt). b5 9 3 1025s22, DF 5 3.8 3 1024
chirp creates a larger spectral broadening in A(Dt,v) than the initial linearly chirped probe pulse. This spec-tral broadening decreases the normalized transmittance signal with a specific spectral window for detection. Be-cause of the combination of linear chirp and frequency de-tuning, the total transient feature exhibits a nonsym-metrical modulation feature, as shown in Fig. 3(b).
4. EXPERIMENT
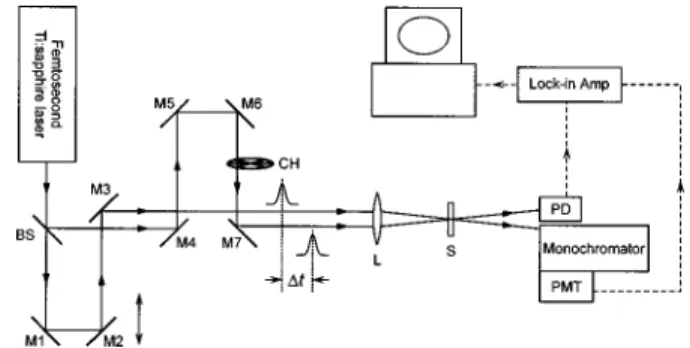
Figure 4 shows a schematic layout of the experimental setup. The output of a femtosecond mode-locked Ti:sap-phire laser (Tsunami, Spectra-Physics) served as the pulsed light source for both the pump and the probe beams. We can fine tune the chirp by adjusting the po-sition of one of four dispersion-compensated prisms inside the cavity. A total average power of;250 mW was used in the experiment. The central wavelength of the output beam was ;793 nm. In performing the pump–probe transmittance measurements we split the output of the femtosecond Ti:sapphire oscillator with a 90/10 (reflection/transmission) beam splitter into pump and probe beams. The beam passing through mirrors M1–M3 is the probe beam, and the one passing through mirrors M4–M7 is the pump beam. A computer-controlled translation stage was used to vary the time de-lay between the pump and the probe pulses with a reso-lution of 0.1mm. The pump and probe beams were then focused noncollinearly into the sample by a plano–convex lens (f5 11.4 cm). To minimize the time-delay error that is due to the noncollinear overlap between the pump and the probe pulses at the sample we selected the
sepa-ration between the two parallel pump and probe beams to be;5 mm, which resulted in a crossing angle of ;2.5° be-tween the pump and probe beams. The transmitted probe beam then went to a 27-cm monochromator that se-lected a specific detecting wavelength with a spectral
width of ;0.2 nm. A photomultiplier (R928,
Hamamatsu) detected the filtered laser’s intensity after the monochromator as a function of the pump–probe time delay. A chopper was placed in the path of the pump beam for phase lock-in detection, as shown in Fig. 4. We carried out the measurements by accumulating and aver-aging 50–60 fast time-delay scans.
A 500-mm-thick b-barium borate crystal was substi-tuted into the sample for an in situ second-harmonic gen-eration (SHG) autocorrelation measurement to determine time zero as well as the pulse duration. The autocorre-lation trace is shown in Fig. 5(a). The extracted pulse duration (full width at half-maximum) is 100 fs, corre-sponding to a pulse-width parameter of 86.6 fs for a Gaussian pulse. The spectrum of the laser pulse was measured with a spectrometer system and is shown in Fig. 5(b). Assuming a linearly chirped Gaussian pulse, the chirp parameter is calculated to be 1.03 1026s22.
We measured the power density of the pump pulse at the sample by scanning a 5 mm-diameter pinhole across the focal spot of the pump beam. The beam waist diameters at the focal point were 78 and 108mm along x and y axes, respectively, of the beam’s cross section. Assuming a Gaussian beam, the corresponding confocal parameters are 12 and 23 mm, respectively. The peak pump power density at the beam waist was estimated to be ;1012W/m2. Because the pump and probe beams
inter-sect at the sample with a crossing angle of;2.5°, the ac-tual power density may be different from this value. Fi-nally, we fitted the nonlinear transmittance transients of the probe beam at several frequency detunings by a non-linear least-squares fitting program (Origin 5.0, Microcal) to extract the induced phase shift as well as the linear chirp in the laser pulses.
To measure the complex time-varying electric field E(t) we installed a SHG FROG setup to perform the measure-ments. The setup is similar to the one used by Taft et al.5 A 200mm type I KDP frequency-doubling crystal was chosen to minimize the GVD. Its corresponding phase-matching bandwidth was calculated to be;60 nm, which should provide enough bandwidth for the SHG pro-Fig. 3. Simulated nonlinear transmittance transients with the
linear-chirp model for three linear chirp parameters b. (a) En-velope function f(Dt), (b) total transient signal. Arrows denote the peak positions of f(Dt). d5 25 3 1013s21; DF
5 3.8 3 1024rad.
Fig. 4. Experimental layout for the transient nonlinear trans-mittance measurements. Mirrors M1–M7 are Ag coated. BS, beam splitter (reflection/transmission, 90/10); CH, chopper; L, plano–convex lens (f5 11.4 cm); S, sample; PD, photodiode de-tector; PMT, photomultiplier tube.
cess. Furthermore, except for the 50/50 beam splitter of femtosecond laser pulses, all the optics are Ag-coated mir-rors to prevent any residual dispersion effect. The cross-ing angle at the crystal between the two beams was cho-sen to be ;3° to minimize the time-delay error that was due to the noncollinear overlap between the pump and the probe pulses. The output SHG signal was then dis-persed by a spectrometer (270M, ISA) and detected by a photodiode array. The spectrometer system monitored the SHG spectrum as a function of the time delay be-tween the two beams, leading to a FROG trace. The FROG trace was measured with a time step of 6.6 fs and a spectral resolution of 0.1 nm and was subsequently ana-lyzed with a phase-retrieval program (FROG 2.0, Fem-tosoft Technologies).
5. RESULTS AND DISCUSSION
A. Model System: Fused Silica
Fused silica is an ideal optical material for many applica-tions. Many of its linear optical properties are well char-acterized and documented. Fused silica has commonly been used as a window material for high-power lasers and is the basic material for soliton-based long-haul fiber op-tical communication, which relies on its third-order opti-cal nonlinearity. The nonlinear refractive index of fused silica has been determined by many research groups and has recently been reviewed.6 We thus use this material
as our model system to check the validity of our linear chirp model and to help us to understand the effects of higher-order chirps.
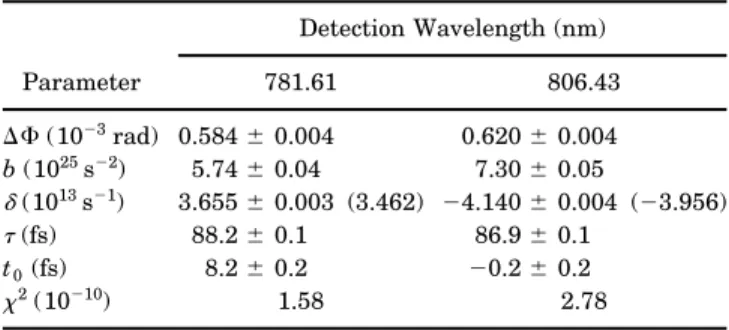
Figure 6 shows the normalized transmittance transient on the 2-mm fused-silica sample for femtosecond laser pulses at two detection wavelengths (781.5 and 806.5 nm). The purpose for performing measurements at these two wavelengths was to demonstrate the difference in the transients caused by the chirp and to check the validity of the linear chirp model at different frequency detunings. To compare these experimental data with the simulation results based on the complete-chirp model we extracted the electric-field amplitude and phase of the laser pulses from the SHG FROG trace. Figure 7 shows the FROG spectrogram and the corresponding intensity and phase. Figure 8 shows the corresponding simulation results with comparable laser and material parameters, except that the complete phase obtained from the FROG measure-ment was used in the calculation.7 As Figs. 6 and 8
show, at each detection wavelength the experimental and simulation transients have nearly the same major fea-tures, with only slight differences. This result demon-strates that the theoretical calculation with the complete chirp can reproduce the experimental results; it has thus been proved to be a helpful tool for studying the two-beam coupling process.8
We performed the fitting with the linear chirp model on both the experimental and the simulation results (Figs. 6 and 8), with all the parameters independently optimized. The corresponding fitted results are listed in Tables 1 and 2. Because the bandgap for fused silica (.4.4 eV) is more than twice the photon energy of the laser pulses (1.55 eV), Fig. 5. Autocorrelation trace and spectrum of the femtosecond
laser pulses at the output of the mode-locked Ti:sapphire oscilla-tor. Solid curves, Gaussian fitting curves. The fitted pulse-width parameter is t, and the full width at half-maximum DfFWHM of the laser spectrum in frequency is shown (DlFWHM
5 11.5 nm).
Fig. 6. Normalized nonlinear transmittance signals obtained for 2-mm-thick fused silica at two detection wavelengths. Open circles, experimental data; solid curves, best-fitting curves with the linear-chirp model. Their fitted results are listed in Table 1. Dashed curves, fitting curves for the chirp-free model.
the two-photon absorption effect was then neglected in the fitting. For the two detection wavelengths, both the time zero positions and the pulse-width parameterst ob-tained were all within a variation of 610 fs imposed by the error in the computer-controlled translation stage. We also performed the fitting with the chirp-free model [Eq. (5)] at the two frequency detunings (as shown in Fig. 6). For the detected probe wavelength at 781.5 nm, the extracted DF is 5.7 3 1024rad andx2 is 4.23 1028; for
806.5 nm, the extracted DF is 4.9 3 1024rad and x2 is 9.63 1028. Notice that neither of the fittings is satisfac-tory and that the extracted DF values differ from those obtained with the linear-chirp model. The extracted lin-ear chirp values, however, differ by.50% for the experi-mental results and by ,20% for the simulation results. This result can be explained by the fact that the higher-order chirps are not considered in the linear-chirp model. The fitted linear chirp b can then be understood as an ef-fective linear chirp under the influence of other higher-order chirps. This is why the fitted b varies for the two different detection wavelengths. Finally, the deduced phase shift,DF, varies less 20% for the two frequency de-tunings, indicating that n2Iextracted by this method may
cause only a small amount of error.
To extract the nonlinear optical constants fromDF and q one has to determine the interaction length L accu-Fig. 7. Intensity and phase data of the laser pulses extracted
from the SHG FROG spectrograms. (a) FROG spectrogram, (b) corresponding intensity I(t) and phasef(t). Filled circles, in-tensity data; open squares, phase data. Solid curve, the best Gaussian fit to the intensity. The fitted pulse-width parameter is 84.2 fs.
Fig. 8. Simulated results for the normalized nonlinear trans-mittance measurements at two detection wavelengths. The chirp was obtained by the FROG trace (described in text). Open circles, simulation data; solid curves, the fitting curves with the linear-chirp model. Fitting results are listed in Table 2.
Table 1. Results Obtained by Fitting the Experimental Data on 2-mm Fused Silica
with the Linear-Chirp Modela
Parameter Detection Wavelength (nm) 781.5 806.5 DF (1023rad) 0.626 0.04 0.526 0.03 b (1025s22) 3.66 0.3 5.76 0.4 d(1013s21) 3.616 0.03 (3.538) 24.26 6 0.03 (24.017) t(fs) 84.06 1.1 83.66 0.9 t0(fs) 6.96 1.3 0.96 1.5 x2(1028) 2.63 3.4
aDF is the phase shift, b is the linear chirp,dis the frequency detuning, t is the pulse-width parameter, t0is the time shift, andx2is the fitting
error. The numbers in parentheses are the measured values.
Table 2. Results Obtained by Fitting the Simulated Transients at Two Frequency Detuningsa Parameter Detection Wavelength (nm) 781.61 806.43 DF (1023rad) 0.5846 0.004 0.6206 0.004 b (1025s22) 5.746 0.04 7.306 0.05 d(1013s21) 3.6556 0.003 (3.462) 24.140 6 0.004 (23.956) t(fs) 88.26 0.1 86.96 0.1 t0(fs) 8.26 0.2 20.2 6 0.2 x2(10210) 1.58 2.78
aDF is the phase shift, b is the linear chirp,dis the frequency detuning, t is the pulse-width parameter, t0is the time zero, andx2is the fitting
error. The numbers in parentheses are the values used in the calcula-tion.
rately. It may not be the same as the sample thickness and depends on the crossing angle between the pump and the probe beams. Because the confocal parameters for the x and the y axes are 12 and 23 mm, respectively, which are much longer than the thickness of our samples, the divergence of the laser beam can be ignored. Because the phase induced by the pump pulse is very small (,1023rad) here, the change in the beam propagation properties of the pump and probe beams is then negli-gible. We can approximate the crossing between two Gaussian beams,
I~x, y! 5 I0exp~2x2/sx2!exp~2y2/sy2!,
as the crossing between two flat-topped beams with beam diameters equal to 2sxin the x direction and to 2syin the
y direction. We therefore ignore the effect of the radius dependence of the laser intensity across the beam profile. Along the direction between the propagation directions of the two beams (z axis), the overlap cross-section area of the two beams can be written as A(z). The effective in-duced phase shift at a z position for a sample thickness of
dz is then given by Df~z! 5 2v0 c n2 IA~z! A0 Ipu0dz, (19)
where A0 is the maximum overlap area. The total
in-duced phase shift is thus the integration over the whole interaction region, i.e.,
Dftotal5 2 v0 cA0 n2IIpu0
E
z02L/2 z01L/2 A~z!dz, (20) where z0 is the middle position of the sample. Theinte-gration in Eq. (19) is effectively equal to the total inter-section volume between the two laser beams. This vol-ume divided by the cross-section area of the laser beam at the focal point is then equal to the effective interaction length. Its calculated value is 0.76 mm for our experi-mental setup. Thus for our fused-silica sample the ac-tual interaction length should be equal to 0.76 mm in-stead of to the sample thickness. Similarly, in extracting the two-photon absorption coefficient one should also ap-ply the same considerations.
Because the only material parameter that influences the normalized transmittance transient in the two-beam coupling measurement is n2I, fused silica can be used as a
reference material for extraction of the nonlinear refrac-tive indices of other materials. During the experiment one can a first measure the transmittance transient data by using a fused-silica sample with a well-defined thick-ness. With the same experimental setup, the new sample can then be inserted into the same sample posi-tion for the measurement. The two measured transients should be identical. After the ratio of the pump laser powers inside the two samples is taken into account, the ratio between their nonlinear refractive indices can then be determined by the ratio in their nonlinear transmit-tance data.
FROG was recently used successfully for extraction of n2Iin several optical materials. In a single-beam
experi-ment the phase difference Df(t) caused by self-phase modulation was calculated by extraction of the
electric-field phase before and after it interacted with the sample.9 In a pump–probe experiment,Df(t) caused by cross-phase modulation from the pump pulse was derived by extraction of the electric-field phase of the probe pulse with and without interaction with the pump pulse in the sample.10 This use of FROG to measure the phase
change, however, has two limitations. First, it requires a higher laser power density (.1013W/m2) to induce
enough phase difference (.1022rad) for complete phase retrieval. In comparison, the transient nonlinear trans-mittance technique described in this paper can reach a sensitivity of ,1026rad with a power density of only ,109W/m2. Second, applying the phase retrieval
algo-rithm in calculating the complete phase permits no two-photon absorption effect in the nonlinear interaction be-tween the laser pulse and the material. Thus the use of this technique is restricted to media with large energy bandgaps, such as fused silica and wide-bandgap semi-conductors. The transient nonlinear transmittance tech-nique, however, has the capability to extract n2Iandb
si-multaneously, as we demonstrate below.
B. n2Iandb of Semiconductor-Doped Glasses
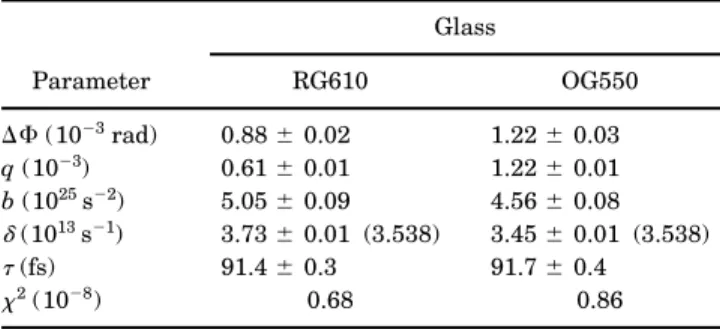
To illustrate their capability to measure two-photon ab-sorption coefficient b, we selected two kinds of semiconductor-doped glass (OG550 and RG610) with which to perform the experiment. Semiconductor-doped glasses are manufactured by addition of the semiconduc-tor constituents or their oxides to the silicate glass melt.11 In the cooling stage, the semiconductor material is then precipitated into nanocrystals. The electronic levels of these semiconductor nanocrystals are affected by their size because of the quantum-confined effect.12 One can
thus finely adjust the optical properties by varying the sizes of these nanocrystals during the growth process. These semiconductor-doped glasses are commonly used as colored glass filters and also have many potential nonlin-ear optical applications. Tuning the electronic states of the embedded nanocrystals close to the resonant condi-tion can thus enhance the third-order optical nonlineari-ties by many orders of magnitude.
The doping semiconductor material for OG550 and RG610 is CdSxSe12x. The difference between these
ma-terials lies in the average radius of the precipitated nanocrystals. The one-photon absorption threshold of OG550 is 2.25 eV, and that of RG610 is 2.03 eV.13 With the laser wavelength at ;800 nm (1.55 eV), the two-photon absorption effect is then involved in the two-beam coupling measurement. The samples can then be used as the testing materials for the measurement. The thick-ness of both samples is 3 mm. Figure 9 shows the experi-mental results for RG610 at 781.5 nm. The results fitted with the linear-chirp model are listed in Table 3. To ex-tract n2Iand b accurately we performed the experiment
on fused silica at the same time. The ratio value of the fitted phase shift in RG610 and the corresponding one in fused silica is 2.425. The interaction length of 0.76 mm was then used in the calculation. The resultant n2I is
equal to 5.83 10220m2/W, which is comparable with the previously published result at 1.064 mm (6.2 3 10220m2/W).11,13 We used this number to obtain the
measurement. We could then obtain the two-photon ab-sorption coefficient by dividing the fitted q value by the effective pump intensity and the interaction length. The resultantb is 3.2 3 10213m/W, which is very close to the
reported value at the same wavelength (2.2
3 10213m/W).11 The experimental results for OG550 at
781.5 nm are shown in Fig. 10. The corresponding fitted results are shown in Table 3. From the same character-ization approach, the extracted value of n2I is 8.1
3 10220m2/W, and theb value is 6.4 3 10213m/W. We
believe that this is the first time that the two nonlinear optical constants of the OG550 glass have been measured.
6. CONCLUSIONS
The nonlinear transient transmittance measurement with femtosecond laser pulses is a highly sensitive method for extracting the nonlinear optical constants n2I
and b. The chirp-free model has provided a convenient formula to explain the transient features measured by transform-limited femtosecond laser pulses. The com-monly found chirp in ultrashort laser pulses has, how-ever, inhibited the use of chirped laser pulses in measur-ing n2I and b based on the chirp-free model. We have
derived a generalized model to explain analytically the transient behavior observed in linearly chirped femtosec-ond laser pulses. This linear-chirp model has thus suc-cessfully provided an intuitive language for understand-ing the major effects caused by the linear chirp embedded in ultrashort laser pulses. The analytical formula thus derived can be regarded as the product of two parts: the envelope function and the modulation function. The en-velope function is a Gaussian function with a time shift that depends on the linear chirp parameter. Further-more, the modulation function can be understood as a nonlinear phase interference caused by the linear chirp.
We have performed two-beam coupling experiments, using chirped femtosecond laser pulses on fused silica. The experimental data can be well fitted by the linear-chirp model. The complete intensity and phase informa-tion obtained from the FROG measurement was used to simulate the transient transmittance signals. The close match between the experimental and simulation results has confirmed that our simulation based on the complete-chirp model can reproduce the experimental results. We also performed nonlinear transient transmittance mea-surements of semiconductor-doped glasses to extract their nonlinear optical constants. We used the experimental result for fused silica as a reference system to determine these constants accurately.
Finally, based on our linear-chirp model, the two-beam coupling method can potentially serve as a monitoring system to measure the linear chirp embedded in the out-put of ultrafast laser systems. This technique is much simpler than other, more-complex phase retrieval tech-niques, such as FROG, because it does not involve elon-gated calculation and the experimental setup is much simpler. Therefore our new technique not only provides a new method for measuring nonlinear optical constants by use of chirped laser pulses but also offers a new tool for monitoring chirp. The chirp in the laser pulses can eas-ily be reflected in the asymmetrical feature in the nonlin-ear transmittance transient. A real-time monitoring ap-paratus that uses the spectrally resolved two-beam coupling method would therefore provide a convenient tool for adjusting the dispersion-compensation element in Fig. 9. Normalized nonlinear transmittance signal obtained for
3-mm RG610 semiconductor-doped glass at 781.5 nm. Open circles, experimental data; solid curve, fitting curve with the linear-chirp model. Fitting results are listed in Table 3.
Fig. 10. Normalized nonlinear transmittance signal obtained for 3-mm OG550 semiconductor-doped glass at 781.5 nm. Open circles, experimental data; solid curve, fitting curves with the linear-chirp model. Fitting results are listed in Table 3.
Table 3. Results Obtained by Fitting the Experi-mental data at 781.5 nm on 3-mm
Semiconductor-Doped Glasses with the Linear-Chirp Modela
Parameter Glass RG610 OG550 DF (1023rad) 0.886 0.02 1.226 0.03 q (1023) 0.616 0.01 1.226 0.01 b (1025s22) 5.056 0.09 4.566 0.08 d(1013s21) 3.736 0.01 (3.538) 3.456 0.01 (3.538) t(fs) 91.46 0.3 91.76 0.4 x2(1028) 0.68 0.86
aDF is the phase shift, b is the linear chirp,dis the frequency detuning, t is the pulse-width parameter, and x2is the fitting error. The numbers
femtosecond laser systems (such as the prism position for mode-locked oscillators and the grating separation in the compressor of ultrafast regenerative amplifiers). We in-tend to implement this technique to retrieve and monitor chirp in real time at the output of a femtosecond laser sys-tem.
ACKNOWLEDGMENTS
This research was supported by the National Science Council (grants nos. NSC 2112-M-002-026 and 88-2112-M-001-038) of Taiwan.
J.-K. Wang’s e-mail address is [email protected]. tw.
REFERENCES AND NOTES
1. R. L. Sutherland, Handbook of Nonlinear Optics (Marcel Dekker, New York 1996), and references therein.
2. M. Sheik-Bahae, A. A. Said, T.-H. Wei, D. J. Hagan, and E. W. Van Stryland, IEEE J. Quantum Electron. QE-6, 760 (1990), and references therein.
3. X. Kang, T. Krauss, and F. Wise, Opt. Lett. 22, 1077 (1997). 4. J.-C. Diels and W. Rudolph, Ultrashort Laser Pulse
Phe-nomena (Academic, San Diego, Calif. 1995).
5. G. Taft, A. Rundquist, M. Murnane, I. P. Christov, H. C. Kapteyn, K. W. DeLong, D. N. Fittinghoff, M. A. Krumbu¨-gel, J. N. Sweetser, and R. Trebino, IEEE J. Sel. Top. Quan-tum Electron. 2, 575 (1996).
6. D. Milam, Appl. Opt. 37, 546 (1998).
7. In the calculation of the simulated nonlinear transmittance signals we used the complete phase derived from the FROG
measurement. The best Gaussian fit to the intensity data was adopted in the calculation. A calculation with the ac-tual intensity data was also performed, which resulted in a worse match with the experimental nonlinear transmit-tance data, perhaps because of an error in the intensity re-trieved from the FROG measurement.
8. We also performed the calculation by using different orders of polynomials to fit the extracted phase from the FROG measurement. We found that the amplitude of the simu-lated transient when only the linear chirp was used did not agree with the experimental data. When the higher-order chirps were included in the calculation, the whole body of experimental data could be reproduced. A close compari-son of the experimental and the simulation results has shown that there are still slight differences between them. Furthermore, the sample length is one hundredth of the dispersion length LD. The effect of GVD is normally re-garded to be negligible [G. P. Agrawal, Nonlinear Fiber Op-tics, 2nd ed. (Academic, San Diego, Calif. 1989), Chapter 4]. It is thus conceivable that this discrepancy is due to errors in intensity and phase of the laser pulses extracted from the FROG measurement. This fact has further demon-strated that the transient nonlinear transmittance tech-nique is more sensitive to the chirp than is FROG. 9. A. J. Taylor, G. Rodriguez, and T. S. Clement, Opt. Lett. 21,
1812 (1996).
10. G. Rodriguez and A. J. Taylor, Opt. Lett. 23, 858 (1998). 11. G. P. Banfi, V. Degiorgio, and D. Ricard, Adv. Phys. 47, 447
(1998).
12. M. G. Bawendi, M. L. Steigerwald, and L. E. Brus, Annu. Rev. Phys. Chem. 41, 477 (1990); Y. Wang and N. Herron, J. Phys. Chem. 95, 525 (1991); A. P. Alivisatos, J. Phys. Chem. 100, 13,226 (1996); A. Tomasulo and M. C. Ra-makrishna, J. Chem. Phys. 105, 3612 (1996).
13. G. P. Banfi, V. Degiorgio, D. Fortusini, and H. M. Tan, Appl. Phys. Lett. 67, 13 (1995).