國立交通大學
科技管理研究所
碩士論文
AN ANALYSIS OF DYNAMIC CAPABILITIES:
SAMSUNG ELECTRONICS COMPANY AND TSMC
研究生:Michael J. McCool, Jr.
指導老師:袁建中 教授
AN ANALYSIS OF DYNAMIC CAPABILITIES: SAMSUNG ELECTRONICS COMPANY AND TSMC
Student: Michael J. McCool, Jr. Advisor: Dr. Benjamin Yuan
Institute of Management of Technology National Chiao Tung University
A Thesis
Submitted to the Faculty of the Institute of Management of Technology College of Management
National Chiao Tung University in Partial Fulfillment of the Requirements
for the Degree of Master
In
Business Administration
June 2010
ABSTRACT
This paper examines two highly successful Asian firms in the semiconductor manufacturing industry, Samsung Electronics Company, LTD. (SEC) from South Korea and Taiwan Semiconductor Manufacturing Company (TSMC) from Taiwan. It provides historical background information on the two firms, as well as a rationalization for why they were chosen for the study. It utilizes the dynamic capabilities approach to analyze their practices over the period from 1998 to 2009 in the attempt to explain their success, which is done by reviewing their past behavior when faced with environmental challenges. The time period of the study is further divided into three periods (1998-2001, 2002-2005, and 2006-2009) based on cyclical downturns in the industry. In order to evaluate the firms’ performance, the study also includes an in-depth financial analysis. The dynamic capabilities approach was found to be well suited to this study as it emphasizes firm specific paths to success in dynamic environments, which is characteristic of the semiconductor industry. The study shows that by being sensitive to opportunities and threats in their environment, the two firms have been able to make timely and market-oriented decisions and change their resource bases to systematically solve problems, which in turn resulted in increased competitiveness and financial performance.
Keywords: dynamic capabilities, resource based view, competitive advantage, financial performance
Table of Contents ABSTRACT.……….……….…….……i Table of Contents.……….………..…...ii List of Tables……..………...………iv List of Figures………..…..v I. Introduction……….………..…..1
II. Literature Review…..……….………...2
III. Industry Review………...………8
3.1 Dynamic Capabilities Importance for the Semiconductor Industry……….8
3.2 Why Were SEC And TSMC Chosen For This Study?………...10
IV. Research Framework…………...………...…12
4.1 Establishing a Definition of Dynamic Capabilities………12
4.2 Measurement………..…….………...15
V. Identification of Dynamic Capabilities in SEC and TSMC………..…………..16
5.1 The Case of Samsung Electronics Company………...…………..…16
5.1.1 SEC overview……….…….16
5.1.2 SEC dynamic capabilities by period………...16
5.1.2.1 Period 1: 1998-2001……….……17
5.1.2.2 Period 2: 2002-2005……….……21
5.1.2.3 Period 3: 2006-2009……….……26
5.2 The Case of Taiwan Semiconductor Manufacturing Corporation………….……31
5.2.1 TSMC overview………..31
5.2.2 TSMC dynamic capabilities by period………32
5.2.2.1 Period 1: 1998-2001……….33
5.2.2.2 Period 2: 2002-2005……….36
5.2.2.3 Period 3: 2006-2009……….38
5.3 Conclusion of Dynamic Capabilities in SEC and TSMC………...41
VI. Analysis of Financial Data: Samsung Electronics Corporation and TSMC………..41
6.1 Financial Performance: Firms v National Economic Trends……….……42
6.1.1 SEC sales growth rate v Korean GDP growth rate……….……42
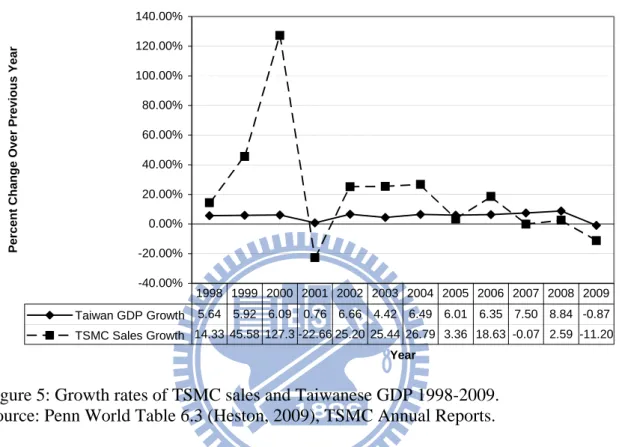
6.1.2 TSMC sales growth rate v Taiwanese GDP growth rate……….44
6.2 Financial Performance of the Firms Relative to Industry Average………46
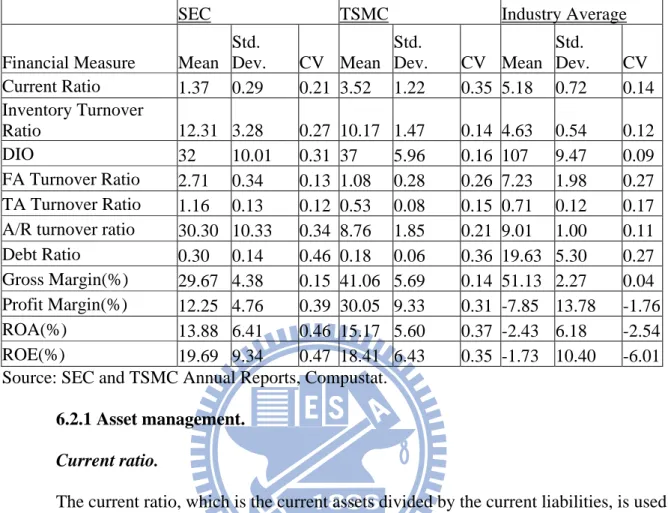
6.2.1 Asset management………...47
6.2.2 Long-term solvency: the debt ratio……….……54
6.2.3 Profitability……….…….55
6.3 Conclusion of financial analysis……….……...58
VII. Conclusion………59
References………62
List of Tables
Table 1: Main Elements of Dynamic Capabilities Framework……….………….5
Table 2: Examples of Types of Dynamic Capabilities………...6
Table 3: Main Definitions of Dynamic Capabilities………..7
Table 4: Dynamic Capabilities by Period SEC………17
Table 5: Dynamic Capabilities by Period TSMC……….33
Table 6: Financial Ratios 1998-2009: SEC, TSMC, and Industry Average………47
List of Figures
Figure 1: SEC, TSMC, and industry average ROA 1998-2009 periods 1, 2, and 3……...…..11
Figure 2: SEC, TSMC, and industry average ROE 1998-2009 periods 1, 2, and 3…….……12
Figure 3: Dynamic capabilities theoretical framework………14
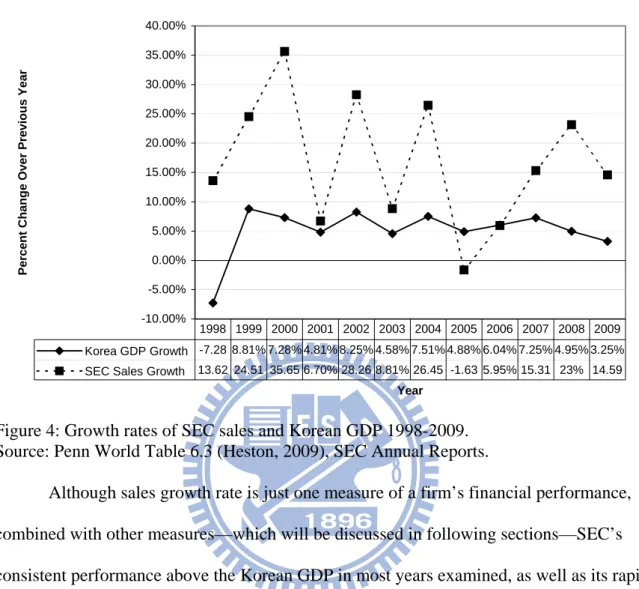
Figure 4: Growth rates of SEC sales and Korean GDP 1998-2009………..………...44
Figure 5: Growth rates of TSMC sales and Taiwanese GDP 1998-2009………..……..46
Figure 6: SEC, TSMC, and industry average current ratios 1998-2009………..…48
Figure 7: SEC, TSMC, and industry average turnover ratios 1998-2009………50
Figure 8: SEC, TSMC, and industry average days inventory outstanding 1998-2009………51
Figure 9: SEC, TSMC, and industry average fixed asset turnover ratios 1998-2009………..52
Figure 10: SEC, TSMC, and industry average total asset turnover ratios 1998-2009……….53
Figure 11: SEC, TSMC, and industry average A/R turnover ratios 1998-2009………..54
Figure 12: SEC, TSMC, and industry average debt ratios 1998-2009……….55
Figure 13: SEC, TSMC, and industry average profit margins 1998-2009………...…56
Figure 14: SEC, TSMC, and industry average ROA 1998-2009……….57
Figure 15: SEC, TSMC, and industry average ROE 1998-2009……….58
I. Introduction
Two of the most successful companies in the semiconductor industry are Samsung Electronics Company (SEC) and Taiwan Semiconductor Manufacturing Company (TSMC). Both were listed in Forbes list of 2000 global high performers in their industry in 2009 with ranks of 1st and 3rd respectively (Forbes, 2009). In the first quarter of 2010, SEC was ranked 2nd and TSMC was ranked 5th in semiconductor sales. They also are leaders in R&D, being granted a total of almost 4,000 U.S. patents in 2009 according to the Intellectual Property Owners Association, with SEC being ranked 2nd with 3,592 patents granted and TSMC being granted 311 patents ("Intellectual Property Owner's Association," 2009). Both firms are publicly traded companies, SEC being listed on the Korean Stock Exchange and TSMC being listed both on the Taiwan Stock Exchange and on the New York Stock exchange, and known for providing value for their shareholders. Both firms are highly profitable, with SEC
averaging a profit margin of over 13% and TSMC averaging about 30% over the last ten years.
The impressive success of these two companies over time in an industry characterized by rapid change invites the question as to how they have performed so well. It is the position of this paper that it is through their dynamic capabilities that they have survived and thrived where so many other firms have failed.
The field of dynamic capabilities research was chosen for this study because of its applicability to the rapidly changing environment of technology manufacturing. Its firm-specific nature, and its ability to look at firm competitiveness as the result of firm-specific management strategies and actions makes it particularly suited for the study of these two firms. In addition, it links financial performance to a firm’s ability to solve problems in a dynamic environment, which provides a method of measurement of firm success.
This paper is organized into sections as follows: first the relevant literature on dynamic capabilities is reviewed, including its origins, characteristics, and main definitions. Then a working definition for this study is adopted. Second, an industry review is conducted to explain why the semiconductor industry in general, and these two companies specifically, were chosen for this study. The following section delineates the research framework for the study that further defines dynamic capabilities and describes how they are measured. The next section is divided into two sections that describe the dynamic capabilities of SEC and TSMC over the period from 1998 to 2009 in terms of their historical ability to adjust to a rapidly changing environment. To analyze the results of the two firms use of dynamic capabilities, the next section is an evaluation of their financial performance based on an analysis of their yearly financial reports. The conclusion summarizes the findings and makes suggestions based on them.
II. Literature Review
There is no question as to whether SEC and TSMC are successful companies, but the question of interest to management strategists is not whether or not a firm is successful, but how they become that way. In other words, what strategies do managers use to achieve competitive advantage in their industries?
Earlier approaches to management strategy emphasized competitive forces such as entry barriers, threat of substitution of products or services, bargaining power of buyers, bargaining power of suppliers, and rivalry among existing competitors (M. E. Porter, 1980; M. E. Porter, 2008), or strategic conflict which uses game theory to analyze competition between firms (Shapiro, 1989). Teece refers to these approaches as “models of strategy emphasizing the exploitation of market power” (D. J. Teece, Pisano, G., & Shuen, A., 1997). The limitations of these two approaches, according to Teece, is that the first is based in
industry structure rather than firm structure, and the second is that it implies that “success in the marketplace is the result of sophisticated plays and counterplays, when this is generally not the case at all” (D. J. Teece, Pisano, G., & Shuen, A., 1997). He also notes that these two approaches lack a “dynamic view of the business enterprise” (D. J. Teece, Pisano, G., & Shuen, A., 1997).
From this Teece moves to the resource-based view (RBV) (J. B.. Barney, 1986; J. B. Barney, 1991) in which firms are profitable not because they use market forces to “deter entry and raise prices above long-run costs,” or because they are good at playing games, “but because they have markedly lower costs, or offer markedly higher quality or product
performance” (D. J. Teece, Pisano, G., & Shuen, A., 1997). In this view, competitive advantage is firm-specific, rather than industry-based, and it “lies ‘upstream’ of product markets and rests on the firm’s idiosyncratic and difficult-to-imitate resources” (D. J. Teece, Pisano, G., & Shuen, A., 1997).
Eisenhardt describes RBV as assuming “that firms can be conceptualized as bundles of resources” that are “heterogeneously distributed across firms” and that “resource
differences persist over time” (Eisenhardt, 2000). She goes on to say that “when firms have resources that are valuable, rare, inimitable, and nonsubstitutable … they can achieve sustainable competitive advantage by implementing fresh value-creating strategies that cannot be easily duplicated by competing firms” (Eisenhardt, 2000). These resources are referred to as VRIN resources, and they can consist of financial or physical assets, human resources, skills, knowledge, timing, etc. Because in the RBV resources have VRIN attributes, it contrasts with the competitive forces approach, which assumes that a firm can simply
acquire the assets necessary to compete in the market after choosing an industry to enter (D. J. Teece, Pisano, G., & Shuen, A., 1997).
It is from the RBV that the dynamic capabilities approach was born. The RBV itself asserts that competitive advantage springs from a firm’s resources, but it does not account for the capabilities for acquiring, using or changing these resources. Also, according to Barreto, it is “essentially static in its nature and inadequate to explain firms’ competitive advantage in changing environments” (Barreto, 2010). This is where dynamic capabilities come into play.
Teece proposed the dynamic capabilities to explain how some firms become
“[w]inners in the global marketplace” by demonstrating “timely responsiveness and rapid and flexible product innovation, coupled with the management capability to effectively
coordinate and redeploy internal and external competences” (D. J. Teece, Pisano, G., & Shuen, A., 1997). In this view, dynamism is fundamental, and dynamic “refers to the capacity to renew competences so as to achieve congruence with the changing business environment” (D. J. Teece, Pisano, G., & Shuen, A., 1997). The concept of a capability “emphasizes the key role of strategic management in appropriately adapting, integrating, and reconfiguring internal and external organizational skills, resources, and functional competence to match the requirements of a changing environment” (D. J. Teece, Pisano, G., & Shuen, A., 1997).
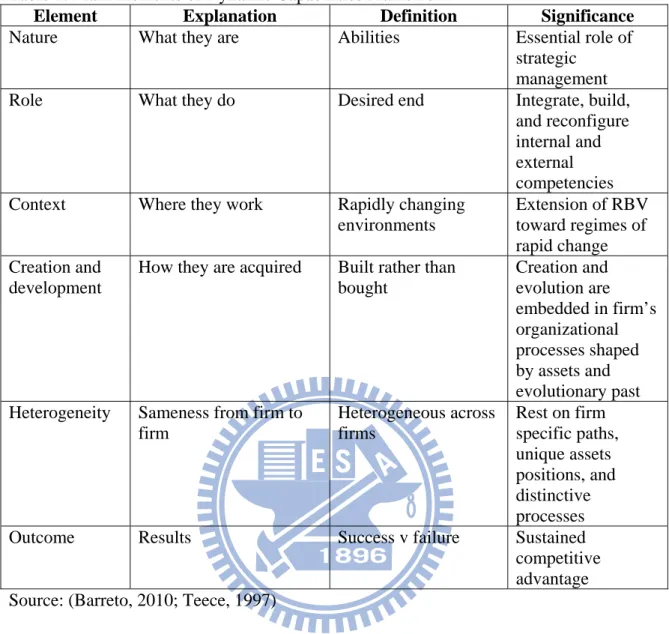
According to Teece’s (1997) definition, dynamic capabilities are made up of a number of elements. Table 1 describes the main elements of dynamic capabilities.
Table 1: Main Elements of Dynamic Capabilities Framework
Element Explanation Definition Significance
Nature What they are Abilities Essential role of
strategic management
Role What they do Desired end Integrate, build,
and reconfigure internal and external competencies Context Where they work Rapidly changing
environments Extension of RBV toward regimes of rapid change Creation and development
How they are acquired Built rather than bought Creation and evolution are embedded in firm’s organizational processes shaped by assets and evolutionary past Heterogeneity Sameness from firm to
firm Heterogeneous across firms Rest on firm specific paths, unique assets positions, and distinctive processes
Outcome Results Success v failure Sustained
competitive advantage Source: (Barreto, 2010; Teece, 1997)
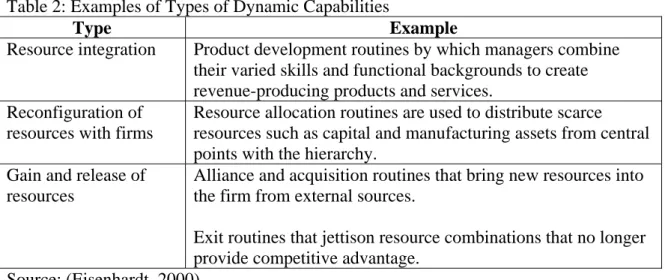
There are many different types of dynamic capabilities, each of which can be utilized in various ways. Table 2 gives just a few examples of types of dynamic capabilities with examples of how they could be used.
Table 2: Examples of Types of Dynamic Capabilities
Type Example
Resource integration Product development routines by which managers combine their varied skills and functional backgrounds to create revenue-producing products and services.
Reconfiguration of resources with firms
Resource allocation routines are used to distribute scarce resources such as capital and manufacturing assets from central points with the hierarchy.
Gain and release of resources
Alliance and acquisition routines that bring new resources into the firm from external sources.
Exit routines that jettison resource combinations that no longer provide competitive advantage.
Source: (Eisenhardt, 2000)
In addition to Teece’s original definition of dynamic capabilities as “the firm’s ability to integrate, build, and reconfigure internal and external competences to address rapidly changing environments” (D. J. Teece, Pisano, G., & Shuen, A., 1997), there have been numerous subsequent studies that put forward their own definitions. Table 3 summarizes the main definitions of dynamic capabilities.
Table 3: Main Definitions of Dynamic Capabilities
Study Definition
Teece & Pisano The subset of the competences and capabilities that allow the firm to create new products and processes and respond to changing market circumstances (D. Teece, Pisano, Gary, 1994).
Teece, Pisano, & Shuen The firm’s ability to integrate, build, and reconfigure internal and external competences to address rapidly changing environments (D. J. Teece, Pisano, G., & Shuen, A., 1997).
Eisenhardt & Martin The firm’s processes that use resources—specifically the processes to integrate, reconfigure, gain, and release resources—to match and even create market change; dynamic capabilities thus are the organizational and strategic routines by which firms achieve new resource configurations as markets emerge, collide, split, evolve, and die (Eisenhardt, 2000).
Teece The ability to sense and then seize opportunities quickly and proficiently (D. J. Teece, 2000).
Zollo & Winter A dynamic capability is a learned and stable pattern of collective activity through which the organization systematically generates and modifies its operating routines in pursuit of improved effectiveness (Zollo, 2002).
Winter Those (capabilities) that operate to extend, modify, or create ordinary capabilities (Winter, 2003).
Zahra, Sapienza, & Davidsson The abilities to reconfigure a firm’s resources and routines in the manner envisioned and deemed appropriate by its principal decision maker(s) (Zahra, 2006).
Helfat et al. The capacity of an organization to purposefully create, extend, or modify its resource base (Helfat, 2007). Teece Dynamic capabilities can be disaggregated into the
capacity (a) to sense and shape opportunities and threats, (b) to seize opportunities, and (c) to maintain
competitiveness through enhancing, combining, protecting, and, when necessary, reconfiguring the business enterprise’s intangible and tangible assets (David J. Teece, 2007).
Source: (Barreto, 2010)
In addition to the definitions in Table 3, Barreto suggests his own definition: “A dynamic capability is the firm’s potential to systematically solve problems, formed by its propensity to sense opportunities and threats, to make timely and market-oriented decisions, and to change its resource base” (Barreto, 2010). This is the definition that will be used for
this study, to which is added “dynamic capabilities influence competitiveness, and subsequently financial performance” (Wu & Wang, 2007).
In examining the success and future implications of SEC and TSMC, this study used the dynamic capabilities approach, as it is the most appropriate for firms in the semiconductor industry, which is characterized by a rapidly changing environment. According to Wu, “for technology-based manufacturers, dynamic capability, or the capability to adjust to rapid environmental change, is particularly important to survival” (Wu & Wang, 2007). As such, it is particularly important to note that, according to Eisenhardt, “dynamic capabilities vary with market dynamism” and that in moderately dynamic markets in which “change occurs in the context of stable industry structure, dynamic capabilities resemble the traditional
conception of routines” in that they are “complicated, detailed, analytic processes that rely extensively on existing knowledge and linear execution to produce predictable outcomes” (Eisenhardt, 2000). This is in contrast to “high-velocity markets where structure is blurring” in which “dynamic capabilities take on a different character” (Eisenhardt, 2000). Specifically, “[t]hey are simple, experiential, unstable processes that rely on quickly created new
knowledge and iterative execution to produce adaptive but unpredictable outcomes”
(Eisenhardt, 2000). It is the position of this paper that the semiconductor industry, of which SEC and TSMC are part, has the attributes of the former, being moderately dynamic, and therefore the dynamic capabilities demonstrated by the two firms show the characteristics consistent with moderately dynamic markets.
III. Industry Review
3.1 Why Are Dynamic Capabilities Important for the Semiconductor Industry?
The industry chosen for this study is the semiconductor industry. The reason for this is that it is a relatively young and particularly dynamic field. In the period covered by this
study, 1998-2009, changes in technology have occurred that would have been difficult to imagine at the outset. A few examples are the growth and demise of the dot com bubble, the explosive expansion in the use of cellular phones, and the integration of communications, wireless technology, and computers. Product lifecycles are getting shorter and shorter. The speed with which these new technologies, all of which, and many more, utilize
semiconductors, enter the market and then quickly become obsolete is unprecedented. Dynamic capabilities, which are arguably useful for any type of firm, are particularly crucial to industries where rapid change is the norm. “In these markets, where the competitive landscape is shifting, the dynamic capabilities…become the source of sustained competitive advantage” (Eisenhardt, 2000). In fact, the dynamic capabilities approach was born out of “[t]he global competitive battles in high-technology industries” that have “demonstrated the need for an expanded paradigm to understand how competitive advantage is achieved” (D. J. Teece, Pisano, G., & Shuen, A., 1997). Dynamic capabilities are necessary in a fast-moving technological industry like the semiconductor industry in which “time-to-market and timing are critical, the rate of technological change is rapid, and the nature of future competition and markets difficult to determine” (D. J. Teece, Pisano, G., & Shuen, A., 1997).
3.2 Why Were SEC And TSMC Chosen For This Study?
The firms chosen for this study are Samsung Electronics Co., LTD (SEC) and Taiwan Semiconductor Manufacturing Company (TSMC). They were chosen because they are both high-technology companies in the semiconductor manufacturing industry, and although Samsung Semiconductor is only one of five divisions of SEC, it has made up an average of about 30% of SEC’s sales in the years 2004-2009 (SEC, 2009b). Both are exemplary firms from their respective countries, South Korea and Taiwan. Each has a substantial market share in the semiconductor foundry industry, with TSMC ranking first with 44.8% and SEC
ranking tenth with 1.4% in 2009 (LaPedus, 2010). In addition, in 2009 SEC and TSMC were cited by IC Insights as two of only three companies in the semiconductor industry to spend at least a billion dollars on capital expenditure in 2009, ranked 2 and 3 respectively ("IC
Insights," 2009), and IC Insights ranked SEC as number 2 in first quarter 2010 semiconductor sales, while TSMC ranked number 5 ("IC Insights," 2010). Finally, both companies were ranked in the top 300 organizations granted U.S. patents in 2009, with SEC ranking number 2 with 3,592 patents, and TSMC ranking 67th with 311 patents ("Intellectual Property Owner's Association," 2009).
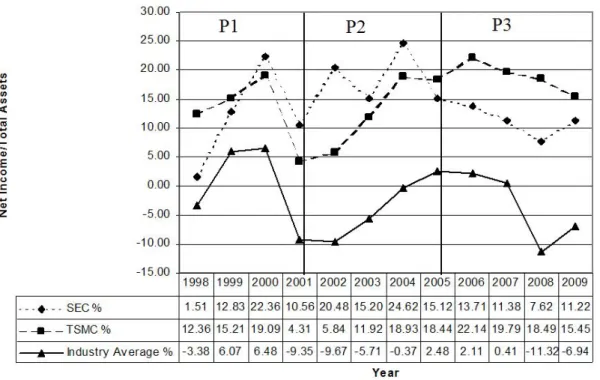
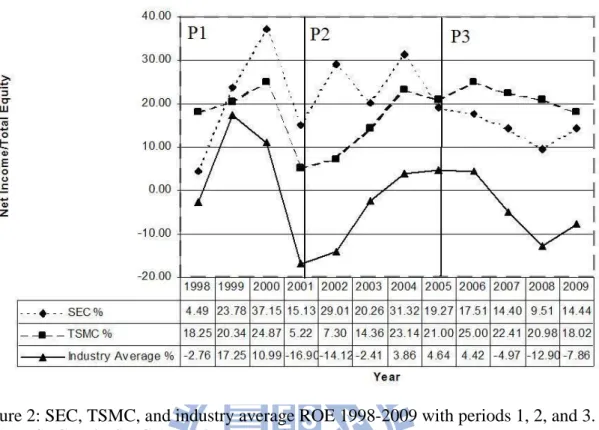
Besides their positions as leaders in their industry, both firms have shown exceptional performance in terms of profitability. Two measures of profitability are return on assets and return on equity, and in both measures SEC and TSMC have performed well above the industry average. Although they performed better than the industry average, as shown in figures 1 and 2, they have also had downturns over the years, particularly in 2001 and 2005. For this reason the period between 1998 and 2009 has been divided into three periods: 1998-2001, 2001-2005, and 2005-2009. It is the goal of this paper to explain how the firms in question were able to achieve the level of profitability they did, and how they reversed the
downturns by using their dynamic capabilities. It also looks at what appears to be a slowdown in growth and profitability in the last period examined.
Figure 1: SEC, TSMC, and industry average ROA 1998-2009 with periods 1, 2, and 3. Source: SEC and TSMC Annual Reports, (Compustat, 2010).
Figure 2: SEC, TSMC, and industry average ROE 1998-2009 with periods 1, 2, and 3. Source: SEC and TSMC Annual Reports, Compustat.
IV. Research Framework 4.1 Establishing a Definition of Dynamic Capabilities
The theoretical framework for this paper is based on the dynamic capabilities view which asserts that “firms should be managed in such a way that they can build successive temporary advantages by effectively responding to successive environmental shocks”
(Barreto, 2010). There have been many diverse definitions proposed for dynamic capabilities, as can be seen in Table 3. For the purposes of this paper, we base our definition on the
following:
“A dynamic capability is the firm’s potential to systematically solve problems, formed by its propensity to sense opportunities and threats, to make timely and market-oriented decisions, and to change its resource base” (Barreto, 2010).
This definition was chosen because it takes into account the breadth of previous research, as well as accommodates the possibilities for future studies. As the purpose of this study in part is to examine how dynamic capabilities manifest themselves in financial terms, an additional dimension is added to take into account the results of having dynamic
capabilities: “dynamic capabilities influence competitiveness, and subsequently financial performance” (Wu & Wang, 2007).
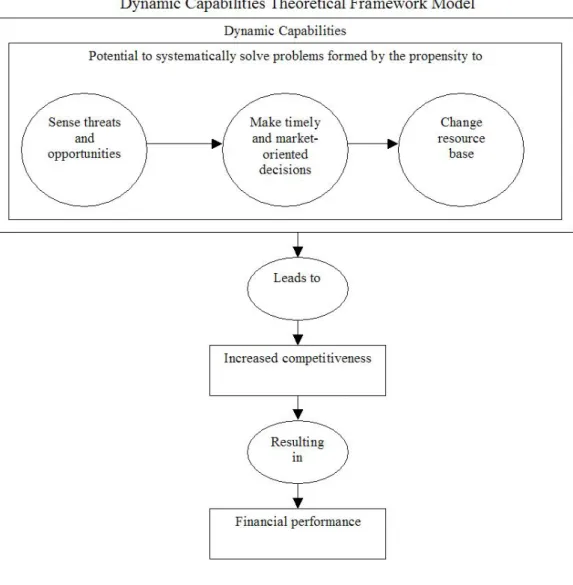
Figure 3 shows a model of the framework used in this study. It shows that dynamic capabilities have various dimensions that are dependent on each other. The first dimension is the propensity for a firm to sense threats and opportunities from its environment. Once a threat or opportunity is sensed, the firm must have a propensity to make quick and effective decisions as to what to do about it. Finally, the firm must be willing and able to change its resource base to support its decision. When a firm has these propensities, it is able to systematically solve problems. The problems for most firms can be summarized by how to remain competitive and provide value for their stakeholders. As figure 3 shows, when a firm has dynamic capabilities, it leads to increased competitiveness, which can be measured by its financial performance.
Figure 3: Dynamic capabilities theoretical framework.
An important aspect of this definition is that it emphasizes a firm’s potential to solve problems that is formed its propensity to perform certain functions, namely to sense
opportunities and threats, to make timely and market-oriented decisions, and to change its resource base. Baretto (2010) refers to these four functions as dimensions, and he asserts that although they are separate dimensions, they cannot be considered in isolation from each other because of their interdependency. For example, sensing opportunities and threats is not useful if not accompanied by the ability to make decisions, and decision-making ability is not useful if the firm cannot change its resource base.
The definition states that it is a firm’s potential to systematically solve problems that demonstrates its dynamic capabilities, which is to say that the firm has the ability to do so, whether or not it actually does. It further states that this potential is formed by its propensity to perform the various functions mentioned above. A propensity is an inclination, aptness, or tendency to behave in a certain way. Where this formative propensity comes from varies from firm to firm, and could be the result of the firm’s structure, culture, leadership, or a number of other factors. What is important here is that the firm utilizes its potential to react quickly and effectively to environmental shocks. It is also important that these activities be done systematically, and as such is an ongoing part of the structure of the firm (Zollo, 2002).
4.2 Measurement
In order to determine the extent to which the firms examined in this paper have and use dynamic capabilities, we will examine the four dimensions of our definition in relation to the historical strategic initiatives each firm has employed. Source material used will include the firms’ annual reports, academic journal articles, as well as other documents. In order to determine the relative success of the firms, a financial analysis will be used.
The annual reports and other historical accounts of the firms will be used as a kind of “survey data,” which Baretto (2010) states “can provide direct assessments of the
propensities involved”. He goes on to say that “similar approaches can be employed to measure other dimensions of the aggregate construct” and that “future studies should use not only the focal firm’s managers…but also third parties (e.g., financial analysts) to mitigate potential bias…from the former group.” For this reason we will use not only statements from management found in the annual reports, but historical studies by other researchers as well as an analysis of the financial performance of the firms, particularly in relation to corresponding national financial trends and industry averages.
V. Identification of Dynamic Capabilities in SEC and TSMC 5.1 The Case of Samsung Electronics Company
5.1.1 SEC overview.
In 1938 Byung-Chull Lee started a small export company that focused on selling fish and vegetables to China. Soon the company expanded into flour milling and confections, and developed its own manufacturing and sales operations. By the early 1960’s, when a number of multinational firms began to exploit the cheap labor force available in South Korea, Samsung had established its first toe-hold in the semiconductor industry by performing
simple packaging processes for wholly owned foreign subsidiaries (L. S. Kim, 1997). In 1969, Samsung Electronics Company (SEC) was founded, and has since turned into the largest manufacturer in Korea (Yu, 1998), and is a global leader in such products as home electronics, mobile phones and telecommunications systems, semiconductors, and LCD panels. According to a recent Wall Street Journal article, SEC is poised to become the world’s largest high-tech company by revenue, and is currently only second to Hewlett-Packard (J.-A. Lee, 2010).
It is the assertion of this paper that the success of SEC is due to its dynamic capabilities, which according to our definition is its “potential to systematically solve problems, formed by its propensity to sense opportunities and threats, to make timely and market-oriented decisions, and to change its resource base” (Barreto, 2010).
5.1.2 SEC dynamic capabilities by period.
In order to examine SEC’s dynamic capabilities, the period from 1998 to 2009 has been divided into three sections. The division between periods corresponds with a relatively low point in SEC’s profitability as measured by its ROA (fig. 1) and ROE (fig. 2). These low points, 2001 and 2005, both coincided with global economic shocks, environmental disasters,
and political upheaval. An additional low point occurred in 2003, which for SEC was also a year in which the global business environment was unfavorable due in part to the military conflict in Iraq. As the definition of dynamic capabilities states that dynamically capable firms have the ability to systematically solve problems, SEC’s response to the events that caused the downturns in their profitability will be examined in terms of their ability to sense opportunities and threats in these events, to make timely and market-oriented decisions, and to change its resource base in order to restore its level of profitability.
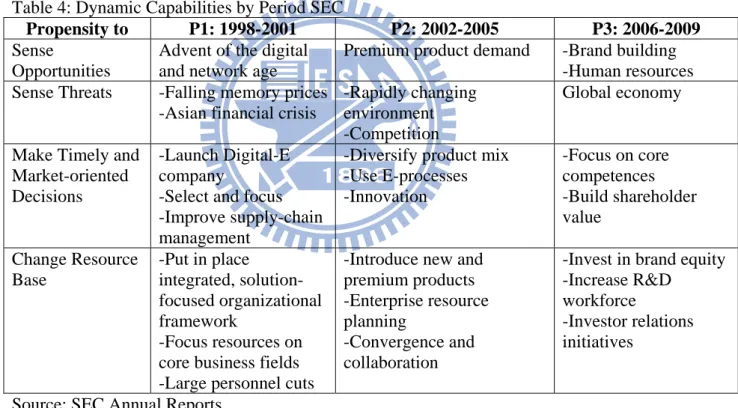
Table 4 gives a brief summary of SEC’s use of its dynamic capabilities for each of the three periods (P1, P2, and P3).
Table 4: Dynamic Capabilities by Period SEC
Propensity to P1: 1998-2001 P2: 2002-2005 P3: 2006-2009
Sense
Opportunities
Advent of the digital and network age
Premium product demand -Brand building -Human resources Sense Threats -Falling memory prices
-Asian financial crisis
-Rapidly changing environment -Competition
Global economy
Make Timely and Market-oriented Decisions
-Launch Digital-E company
-Select and focus -Improve supply-chain management
-Diversify product mix -Use E-processes -Innovation -Focus on core competences -Build shareholder value Change Resource Base -Put in place integrated, solution-focused organizational framework -Focus resources on core business fields -Large personnel cuts
-Introduce new and premium products -Enterprise resource planning
-Convergence and collaboration
-Invest in brand equity -Increase R&D workforce
-Investor relations initiatives
Source: SEC Annual Reports.
5.1.2.1 Period 1: 1998-2001.
Period 1 ranges from 1998 to the end of 2001, during which time SEC’s ROA and ROE increased drastically for two years and then decreased at the end of the period. ROA went from 1.51% in 1998 to 22.36% in 2000, and then dropped to 10.56% in 2001. ROE rose from 4.49% in 1998 to 37.15% in 2000, and then dropped to 15.13% in 2001. These changes
followed the general trend of, but were significantly higher than, the industry average. The fact that SEC’s profitability remained higher than the industry average is an indication that it was effective in dealing with the environmental shocks that affected the entire industry.
Sensing opportunities: the advent of the digital and networking age.
At the beginning of Period 1 as SEC looked forward from 1998, they saw the approach of a “fundamental paradigm shift” with the advent of the digital and network age (SEC, 2008). Sensing that opportunity inspired SEC to make many changes that helped to launch them into the forefront of their industry. SEC continued to look to the future in 1999 to detect opportunities, as well as threats, as they identified the key challenge of what they called “digital convergence” which they defined as “a confluence of digital technologies that is…giving birth to a virtual tidal wave of never-before-seen products and services” (SEC, 1999). In November of 1999, SEC, sensing the growing opportunity, announced their vision of “leading the digital convergence revolution” and a year later, “recognizing the critical role that digital convergence and networking technology will play in [their] success” (SEC, 2000).
Making timely and market-oriented decisions: the advent of the digital and networking age.
In November of 1999, in response to their sensing the opportunities provided by the advent of the digital age, SEC announced their decision to launch their new master plan, the “Digital-E Company” by which they intended to make their vision of leading the digital revolution a reality. The purpose of launching their Digital-E Company was to “enhance value at every step of the supply-chain process” by “applying e-processes to streamline, accelerate, and create opportunities for synergy within the business process itself” (SEC, 2000). This has been an ongoing process that has included reorganizing their business
division and implementing digital processes to improve customer and supplier relationship management as well as internal communications.
Changing resource base: the advent of the digital and networking age.
After it announced the launching of the “Digital-E Company—a strategy that seeks to maximize both customer and corporate value through a comprehensive solution and process-centric approach to enhancing the value chain and optimizing the supply chain” (SEC, 2000), it changed its internal resource base by “putting in place an integrated, solution-focused organizational framework” in which its business divisions were each “assigned to one of four synergetic business portfolios: home networks, mobile networks, office networks, and core components,” the purpose of which was to “create a fertile internal climate for synergy and greater value” as the divisions ‘cooperate, share, and together create digital solutions far superior to anything they could achieve on their own” (SEC, 2000).This new organization was also intended to create a climate “for innovation that encourages convergence and
collaboration on the technical, product, and business levels” and involves the “transition from a division-centric development model that focuses on delivering stand-alone products to a portfolio-centric model that brings together multiple divisions and units to create integrated solutions” for the company’s four portfolios named above (SEC, 2001).
Sensing threats: falling memory prices.
In any business, maintaining a selling price for products that allows a firm to remain profitable is a necessity. When prices fall too low, profit margins are diminished and the future of the firm is threatened. In the first half of this decade, SEC noted several times in their annual reports that there was a potential threat to their business in terms of price. The first mention of this was in the 2001 annual report in which they mention a crash in memory
prices—due in part to the bursting of the dot com bubble—as a major challenge the company faced (SEC, 2001).
Making timely and market-oriented decisions: falling memory prices.
In 2001, after SEC cited that “stagnant markets and overcapacity triggered a sharp decline in memory prices that prompted many makers to sell below cost to maintain market share,” it met this threat to profitability by making the decision to improve their supply chain management (SEC, 2001).
Changing resource base: falling memory prices.
The changes to SEC’s supply chain management included “system-level integration with partners, suppliers, and customers” which allowed them to “better synchronize
production and sales” (SEC, 2001). SEC also implemented cost-cutting initiatives:
“We used open bidding, vendor negotiations, and global sourcing to cut materials costs by 3,600 billion Won, a remarkable 50% reduction over 2000. Process optimizations and a 23% rise in employee productivity at our Korean production facilities helped us save another 1,344.3 billion Won in manufacturing and assembly costs, a 55% year-on-year improvement. And since there are limits on how low materials prices can go, our cost-reduction strategy continues to become increasingly sophisticated and holistic, using methodologies like total cost management and value engineering in product development and materials cost management in production to keep our competitive edge as sharp as possible” (SEC, 2001).
Sensing threats: the Asian Financial Crisis.
For any firm to be successful, it must be able to gauge both its local economy and the global economy. When the Asian financial crisis occurred in 1997, SEC was like many other
Korean firms that were caught off guard. SEC, however, sensing the long-term threat brought on by the crisis, was able within one year to increase its gross sales by 8.8 percent and its annual dividends 2 percent from 1997 to 1998 (SEC, 1998).
Making timely and market-oriented decisions: the Asian Financial Crisis.
The Asian Financial Crisis of 1997 posed a formidable challenge to many companies, SEC included. SEC responded to this threat by making decisions to make big changes. According to the 1998 Annual Report, these decisions entailed “Rapid restructuring and innovations in the way we do business” (SEC, 1998).This restructuring was dubbed “select and focus” and included the decisions to drastically cut personnel and exit from or sell off business units (SEC, 1998).
Changing resource base: the Asian Financial Crisis.
When faced with the Asian Financial Crisis of 1997, SEC went through a major restructuring that they dubbed “select and focus,” which consisted of several major changes to SEC’s resource base (SEC, 1998). These included focusing resources on core business fields, and shedding businesses that they felt either were able to stand on their own or that were deemed “marginal” (SEC, 1998). They also made large cuts in personnel, reducing their “domestic and international workforces by 26 and 33 percent, respectively” while at the same time changing from the previous focus on external growth to a focus on “profitability,
financial soundness, and cash flow” (SEC, 1998). This allowed the company “to slash inventories and debt, dispose of non-performing assets, and cut expenses” (SEC, 1998).
5.1.2.2 Period 2: 2002-2005.
Period 2 corresponds to the years from the beginning of 2002 to the end of 2005. During this time SEC’s ROA rose from 10.56% in 2001 to 20.48% in 2002, then fell to 15.20% in 2003, and rose again to 24.62% in 2004. At the end of the period in 2005, ROA
again fell to 15.12%. SEC’s ROE followed a similar path, rising from 15.13% in 2001 to 29.01% in 2002, then falling to 20.26% in 2003, and rising to 31.32% in 2004. It ended the period falling again in 2005 to 19.27%. Unlike in Period 1, in which SEC’s changes followed the general trend of the industry average, in Period 2 SEC experienced more variation in Period 2. While the industry average sloped steadily upward from the end of 2001 to 2005, SEC’s profitability had peaks in 2002 and 2004, and low points in 2003 and 2005. The fact that SEC’s profitability remained higher than the industry average, even in its low points, is an indication that it was effective in dealing with the environmental shocks that affected the entire industry.
Sensing opportunities: premium product demand.
One opportunity that SEC sensed in Period 2 was the demand for premium products, which is evident in the statement “We drive competitiveness through bringing premium products to global markets” (SEC, 2003). In its statement that “[c]onvergence Samsung-style begins with figuring out what consumers want before they know they want it” (SEC, 2004), SEC clearly shows that it is in touch with both who its customers are and what they want. In 2003 SEC showed that they sensed the opportunity to meet the demand for premium products when it stated that their “success depends on a continual stream of stylish, innovative
products that deliver unexpected delight” (SEC, 2003).The demand for premium products was made clear when “[d]espite the unfavorable business environment, Samsung Electronics posted a second record-breaking year in a row” and the exceptional financial results “were driven by sales of premium products” (SEC, 2003).
Making timely and market-oriented decisions: premium product demand.
SEC’s decisions for dealing with competition have evolved as the company has grown and expanded into new areas. Initially, SEC made the decision to enter into low-end
consumer products (TVs and microwave ovens, for example) at the declining end of their product lifecycles. The decision to enter these particular markets was made to present the “least threatening profile to the industry leaders who were supplying the technology” (R. Kim, 2007). According to Kim (2007), “After acquiring technological competence and
competitiveness,” SEC made the decision to transform itself “from commodity product supplier of mass production for export market to supplier of brand name high-end products, supported by advanced in-house R&D.” In this way it began to diversity its product mix.
According to Lee, “Entering the 2000s, Samsung Electronics aimed at a ‘digital convergence’ strategy where it diversified product mix to provide full-range products from memory chips to high-end state-of-the-art consumer products” and it “would aim for convergence through continuous innovation in product lines” (J. Lee & Slater, 2007).
Changing resource base: premium product demand.
In order to support their decision to meet the demand for premium products, SEC diversified its product mix by adding new high-end state-of-the-art products to its portfolio. Some of the products include “high-value mobile handsets, flash memory chips used in digital cameras and MP3 players, and LCDs for notebook PCs, desktop monitors and televisions” (SEC, 2003). In 2005 SEC “achieved yet another milestone in the data storage industry by expanding the scope of high density NAND flash memory application to products such as MP3 players” and it saw further opportunities in the commercial launch of its new broad services such as DMB (Digital Multimedia Broadcasting) and WiBro (Wireless Broadband) in 2005 (SEC, 2005).
Sensing threats: rapidly changing competitive environment.
Some of the greatest threats facing a firm in a dynamic industry like that of SEC come from a firm’s competitors. In order to compete effectively, a firm must predict where the
industry is going, and how its competitors will respond to changes. It must then attempt to stay ahead of its competitors by reacting more quickly and effectively than they do. SEC has proven itself to be very good at doing just that in an industry characterized by rapid changes and uncertainty. In the 2002 annual report Jong-Yong Yun said, ““With continued
uncertainty, now a permanent feature in our lives, our Digital-E Company is more important than ever” referring to the firm’s strategy for addressing the digital and networking revolution (SEC, 2002), and in 2003 he reiterated that the rapidly changing environment is one of the firm’s biggest challenges (SEC, 2003). The following year he went on to say that there was “no room for complacency” because “every day competition grows tougher” as competitors vie for leadership and “up-and-coming manufacturers rapidly close the gap as they learn how to tap the power of the digital revolution” (SEC, 2004).
SEC also found itself in new territory as it moved from a follower playing catch up, to an industry leader. It could no longer sit back and watch the leaders to see what it had to do. As a new leader, SEC realized that it must define own path as opposed to being able to just follow the leaders (SEC, 2005).
Making timely and market-oriented decisions: rapidly changing competitive environment.
In response to the changing competitive environment, SEC decided to use its Digital-E company to increase value in its supply chain as well as by the setting of a goal to
“complement and encourage innovation [on cost] to increase market impact worldwide” (SEC, 2002). This has been accomplished in part by the implementation of an Enterprise Resource Planning (ERP) system, (SEC, 2002).
As part of the changing environment, price came up again in 2004 when, in the message from the CEO, Jong-Yong Yun pointed out that, “Margins in the semiconductor and LCD businesses—the key drivers behind our strong profitability in recent years—are under
pressure as supply outruns demand” (SEC, 2004). In the face of this threat, SEC responded by cutting costs by striving for “greater efficiency across the entire supply chain” (SEC, 2004).
Another way that SEC decided to respond to the rapidly changing environment was through innovation on products, technology, marketing, cost, global management, and organizational culture (SEC, 2003).
Changing resource base: rapidly changing competitive environment.
To meet its goal of bringing increased value to its supply chain, SEC changed its resource base to “use E-Processes connecting R&D, production, and marketing to customers and partners—a disciplined approach that brings value to every part of our supply chain,” which has been accomplished in part by the implementation of an Enterprise Resource Planning (ERP) system, (SEC, 2002) and supply chain management system (SEC, 2005).
In terms of changing its resource base to meet the challenges of a rapidly changing competitive environment through innovation, SEC introduced a “stream of stylish, innovative products,” made large investments in R&D “to develop and retain key technologies and core technological manpower,” invested in brand building, worked to control costs in “ways that complement and encourage innovation to increase market impact worldwide,” developed “highly localized product strategies to meet each market’s unique needs, while making changes to shorten and accelerate the decision making process worldwide,” and created “a work environment where communication is active and issues and inspirations are raised without hesitation, and where everyone shares the freedom to learn from mistakes and succeed” (SEC, 2003).
5.1.2.3 Period 3: 2006-2009.
Period 3 corresponds to the years from the beginning of 2006 to the end of 2009. This period shows a significantly different trend than the previous periods. Instead of moving up and down from year to year as in Period 2, the trend was generally downward, with a small recovery in 2009. During this time SEC’s ROA fell continuously from 15.12% in 2005 to 7.62% in 2008, experiencing a slight recovery in 2009 when it rose to 11.22%. SEC’s ROE followed a similar path, falling from 19.27% in 2005 to 9.51 in 2008, with a slight recovery to 14.44 in 2009.
This period is interesting in that, although SEC’s profitability remained higher than the industry average, even in its low points, neither its ROA nor ROE reached the mean level for the period 1998-2009. This difference is even more pronounced if measured against the period 1999-2009, in which the extremely low ROA and ROE of 1998 are excluded. If financial performance is the measure of dynamic capabilities, Period 3 could be an indicator that, although SEC is still ahead of the industry average, it may have reached the limits of its dynamic capabilities.
Sensing opportunities: brand building.
One way for a firm to grow is by building its brand equity. SEC is very conscious of this, as it has continuously made efforts to evolve from a maker of low-end home electronics and appliances to a premium brand of electronics and high-tech equipment. As stated in the 2006 annual report, SEC is working on its brand status in order to develop new market segments (SEC, 2006). It also senses other possibilities for building brand equity and name recognition by associating its brand name with such global sporting events as the World Cup and Olympic Winter Games (SEC, 2006). Although SEC has long been a branded company,
and has gained high brand status as a producer of consumer electronic products, in 2006 they saw an opportunity in the business to business (B2B) market as well (SEC, 2006).
Making timely and market-oriented decisions: brand building.
SEC has made a number of high-profile decisions to increase their brand equity, such as sponsoring sporting events like the World Cup and the Winter Olympic Games (SEC, 2006), as well as being the official wireless communications equipment partner of the Beijing 2008 Olympic and Paralympic games (SEC, 2008). Less obvious have been its other efforts, such as increasing its R&D and marketing efforts and emphasizing high-end branding (Chu, 2009). According to Chu (2009), it increased its R&D/sales ratio from 4% in 2000 to 7% in 2005. Like many other Asian companies, SEC’s early days in the electronics and
semiconductor industries was marked by their following the OEM model, but unlike many of its competitors, it has “made a conscious effort to switch away from the OEM mode after liberalization brought intense competitive pressure in the early 1990s” (Chu, 2009). The choice to make such an effort, informed by the perception that branding would help to differentiate it from its competitors, demonstrates SEC’s propensity to make timely and market-oriented decisions in terms of building brand equity. Its ranking 19th out of the best one hundred global brands by an Interbrand/Businessweek survey shows the success of SEC’s brand-building decisions (Businessweek, 2009).
Changing resource base: brand building.
SEC has and continues to devote substantial resources to building its brand equity, as is pointed out in the 2009 Annual Report:
“Throughout 2009, and into early 2010, we continued our sports marketing activities, including international sponsorships of such high-profile events as the Vancouver
2010 Winter Olympic Games. We also sponsored other world-renowned events, festivals and exhibitions, and promoted marketing collaborations and co-sponsorships as we broadened our marketing focus to unique cultural and emotional marketing activities. For example, we participated in cross-marketing campaigns with global luxury brands and created products in partnership with companies in diverse industries, thus elevating our premium image.” (SEC, 2009a).
Sensing opportunities: human resources.
With the desire to become a “true upper-echelon global leader” SEC sensed that to achieve its goals, it would have to do so by cultivating its human resources, especially in the area of R&D (SEC, 2006, 2007, 2008, 2009a; D. Teece, Pisano, Gary, 1994). It also senses the opportunity available in enhancing the human resources of its partners (SEC, 2006, 2007).
Making timely and market-oriented decisions: human resources.
In the interest of nurturing an effective human resource base, both for itself and for its partners, SEC has made the decision to provide extensive opportunities for training, including on-the-job training and rotational human resources development programs (SEC, 2006). In support of their decision to emphasize their human resources, they are “fostering a work atmosphere built on trust and harmony” (SEC, 2006).
Changing resource base: human resources.
SEC’s devotion of resources to human resources development is extensive, and takes many forms. From “providing a new cooperative education model linking schools and industry” and “expanded OJT programs for suppliers” that provide young people greater job opportunities, to forming a consortium of suppliers and universities in Korea to tailor human resources to supplier needs, to training in “GVE (Group Value Engineering), Six Sigma,
CAD planning, ERP education and support in the fields of manufacturing and quality control” for its partner firms, it is clear that SEC values human resources and devotes many resources to it (SEC, 2006, 2007).
Perhaps the most important aspect of human resources to SEC is its R&D workforce. In 2006, 26% of its workforce was engaged in R&D, and in 2007 the number of R&D engineers reached 39,000 (including 3200 PhDs) (SEC, 2007). By 2008, the number of SEC’s employees engaged in R&D activities had reached 40% of its entire workforce (SEC, 2008). This dedication of human resources to R&D has resulted in SEC being ranked number 2 (after IBM) in the number of U.S. patents granted for the years 2007-2009 ("Intellectual Property Owner's Association," 2009).
Sensing threats: the global economy.
In 2006, SEC perceived numerous economic threats, from the appreciating Won to a number of external and internal factors that had a destabilizing effect on the Korean economy, as well as the slowdown in the U.S. and world economies (SEC, 2006). In the following year, SEC sensed the deepening of this slowdown, which was exacerbated by the subprime
mortgage crisis and rising oil prices (SEC, 2007). In 2008 SEC began to refer to this
slowdown as a global economic downturn, characterized by further rising oil prices that lead to inflation, volatile exchange rates, and falling asset values that affected real income (SEC, 2008).
Making timely and market-oriented decisions: the global economy.
In light of the increasing global economic slowdown, SEC made a number of decisions to ameliorate its effects on its stakeholders. One decision was to focus on its core competencies (SEC, 2006). Another was to maintain and build shareholder value.
As part of its focus on core competencies of technology, human resources (particulary as pertains to R&D), and brand image, SEC responded with “the ultimate cost
competitiveness and management innovations aimed at enhancing speed and efficiency” (SEC, 2006). This included the decisions to “secure creative leadership in technologies, markets, and products in order to maintain … growth momentum” (SEC, 2006). When the global economic slowdown deepened, SEC decided to continue these efforts (SEC, 2008). In terms of building shareholder value, in 2007 SEC decided to pay out dividends to shareholders and to buy back about KRW2 trillion of company stock (SEC, 2007). SEC also decided to make an effort to help shareholders “better understand the core competencies of each business division” (SEC, 2007). In 2008, despite the volatility in financial markets, decided to work to improve their stock valuation.
Changing resource base: the global economy.
In response to the global economic slowdown, SEC focused on its core competencies by streamlining its price structure, adopting highly efficient work processes, and by building a superior supply chain management system (SEC, 2006). When the global economic
slowdown deepened, SEC made the decisions to invest in strengthening its R&D capacity by investing 9.5% of parent company sales, deepening its human resource base by increasing its researchers to 42,100, and building its brand image (SEC, 2008).
SEC changed its resource base in order to increase shareholder value by paying out a dividend of KRW8,000 per share as well as buying back a substantial amount of company stock (SEC, 2007). They followed up their decision to help shareholders understand the core competencies by holding their third Analyst Day (SEC, 2007). In 2008, SEC “actively worked to build shareholder value” by “pushing ahead with investor relations initiatives to improve our stock valuation” (SEC, 2008). As a result of these efforts, their stock value
declined only 19% as compared to the majority of technology stocks and global bourses that lost more than half their value (SEC, 2008).
5.2 The Case of Taiwan Semiconductor Manufacturing Corporation 5.2.1 TSMC overview.
The history of Taiwan Semiconductor Manufacturing Company (TSMC) can be traced to the early 1970s when the world economy entered a recession and many of Taiwan’s major export products, such as textiles and footwear, began to suffer both from increased competition from less developed countries and from neo-protectionist policies of advanced countries (Jung, 2008). In the face of these difficulties, Taiwan’s leadership looked to a policy of industrial upgrading, and the semiconductor industry was one area they targeted. However, because of the predominance of small and medium sized enterprises (SMEs) in Taiwan, and the short product lifecycle and large investments necessary to develop
manufacturing facilities, it was difficult for firms to overcome the high entry barriers in the semiconductor industry. This was where the establishment of the Industrial Technology Research Institute (ITRI) came in. “A new phase in Taiwan’s industrial development was opened in 1973 with the establishment of ITRI to promote technological leverage and the Development Fund to promote financial or capital leverage” (Mathews, 1997). The history of ITRI itself is quite interesting, but for the purposes of this paper we will limit the
discussion of it to stating that through it and its offshoot the Electronic Research Service Organization (ERSO), which provided technology transfer and R&D support, TSMC was founded as a joint venture with the Dutch multinational Philips (Mathews, 1997), private investors, and the Taiwan government.
TSMC was unique in that it was the first company to use the “pure-play” foundry model, in which the company provides semiconductor fabrication services for other
companies and does not offer a significant amount of IC products of its own design. This model made it possible for TSMC to focus on production capacity that it could tailor to its customer needs, and at the same time avoid competing directly with its own customers. After its establishment in 1987, TSMC quickly grew into the world’s largest dedicated
semiconductor foundry. By 2002, TSMC had become the first semiconductor foundry to enter the ranks of the top 10 IC companies in terms of worldwide sales, and by 2007 it was ranked number sixth. In 2007 the company's manufacturing capacity exceeded 8 million 8-inch equivalent wafers, and from 2005 to 2008 TSMC’s sales accounted for about half of the entire pure-play foundry market (TSMC, 2010).
It is the assertion of this paper that the success of TSMC is due to its dynamic capabilities, which according to our definition is its “potential to systematically solve problems, formed by its propensity to sense opportunities and threats, to make timely and market-oriented decisions, and to change its resource base” (Barreto, 2010).
5.2.2 TSMC dynamic capabilities by period.
In order to examine TSMC’s dynamic capabilities, the period from 1998 to 2009 has been divided into three sections. The division between periods corresponds with a relatively low point in TSMC’s profitability as measured by its ROA (fig. 1) and ROE (fig. 2). These low points, 2001 and 2005, both coincided with global economic shocks, environmental disasters, and political upheaval. As the definition of dynamic capabilities states that dynamically capable firms have the ability to systematically solve problems, TSMC’s response to the events that caused the downturns in their profitability will be examined in terms of their ability to sense opportunities and threats in these events, to make timely and market-oriented decisions, and to change its resource base in order to restore its level of profitability.
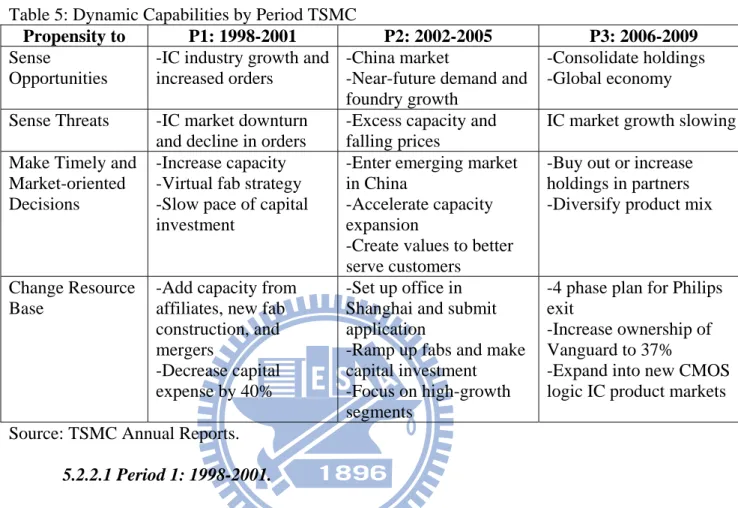
Table 5 gives a brief summary of TSMC’s use of its dynamic capabilities for each of the three periods (P1, P2, and P3).
Table 5: Dynamic Capabilities by Period TSMC
Propensity to P1: 1998-2001 P2: 2002-2005 P3: 2006-2009
Sense
Opportunities
-IC industry growth and increased orders
-China market
-Near-future demand and foundry growth
-Consolidate holdings -Global economy Sense Threats -IC market downturn
and decline in orders
-Excess capacity and falling prices
IC market growth slowing Make Timely and
Market-oriented Decisions
-Increase capacity -Virtual fab strategy -Slow pace of capital investment
-Enter emerging market in China
-Accelerate capacity expansion
-Create values to better serve customers
-Buy out or increase holdings in partners -Diversify product mix
Change Resource Base
-Add capacity from affiliates, new fab construction, and mergers
-Decrease capital expense by 40%
-Set up office in Shanghai and submit application
-Ramp up fabs and make capital investment -Focus on high-growth segments
-4 phase plan for Philips exit
-Increase ownership of Vanguard to 37%
-Expand into new CMOS logic IC product markets Source: TSMC Annual Reports.
5.2.2.1 Period 1: 1998-2001.
Period 1 ranges from 1998 to the end of 2001, ROA and ROE increased for two years and then decreased at the end of the period. ROA went from 12.36% in 1998 to 19.09% in 2000, and then dropped to 4.31% in 2001. ROE rose from 18.25% in 1998 to 24.87% in 2000, and then dropped to 5.22% in 2001. As was the case for SEC, these changes followed the general trend of, but were significantly higher than, the industry average. The fact that SEC’s profitability remained higher than the industry average is an indication that it was effective in dealing with the environmental shocks that affected the entire industry.
Sensing opportunities: IC industry growth and increased orders.
In 1999, TSMC sensed that, “[a]fter a slow period in the IC industry, customer orders took a strong upward turn in the second quarter of 1999” (TSMC, 1999). Similarly in 2000
TSMC anticipated a “steady long-term growth of the IC industry” and a “strong immediate demand from key customers (TSMC, 2000).
Making timely and market-oriented decisions: IC industry growth and increased orders.
The decision to create a new type of semiconductor firm, the “pure-play” foundry was based on the idea of fulfilling the demand for semiconductor chips without competing with customers. As part of this creation of a new niche in the industry, TSMC decided to embark upon its “Virtual Fab” strategy “to provide customers with the benefits of an in-house fabrication plant without the associated expense or organizational complexities” (TSMC, 1998). By deciding to serve as a link between upstream chip designers and downstream users, TSMC has managed to build networks of customers and suppliers (C. W. Lee, Hayter, & Edgington, 2008), and its success has become “a model for many new entrants to the market” (TSMC, 1999). When TSMC sensed the opportunity of increased customer orders in 1999 and 2000, it made the decision to increase capacity to meet the growing demand (TSMC, 1999, 2000).
Changing resource base: IC industry growth and increased orders.
TSMC used these resources to create a new niche in the industry, its Virtual Fab, “to provide customers with the benefits of an in-house fabrication plant without the associated expense or organizational complexities” (TSMC, 1998).
After TSMC made the decision to increase capacity to meet the growing demand in 1999 and 2000, it did so by increasing the capacity from its existing fabs 4, 5, and 6, as well as adding capacity from affiliates, new fab construction, mergers, and joint ventures (TSMC, 1999, 2000). Increased capacity from its affiliates came from WaferTech, Vanguard
International Semiconductor Corporation, and TSMC-Acer Semiconductor Manufacturing
Corporation (TASMC) and mergers and joint ventures included Philips in Singapore, TASMC, and Worldwide Semiconductor Manufacturing Corporation (TSMC, 1999). They also merged with TSMC-ACER (TSMC, 2000). New fab capacity was accomplished when TSMC “expanded advanced manufacturing capacity aggressively at nine internal or affiliated 8-inch fabs” and “continued the construction of two of the industry's first production scale 12-inch facilities” (TSMC, 2000).
Sensing threats: IC market downturn and decline in orders.
In 2001 TSMC sensed a threat from the market in the form of an industry downturn and a decline in orders (TSMC, 2001). This took the form of a 30% contraction in the global IC market (TSMC, 2001).
Making timely and market-oriented decisions: IC market downturn and decline in orders.
When in 2001 TSMC sensed a threat from the market in the form of an industry downturn and a decline in orders, the decision was made to slow the pace of capital investment (TSMC, 2001).
Changing resource base: IC market downturn and decline in orders.
When in 2001 TSMC made the decision was made to slow the pace of capital investment in the face of an IC market downturn and decline in orders, it did so by a
significant amount. As a result, “capital expense for 2001 totaled US$2.2 billion, a decrease of 40 percent from previous capital expense in 2000” (TSMC, 2001). After this decrease, TSMC stated that most of the remaining capital expense went to “increasing the capacity of our 0.18um, 0.15um and 0.13um processes” (TSMC, 2001).
5.2.2.2 Period 2: 2002-2005.
Period 2 corresponds to the years from the beginning of 2002 to the end of 2005. During this time TSMC’s ROA rose steadily from the low point of 4.31% in 2001 to 18.93% in 2004, then fell off slightly in 2005 to 18.44%. TSMC’s ROE followed a similar path, rising steadily from 5.22% in 2001 to 23.14% in 2004, and then falling off slightly to 21% in 2005. Unlike SEC, TSMC’s measures did not drop in 2003, but instead followed the general curve of the industry average for the first three years, and only fell of slightly in the last year. Throughout the period, TSMC’s ROA and ROE exceeded the industry average.
Sensing opportunities: China market.
Another opportunity that TSMC has sensed is the opening of the semiconductor industry in China. As early as 2001 TSMC saw the potential for expansion in this new and fast-growing market market. In order to achieve a competitive position in this, TSMC took steps to take advantage of this opportunity (TSMC, 2001).
Making timely and market-oriented decisions: China market.
TSMC decided that it would “become to become a key participant in the Mainland China domestic semiconductor market” (TSMC, 2002, 2003).TSMC made the decision to begin a series of steps, that eventually led to the establishment of TSMC (Shanghai) Company Limited in China (TSMC, 2003).
Changing resource base: China market.
When TSMC decide to enter the emerging semiconductor market in China, it began by allocating resources to set up an office in Shanghai (TSMC, 2001). It followed up on this in 2002 by submitting an application to the Taiwan government to invest in a semiconductor fabrication plant in China (TSMC, 2002), and then in 2003 it established TSMC (Shanghai)
Company Limited in China (TSMC, 2003). It equipped the plant with used tools and machinery relocated from TSMC's Taiwan fabs. As of December 31, 2004, TSMC had invested a total of US$276 million in TSMC (Shanghai) (TSMC, 2004).
Sensing opportunities: near-future demand and foundry growth.
In 2003 and 2004, TSMC also sensed strong near-future demand and foundry growth, and in 2005 estimated that up to 30% of global semiconductor revenue would come from dedicated foundries (TSMC, 2003, 2004, 2005).
Making timely and market-oriented decisions: near-future demand and foundry growth.
In 2003, sensing growing near-future demand, TSMC further decided to accelerate its capacity expansion (TSMC, 2003), and continued to do so in 2004 when it saw the potential for future foundry growth (TSMC, 2004), and again when it predicted that up to 30% of global semiconductor revenue would come from dedicated foundries in 2005 (TSMC, 2005).
Changing resource base: near-future demand and foundry growth.
TSMC followed up its decision to expand capacity by ramping up fab 12, and by bringing fabs 10 and 14 into production by 4th quarter of 2004 (TSMC, 2003), as well as expanding capacity at fab 14 (TSMC, 2004). To achieve this capacity expansion made a capital investment of approximately US $2.6-2.8 billion (TSMC, 2005).
Sensing threats: excess capacity and falling prices.
In 2004 and 2005, TSMC sensed the twin threats of excess capacity and falling prices (TSMC, 2004, 2005),