Analysis of triazines by reversed electroosmotic flow capillary
electrophoresis–electrospray mass spectrometry
*
Cheng-Yuan Tsai, Yet-Ran Chen, Guor-Rong Her
Department of Chemistry, National Taiwan University, Taipei, Taiwan
Received 5 January 1998; received in revised form 28 April 1998; accepted 28 April 1998
Abstract
Normal and reversed electroosmotic flow (EOF) capillary electrophoresis (CE) has been studied for the analysis of eight triazine herbicides. Reversed EOF CE, dynamically modified with cetyltrimethylammonium bromide (CTAB), provided better separation than normal CE. All eight triazines were baseline resolved with the use of 50 mM ammonium acetate and 0.7 mM CTAB as the running buffer. The method of sheath liquid was used in the on-line coupling of CE with electrospray mass spectrometry. The composition of sheath liquid was found to be critical in the coupling of reversed EOF CE with MS. The resolution obtained in CE–UV can be preserved in CE–MS if the composition of the sheath liquid is similar to the running buffer. 1998 Elsevier Science B.V. All rights reserved.
Keywords: Electroosmotic flow; Triazines; Pesticides
1. Introduction liquid chromatography (HPLC) [2,3], gas
chroma-tography (GC) [4], ion chromachroma-tography (IC) [5], Triazine derivatives are among the most important thin-layer chromatography (TLC) [6], gas chroma-selective herbicides. Triazine herbicides are usually tography–mass spectrometry (GC–MS) [7–9], and applied as pre and post-emergent weed control to liquid chromatography–mass spectrometry (LC– improve the quality of agricultural products. These MS) [10,11] have been used for the analysis of herbicides are 1,3,5-triazine substituted at the 2, 4 triazines. Recently, mainly because of its superior and 6 positions. The substituent at the 2 position separation efficiency, several groups have explored gives each triazine its specific selectivity. The 4 and the potentials of capillary zone electrophoresis 6 positions are substituted with different aminoalkyl (CZE) [1,12] and micellar electrokinetic
chromatog-groups. raphy (MEKC) [13–20] for analysis of triazines.
Due to their wide use and relatively high resist- MS is compatible with capillary electrophoresis ance, knowledge of triazines in the environment, (CE) with respect to the sample amount and is one of both qualitatively and quantitatively, is of great the most powerful detection methods for identifica-importance to environmental and water control [1]. tion of separated analytes. Among the ionization Analytical techniques including high-performance techniques, electrospray ionization (ESI) is often considered the most suitable technique for on-line *Corresponding author. Fax: 1886-2-23638058; e-mail: coupling of CE with MS. MEKC often provides [email protected] better resolution than CZE in the analysis of triazine 0021-9673 / 98 / $19.00 1998 Elsevier Science B.V. All rights reserved.
380 C.-Y. Tsai et al. / J. Chromatogr. A 813 (1998) 379 –386
herbicides [15], the combination of MEKC with CE interface was used for this study. The interface ESI-MS is, however, generally considered difficult utilizes a triaxial flow arrangement whereby the CE because of the use of high concentration surfactants elute is mixed with a suitable sheath liquid at the in the running buffer. Recently, Lee et al. reported probe tip and then nebulized using N gas. The high2
the use of partial filled MEKC–ESI-MS for the voltage applied on the buffer reservoir was 120 kV analysis of four triazines [19]. In this paper, we and 220 kV in normal and reversed EOF CE–MS, report the results of using reversed electroosmotic with the 3.5-kV ESI voltage applied on the outlet of flow (EOF) CE–UV and reversed EOF CE–ESI-MS the separation column. The potential difference for the analysis of eight triazines. during the analysis of triazines was about 16.5 kV and 23.5 kV for normal and reversed EOF CE, respectively. For electrical contact at the tip of the 2. Experimental interface, a sheath liquid was delivered at a flow-rate of 10 ml / min by a Model H-74900-00 syringe pump
2.1. Chemicals (Cole-Parmer, Niles, IL, USA). In order to obtain
maximum sensitivity, the silica tip was protruded 0.2 Methanol, ethanol, 2-propanol, ammonium acetate, mm outside the stainless steel needle. The mass acetic acid, and trifluoroacetic acid were of chro- spectrometer was operated in the positive-ion mode matographic grade from J.T. Baker (Phillipsburg, NJ, and the data were collected at selected-ion moni-USA). Triazine standards were obtained from toring mode (0.2 s dwell time, 0.2 mass unit span). Supelco (Bellefonte, PA, USA). A stock standard
solution of triazine mixture was prepared in
metha-nol and stored in a refrigerator. Deionized (18 MV) 3. Results and discussion water (Milli-Q water system, Millipore, Bedford,
MA, USA) was used in the preparation of the 3.1. CE–UV analysis of triazines samples and buffer solution.
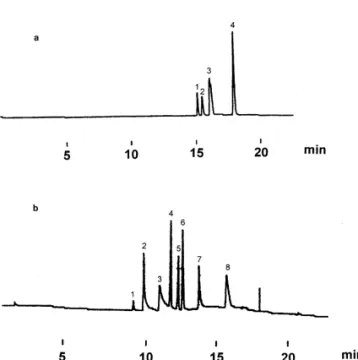
Cetyltrimethylammo-nium bromide (CTAB) was purchased from Sigma Eight triazines, differing minimally in structure (St. Louis, MO, USA). and properties, were studied by CE. The structures of these chlorotriazines, thiomethyltriazines and 2.2. Capillary electrophoresis methoxytriazine are shown in Fig. 1. Various buffer systems were tested in the normal EOF CE study. The CE apparatus was constructed in the labora- The best result was obtained with 50 mM ammonium tory and had been described elsewhere [21–23]. The acetate at pH 4.5 as the running buffer (Fig. 2a). fused-silica capillary columns (Polymicro Tech- Only four peaks were observed. Co-injection of nologies, Phoenix, AZ, USA) were 80 cm (70 cm to triazine standards suggested the elution order of detector)350 mm I.D.3375 mm O.D. A small area of prometon, terbutryne, ametryn / prometryn / simetryn, the polyimide coating was burned off to form a and simazine / atrazine / propazine, respectively. The window for UV detection. On-column detection was third and fourth peaks were broader than others performed on an UV detector (UV-C, Rainin, indicating partial separation of the coeluted triazines. Emeryville, CA, USA) operated at 230 nm. Before The separation efficiency increased somewhat with use the capillary columns are washed with 0.1 M the addition of g-cyclodextrin into the buffer system. NaOH and water followed by running buffer. The Unfortunately, the eight triazines were still not capillary was then equilibrated with running buffer baseline resolved (data not shown).
for 20 min. Control of the electroosmotic mobility is very
important for improving the separation and short-2.3. Mass spectrometry ening the analysis time in CE. The rate of EOF may be altered by varying the composition of the em-A VG platform single quadrupole mass spectrome- ployed buffer system. The addition of cationic ter (Micromass, Altrincham, UK) equipped with a surfactants in background electrolyte has a large
Fig. 2. Electropherogram of triazines by normal CE. An 80 cm350 mm I.D. fused-silica capillary tubing was used with 50 Fig. 1. Structures of triazines. Et5Ethyl; i-Pr5isopropyl; t-Bu5 mM ammonium acetate at pH 4.5 as the running buffer. The tert.-butyl. potential was 120 kV and the detection wavelength was 230 nm. Sample (50 mg / ml) was injected electrokinetically at 10 kV for 10 s. Peaks were assigned as (1) prometon; (2) terbutryne; (3) prometryn, ametryn, simetryn; (4) propazine, atrazine, simazine. effect on electroosmotic mobility. On increasing the
(b) Electropherogram of eight triazines by reversed EOF CE. An concentration of cationic surfactant, the electro- 80 cm350 mm I.D. fused-silica capillary tubing was used with 50 osmotic mobility decreases finally to the point that mM ammonium acetate containing 0.7 mM CTAB at pH 3.85 as the direction of the EOF is reversed [24]. Terabe et the running buffer. The potential was 220 kV and the detection wavelength was 230 nm. Sample (50 mg / ml) was injected al. [25] first reported the use of CTAB to modify the
electrokinetically at 10 kV for 10 s. Peaks were assigned as (1) EOF. The CTAB surfactant formed a positively
simazine; (2) atrazine; (3) propazine; (4) simetryn; (5) ametryn; charged layer on the inner wall of the capillary and (6) prometon; (7) prometryn; (8) terbutryne.
induced the reversal of EOF. Since then, this dy-namic coating method has been applied to the
separation of vitamins [26], DNA [27], and phenol CTAB surfactants through hydrophobic interaction
[28]. possibly contributes to the significant enhancement
The reversed EOF technique was adopted for the in separation resolution obtained with reversed EOF analysis of triazines and the resolution was found to CZE.
be much better than normal CE. The electropherog-ram obtained with a concentration of 50 mM
am-monium acetate and 0.7 mM CTAB at pH 3.85 is 4. CE–MS analysis of triazines shown in Fig. 2b. All eight triazines were baseline
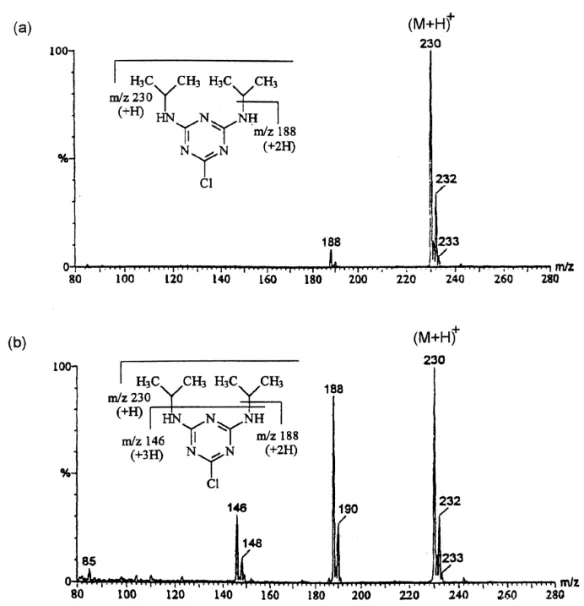
resolved. Because the direction of EOF is changed, Triazines can be easily detected by positive ESI. the elution order of triazines is in general reverse to The mass spectra are characterized with protonated that of normal CE. By comparing the Fig. 2a and b, molecular ion with little fragmentation. More struc-migration times of triazines in normal and reversed tural information can be obtained if the spectra are CE are slightly different. However, the migration acquired under in source collision-induced dissocia-window of the reversed EOF CE is significantly tion (CID) [29–31]. Typical ESI and in source CID larger than the normal CE. Besides the change in the mass spectra of triazines are shown in Fig. 3. direction of EOF, the partition of triazines with In the coupling of CE with ESI-MS, the selection
382 C.-Y. Tsai et al. / J. Chromatogr. A 813 (1998) 379 –386
Fig. 3. Positive ESI (a) and in source CID (b) mass spectra of propazine.
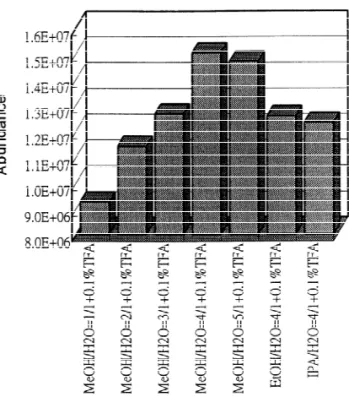
of the buffer system should consider not only the CE The results showed that the sensitivity decreased as resolution but also the compatibility of the buffer buffer concentration increased. Although lower buf-with ESI. In normal CE–ESI-MS analysis, ammo- fer solution concentration provided better sensitivity, nium acetate proved to be an appropriate buffer the CE resolution dropped significantly. This result regarding the separation of triazines as well as the suggested that the higher ionic strength was good for sensitivity and stability of ESI-MS. However, high separation resolution but not for sensitivity. To concentration of buffer might compete with the maintain the CE resolution and also keep appropriate analytes in ESI process [32,33] and resulting in poor sensitivity, 50 mM ammonium acetate was used sensitivity. Sensitivity and ion current stability under throughout the normal CE–MS study.
positive ESI condition were studied under different Sheath liquid was passed between the separation buffer concentrations. In the experiment, a 5 mg / ml and the stainless capillary column and then mixed atrazines solution was electroosmotically infused with the running buffer at the tip of the probe. To through the silica capillary and then mixed with achieve optimum sensitivity, the separation column sheath liquid (10 ml / min) at the tip of the CE probe. was extended about 0.2 mm beyond the tip of the
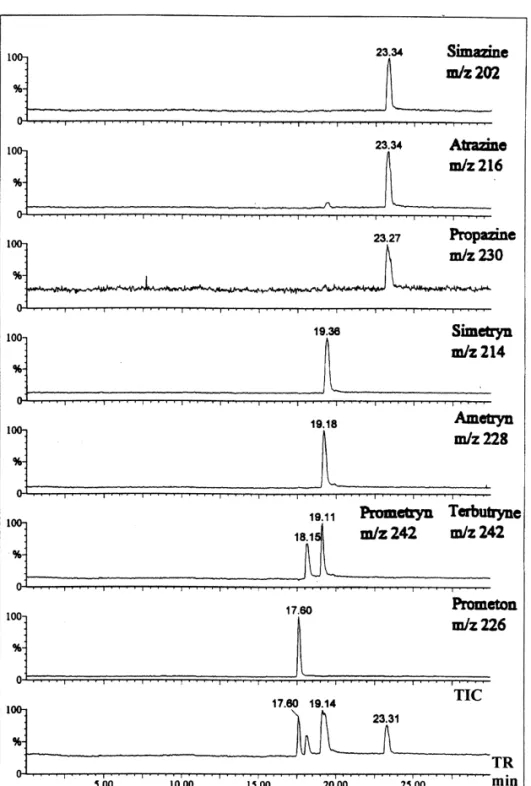
stainless capillary column. If the silica tubing pro- found to be prometryn (19.11 min), ametryn (19.18 truded too far to make a good electrical contact, the min), and simetryn (19.36 min) for the third peak sensitivity dropped dramatically. and propazine (23.27 min), atrazine / simazine (23.34 The composition of sheath liquid was found to min.) for the fourth peak. Another advantage of affect ESI sensitivity. A solution of methanol–water using MS detection is that there is no overlap in the (80:20) containing 0.1% trifluoroacetic acid (TFA) mass electropherograms making the quantitative provided the best sensitivity (Fig. 4). The addition of analysis more reliable.
trifluoroacetic acid in sheath liquid provided an Although the uncertainty in triazine identification acidic environment for high-sensitivity detection of in normal EOF CE was reduced significantly by triazine molecules. Under the optimal conditions, the using the mass spectrometer as the detector, the on-line CZE–ESI-MS analysis of eight triazines is quality of identification could be further improved if
1
shown in Fig. 5. The [M1H] ion of each com- triazines were analyzed by reversed EOF CE–ESI-pound was selected for real-time monitoring. As MS. Under this condition, triazines are differentiated expected from CE–UV study (Fig. 2a), only four both in retention time and in molecular mass. peaks were observed in the total-ion current elec- Initially, the sheath liquid used in normal CE (metha-tropherogram and the third and fourth peaks were nol–water, 80:20) containing 0.1% TFA) was broader than the first two peaks. The elution order of adopted for reversed EOF CE–ESI-MS approach. the triazines in the third and fourth peak could not be Unfortunately, the resolution was much poorer than assigned because of the poor time resolution (Fig. the one obtained with UV detection. Similar phe-2a). By using the mass spectrometer as the detector, nomenon was observed in CE–UV if the buffer the migration orders of these triazines could be solution in the anode was replaced with sheath determined easily (Fig. 5). The elution order was liquid. The result of this CE–UV experiment sug-gested that the sheath liquid played an important role for the degradation of CE resolution. Because the pH of the sheath liquid is lower than the running buffer for better ionization efficiency, the poor CE–MS resolution is more likely due to the migration of proton from sheath liquid into the separation column. The effect of sheath liquid on the formation of the moving ionic boundary has been reported by Karger [34]. The quality of the electropherogram improved significantly when TFA was replaced with ammo-nium acetate in the sheath liquid. The SIM elec-tropherogram obtained with 90% methanol–water (80:20) and 10% 50 mM ammonium acetate buffer, pH 3.85 as the sheath liquid is shown in Fig. 6. Triazines were identified by their retention time and molecular mass. One disadvantage of the reversed EOF CE–MS approach is that the sensitivity is poorer than normal CE–MS because of the limitation of using sheath liquid of higher pH.
5. Conclusion Fig. 4. Ion abundance as a function of ESI sheath liquid
Normal EOF CE was not able to resolve the eight composition. The atrazine (5 mg / l) was electroosmotically
384 C.-Y. Tsai et al. / J. Chromatogr. A 813 (1998) 379 –386
Fig. 5. Selected-ion electropherograms of triazines by normal EOF CE–MS. Sheath liquid composition was methanol–water (80:20) containing 0.1% TFA. Other conditions were the same as in Fig. 2a. TR5Migration time.
CTAB surfactant in the buffer induces the reverse of excellent analytical tool for the separation and EOF and enables the separation of all eight triazines. identification of triazines. Although baseline res-The on-line coupling of CE and MS provided an olution was not obtained with normal CE, the use of
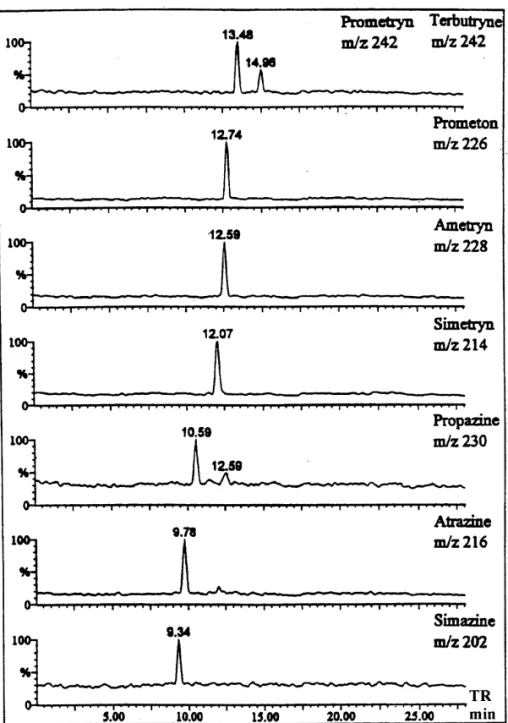
Fig. 6. Selected-ion electropherograms of eight triazines by reversed EOF CE–MS. Sheath liquid composition was 90% methanol–water (80:20) 110% 50 mM ammonium acetate at pH 3.85. Other conditions were the same as in Fig. 2b. The additional peak at 12.59 min with m /z 230 was the M12 isotope peak (S atom) of ametryn.
ESI-MS as the on-line detection method significantly molecular mass. The composition of sheath liquid is improved the quality of compound identification. more critical in reverse EOF CE–MS than in normal Reversed EOF CE–MS provided a better result than EOF CE–MS. The limitation(s) of using sheath normal EOF CE–MS. Under these conditions, tri- liquid with similar pH and / or composition as run-azines were identified both in retention time and in ning buffer is under investigation. It is hoped that a
386 C.-Y. Tsai et al. / J. Chromatogr. A 813 (1998) 379 –386
[15] R. Carabias Martinez, E. Rodriguez Gonzalo, A.I. Munoz solution can be found so that resolution and
sensitivi-Dominguez, J. Dominguez Alvarez, J. Hernandez Mendez, J. ty can be achieved simultaneously.
Chromatogr. A 733 (1996) 349–360.
[16] A. Farran, S. Ruiz, C. Serra, M. Aguilar, J. Chromatogr. A 737 (1996) 109–116.
Acknowledgements [17] W.M. Nelson, C.S. Lee, Anal. Chem. 68 (1996) 3265–3269. [18] Ph. Schmitt, D. Freitag, I. Trapp, A.W. Garrison, M.
Schiavon, A. Kettrup, Chemosphere 35 (1997) 55–75. This work was supported by the National Research
[19] M. Nelson, Q. Tang, A. Harrata, C.S. Lee, J. Chromatogr. A
Council of Taiwan. 749 (1996) 219–226.
[20] L. Yang, A.K. Harrata, C.S. Lee, Anal. Chem. 69 (1997) 1820–1826.
[21] M.A. Mosely, L.J. Deterding, K.B. Tomer, J.W. Jorgenson, References
Rapid Commun. Mass. 3 (1989) 87.
[22] M.A. Mosely, L.J. Deterding, K.B. Tomer, J.W. Jorgenson, J. [1] F. Foret, V. Sustaek, P. Bocek, Electrophoresis 11 (1990) 95. Chromatogr. 516 (1990) 167.
[2] G. Karlaganis, R.V. Arx, H.U. Ammon, R. Camenzzind, J. [23] C.Y. Tsai, G.R. Her, J. Chromatogr. A 743 (1996) 315. Chromatogr. 549 (1991) 229. [24] T. Kaneta, S. Tanaka, M. Taga, J. Chromatogr. A 653 (1993) [3] G. Acchero, S. Apone, C. Sarzanini, F. Mentasti, J. Chroma- 313.
togr. A 668 (1994) 365. [25] S. Terabe, K. Ishikawa, K. Utsuka, A. Tsuchiya, T. Ando, [4] J.C. Molto, Y. Pico, G. Font, J. Manes, J. Chromatogr. 555 Proceedings of the 26th International Liquid
Chromatog-(1991) 137. raphy Symposium, Kyoto, 25–26 January, 1983.
[5] G. Sacchero, C. Sarzanini, F. Mentasti, J. Chromatogr. A 671 [26] B.B. VanOrman, G.L. McIntire, J. Microcolumn Sep. 1
(1994) 151. (1989) 289.
[6] J. Sheran, J. Liq. Chromatogr. 9 (1986) 3433. [27] T.J. Kasper, M. Melera, P. Gozel, R.G. Brownlee, J. Chroma-[7] V. Lopez-Avila, P. Hirata, S. Kraska, M. Fiangagan Jr., J.H. togr. 458 (1988) 303.
Taylor, S.C. Hern, Anal. Chem. 57 (1985) 2707. [28] S.M. Masselter, A.J. Zemann, Anal. Chem. 67 (1995) 1047. [8] S.A. Schaette, R.G. Smith, L.R. Holden, J.A. Grahan, Anal. [29] J.A. Loo, H.R. Udseth, R.D. Smith, Rapid Commun. Mass
Chim. Acta 236 (1990) 141. Spectrom. 2 (1988) 207.
[9] Z. Cai, V.M.S. Ramannjam, D.E. Giblin, M.L. Gross, Anal. [30] R.D. Smith, J.A. Loo, C.J. Barinaga, Rapid Commun. Mass
Chem. 65 (1993) 21. Spectrom. 4 (1990) 54.
[10] I. Hammond, K. Mooro, H. James, C. Watters, J. Chroma- [31] R.D. Smith, J.A. Loo, C.J. Barinaga, C.G. Edmonds, H.R. togr. 474 (1989) 175. Udseth, J. Am. Soc. Mass Spectrom. 1 (1990) 53. [11] H. Persen, L. Zupancic-Krali, J. Marsel, J. Chromatogr. A [32] E.D. Lee, W. Muck, J.D. Henion, T.R. Covery, Biomed.
704 (1995) 121. Environ. Mass Spectrom. 18 (1989) 144.
[12] P. Schmitt, A.W. Garrison, D. Freitag, A. Kettrup, J. Chroma- [33] A.P. Bruins, T.R. Covery, J.D. Henion, Anal. Chem. 59
togr. A 723 (1996) 169. (1987) 2642.
[13] C. Desiderio, S. Fanali, Electrophoresis 13 (1993) 698. [34] F. Foret, T.J. Thompson, P. Vouros, B.L. Karger, P. Gebauer, [14] G. Dinelli, A. Bonetti, P. Catizone, G.C. Galletti, J. Chroma- P. Bocek, Anal. Chem. 66 (1994) 4550.