Predicting Flavin- and Nicotinamide Adenine
Dinucleotide–Binding Sites in Proteins Using the
Fragment Transformation Method
Chih-Hao Lu1 ,2, *, , Chin-Sheng Yu§ 3 *, Yu-Feng Lin,4, 5 , Jin-Yi Chen1
1
Graduate Institute of Molecular Systems Biomedicine, China Medical University, Taichung, Taiwan
2
Graduate Institute of Basic Medical Science, China Medical University, Taichung, Taiwan
3
Department of Information Engineering and Computer Science, Feng Chia University, Taichung, Taiwan
4
Master’s Program in Biomedical Informatics and Biomedical Engineering, Feng Chia University, Taichung, Taiwan
5
Institute of Bioinformatics and Systems Biology, National Chiao Tung University, Hsinchu, Taiwan
*These authors contributed equally to this work §
Corresponding author
Email addresses: [email protected]
1 2 3 4 5 6 7 8 9 10 11 12 13 14 15 16 17 18 19 20
Predicting Flavin- and Nicotinamide Adenine
Dinucleotide–Binding Sites in Proteins Using the
Fragment Transformation Method
Yu-Feng Lin1,‡, Chin-Sheng Yu2,3,‡, Jin-Yi Chen4, Jenn-Kang Hwang1, Chih-Hao Lu4,*
1Institute of Bioinformatics and Systems Biology, National Chiao Tung University,
Hsinchu, Taiwan
2Department of Information Engineering and Computer Science, Feng Chia University,
Taichung, Taiwan
3Master’s Program in Biomedical Informatics and Biomedical Engineering, Feng Chia
University, Taichung, Taiwan
4Graduate Institute of Molecular Systems Biomedicine, China Medical University,
Taichung, Taiwan
*E-mail: [email protected]
‡These authors contributed equally to this work.
21 22 23 24 25 26 27 28 29 30 31 32 33 4 5
Abstract
Background
Proteins often require small molecules, cofactors, or ligands to perform their particular biological functions. Accurate annotation of ligand-binding sites within target proteins is therefore essential to comprehensively understand mechanisms underlying protein-ligand interactions. Because experimental methods used to detect and
characterize ligand-binding sites are often time consuming and laborious, it is important to develop more efficient methods for detecting the structures that make up such sites. Recent studies indicate that residues within a particular ligand-binding region are highly conserved—both in sequence and three-dimensional structure.
Results
Here we developed a computational method to identify NAD- and FAD-binding sites in proteins. First, we extracted from the Protein Data Bank structures of proteins that bind to at least one of these ligands. NAD/FAD-binding residue templates were then constructed by identifying binding residues through the ligand-binding database BioLiPes within 3.5 Å of the ligand. The fragment transformation method was used to identify structures within query proteins that resembled the ligand-binding templates. By comparing residue types and their relative spatial positions, potential binding sites were identified and a ligand-binding potential for each residue was calculated. Setting the false-positive rate at 5%, our method predicted NAD- and FAD-binding sites at true-positive rates of 71.367.1% and 74.468.4%, respectively.
34 35 36 37 38 39 40 41 42 43 44 45 46 47 48 49 50 51 52 53 54
Conclusions
Our method provides excellent results for discriminating FAD- and NAD-binding sites in proteins, and the most important, the requirement of conservation of residue types and local structures in the FAD- and NAD-binding sites can be verified.
Keywords: Ligand-binding proteins, NAD, FAD, binding-site prediction, fragment transformation method 55 56 57 58 59 60 61 62
BackgroundIntroduction
Over the past 12 years, projects involving structural genomics have generated structural data for ~12,000 proteins within the Protein Data Bank (PDB) . For most of these proteins, however, biological function is unknown. It is therefore important to develop computational methodologies that can identify a protein’s function from its structure. Many biochemical processes depend on interactions between proteins and cofactors, such as metal ions, vitamins, and adenine dinucleotides, e.g., flavin adenine dinucleotide (FAD) and nicotinamide adenine dinucleotide (NAD). Adenine dinucleotides play important roles in many central biological processes, including DNA repair , glycolysis, photosynthesis, and transcription . By June 2010, 5293 proteins in PDB were annotated “nucleotide binding”, and nucleotides constitute ~15% of biologically relevant ligands . These statistics demonstrate how ubiquitous and essential protein-nucleotide interactions are to biological processes.
Although protein-ligand interactions are fundamental to most biochemical reactions, structural information concerning these binding sites is still inadequate. Once ligand-binding sites can be predicted from structural data, putative functions can be assigned to these proteins. More complete annotation of protein function will benefit both basic science and the pharmaceutical industry. Mutations or deletions within these ligand-binding domains often alter biochemical reactions and are the root causes of many diseases. This makes binding sites attractive targets for drug therapies, including anticancer chemotherapy. In recent years computational methods have been used to identify ligand-binding sites within proteins. These methods include empirical approaches , support vector machines (SVM) , random forest and artificial neural networks , structure comparison approaches . These prediction methods can be divided 63 64 65 66 67 68 69 70 71 72 73 74 75 76 77 78 79 80 81 82 83 84 85 86
into two broad categories: ones that use protein-sequence information, e.g., amino-acid composition, position-specific scoring matrix, and physicochemical properties, and ones that use protein-structure information, e.g., dihedral angles, and secondary structure and 3D-structure comparison. The most effective prediction methodologies, however, tend to use a combination of sequence and structure data.
The structural genomics initiative resolves 20 new protein structures each week, and more than 60,000 structures have been deposited into PDB. The functional surfaces of proteins, which interact with co-factors, tend to be more structurally conserved than internal structures . Residues that form a functional binding region are usually quite close to one another when the three-dimensional structure of a protein is examined. In addition, binding regions typically constitute only 10–30% of the entire protein . We took advantage of previously generated structural information and used the fragment transformation method to identify new binding sites for the NAD and FAD ligands.
Methods
Overview
We extracted structures of proteins bound to NAD or FAD from PDB and constructed a database of NAD/FAD-binding residue templates. Residues that were within 3.5 Å of any atom within the ligand were included in the template. Query protein structures were then compared with each template in the database using a “leave-one-out” comparison method. The fragment transformation method was used to align query and template structures. After comparing the local protein structure, each residue was assigned a score based on both protein sequence and structure. Sequence similarity was calculated using the BLOSUM62 substitution matrix , whereas structural similarity was calculated by measuring the root mean square deviation (RMSD) of the C carbons
87 88 89 90 91 92 93 94 95 96 97 98 99 100 101 102 103 104 105 106 107 108 109 110
from local structure alignments and using a secondary structure substitution matrix according to the Dictionary of Secondary Structure of Proteins’ (DSSP) definition of secondary structure . Residues with an alignment score that exceeded a pre-determined threshold were predicted to bind NAD/FAD. This method is illustrated in Figure 1. NAD/FAD-binding proteins and binding-residue templates
We adopted the datasets with previous research . All protein complexes were collected from PDB and had pairwise sequence identity < 40%. For proteins that contain multiple polypeptide chains, only chains involved in NAD/FAD binding were included. Residues that were less than 3.5 Å from any atom within NAD/FAD were defined as binding residues. All others were considered as non-binding residues. The main dataset included 247 and 158 polypeptide chains for NAD and FAD, respectively. Because NAD is composed of a nicotinamide moiety, an adenosine moiety, and a phosphate moiety, binding residues were divided into three groups: nicotinamide-binding,
adenosine-binding, and phosphate-binding. FAD binding sites similarly contain flavin-binding residues, adenosine-flavin-binding residues, and phosphate-flavin-binding residues. Groups of residues that contained more than two binding residues were considered a binding-residue template (see Figures 2 and 3).
The fragment transformation method
We used the fragment transformation method to align NAD/FAD-binding residues. Each residue was treated as an individual unit and was used to align the query protein S with the binding template T. The structural unit consists of a triplet formed by the
C C
N α atoms within a given residue. S denotes the query protein of length m, and T denotes the template of n residues. The query protein S of length m and the template T
111 112 113 114 115 116 117 118 119 120 121 122 123 124 125 126 127 128 129 130 131 132 133
of n residues can therefore be expressed in terms of triplets as S
1,2,,m
and
n
T 1,2,, , where i (pN,pC,pC), j (qN,qC,qC) and p and q are PDB coordinates for each atom.
A matrix of dimensions
m
n
was then constructed for the residues of S and Tas:
(1)
where the element Mij is a rigid-body transformation matrix that transforms the triplet i
toj (i.e., Mij i j).
Performing triplet clustering ij
kl
D is the Cartesian distance between the target l and the transformed triplet k
ij
M , providing a measure of how similarly the triplet pairs
(i,j) and
(
k,
l)
are oriented. This allows clustering of triplet fragments using the single-linkage algorithm as follows. If for two triplet pairs, (i,j) and
(
k,
l)
, Dklij
D
0,
i
k
, and j l, then the triplets are clustered. Let
G
1 and
G
2 be two clusters, with the first containing
(i,j) and
(
k,
l)
, and the second containing (i',j') and
(
k',
l')
. If Dk'l'ij D 0, then
G
1 and
G
2 are merged to form a new cluster G3, where G3 G1G2. Theseprocedures are performed iteratively until no new clusters can be formed. For each final cluster
G, we can obtain the transformation matrix:
l k
M , and aligned substructure
m,n m, m, ,n , , ,n , , M ... M M ... ... ... ... M ... M M M ... M M 2 1 2 2 2 1 2 1 2 1 1 1 M 134 135 136 137 138 139 140 141 142 143 144 145 146 147 148 149 150 151 152
pair:
G k k S and
G l l T , where G has the minimum Cartesian distance
when using Mk,l. Scoring function
For each residue i, the binding score Ci is defined as:
R B D
G i MAX C C C C i
(2)where is the number of triplets of
S (i.e., the aligned residues of the query
structure). The alignment scores
CR , CB , and CD
are defined as:
) , ( 1 1 T S RMSD CR , (3) 1 ) , ( ) , ( BLOSUM T T T S BLOSUM CB , (4) and 1 ) , ( ) , ( SSP DSSP T T T S D CB , (5)
where RMSD(S,T) is the RMSD of all
C
atoms between S and
T,
) , (S T
BLOSUM is the sequence alignment score between S and
T calculated
using the BLOSUM62 substitution matrix, BLOSUM (T,T) is the maximum sequence alignment score of
T, and DSSP(S,T) represents the secondary structure alignment score based on a construction substitution matrix using the
153 154 155 156 157 158 159 160 161 162 163 164 165 166 167 168
definition of DSSP between S and
T, DSSP(T,T) is the maximum secondary structure alignment score of
T. The value of RMSD(S,T) should be < 3Å. For each residue i, we predict a geometric center i of the ligand by
M L l k i 1 ,
, where L is the geometric center of the binding template type
in template T .
represents the three moieties of NAD/FAD: nicotinamide, adenosine, and phosphate for NAD; flavin, adenosine, and phosphate for FAD. The binding scorek
C is added into Ci if the distance between i and
'
k
is between 3 and 9 Å, and
. Finally, the normalized binding score C i Z , is calculated as: C i C i SD C C Z , (6)
where C and SDC denote the mean and standard deviation, respectively, of the binding score Ci .
Performance assessment
The accuracy of predicting NAD/FAD-binding sites was defined as the
number of true positives and true negatives and was evaluated using a leave-one-out approach. Accuracy (ACC), the true-positive rate (TPR), and the false-positive rate (FPR) were calculated using true positive (TP), true negative (TN), false positive (FP), and false negative (FN) values as follows:
FN FP TN TP FN TP ACC (7) FN TP TP Sensitivity TPR (8) 169 170 171 172 173 174 175 176 177 178 179 180 181 182 183 184 185 186 187
TN FP FP 1 Specificity FPR (9)
Results
Residues that bind NAD or FAD
To characterize the structural environment of NAD/FAD-binding sites, we compared binding-site residues to whole-protein residues. The three-dimensional structure of the NAD/FAD molecule was divided into three moieties according to function. Within the spherical environment of FADNAD, the adenosine-binding site typically contained arginine, glycine, isoleucine, tyrosine and aspartic acidthreonine
residues, the phosphate-binding site contained arginine, glycine, isoleucine, histidine,
serine, and threonine,methionine, phenylalanine, tyrosine, tryptophan, arginine and histidine residues, and the nicotinamideflavin-binding site contained serine, threonine, cysteine, phenylalanine, asparagine, tyrosine, tryptophan,cysteine, glycine, histidine, serine, threonine,tryptophan, and asparagine tyrosine residues. For NADFAD, adenosine was bound by glycine, valine, cysteine and tryptophanasparagine, aspartic acid, glycine, and threonine, phosphate was bound by glycine, serine and arginine, glycine, isoleucine, serine, threonine, and tyrosine, and nicotinamide flavin was bound by asparagine, cysteine, methionine, phenylalanine, tyrosine, tryptophan and histidine, serine, threonine, and tyrosine. The residue types which ratio of binding-site residues frequency to whole-protein residues frequency was greater than 1.2 were listed above.
As such, the binding residues were primarily polar residues, containing charged groups, amide groups, and nucleophilic groups (Figure 41).
We also characterized the types of atoms that were within 3.5 Å of the three moieties of each NAD/FAD ligand (Figure 52). Nicotinamide and fFlavin and
188 189 190 191 192 193 194 195 196 197 198 199 200 201 202 203 204 205 206 207 208 209 210
nicotinamide moieties were most commonly associated with nitrogen and oxygen atoms within the backbone and side-chains of the protein. Phosphate moieties were commonly bound by backbone and side-chain nitrogen or side-chain oxygen. Each ligand moiety preferentially bound certain atoms within certain residues.
Prediction performance
We chose two criteria to evaluate the performance of our binding-site
predictions: performance at less than 5% FPR, and the Matthews correlation coefficient (MCC). We used a combination of features that included the number of aligned
residues, RMSD, BLOSUM, and DSSP. Using a 5% FPR threshold, FAD NAD
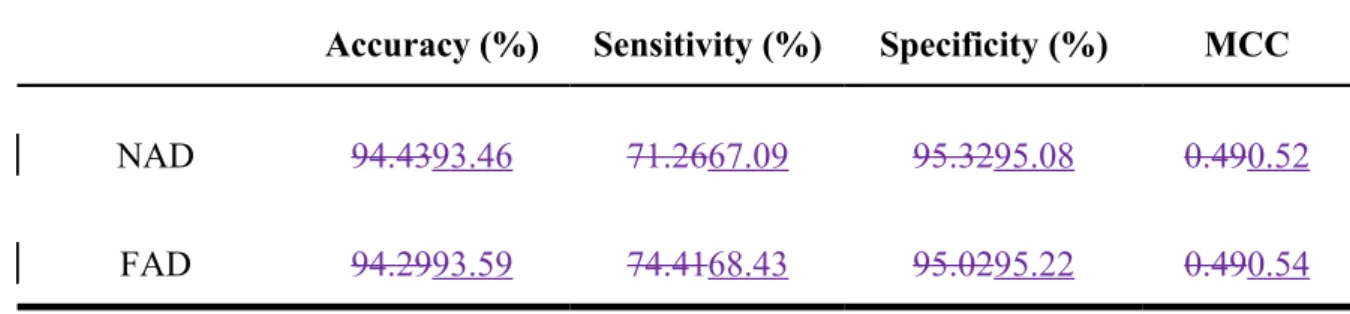
binding sites were predicted with an accuracy of 93.464.29%, a sensitivity of
67.0974.41%, and an MCC of 0.5249. Under these same conditions, NAD FAD
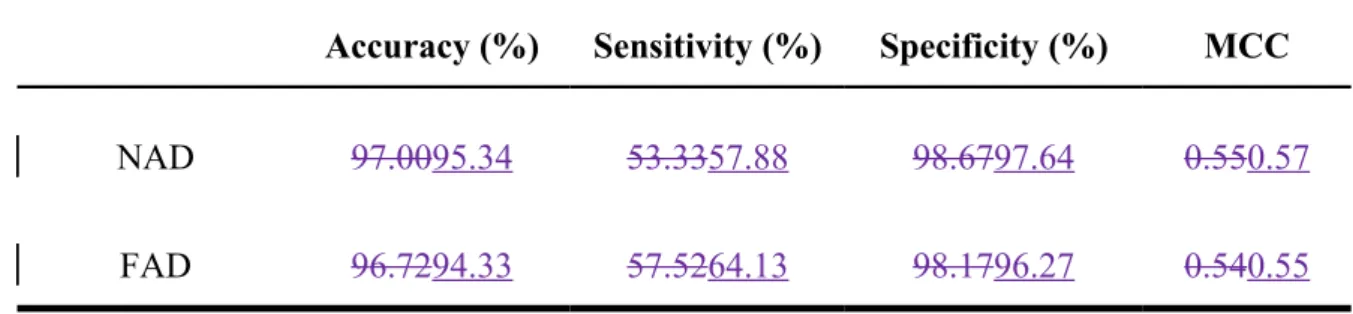
binding-site predictions yielded 94.4393.59% accuracy, 71.2668.43% sensitivity, and an MCC of 0.490.54 (Table 1). When MCCs were maximized, FADNAD-binding proteins were identified with 96.7295.34% accuracy, 57.5288% sensitivity, 98.1797.64%
specificity, and an MCC of 0.5457. Under these same conditions, NADFAD-binding residues were identified with an accuracy of 97.0094.33%, a sensitivity of
53.3364.13%, a specificity of 98.6796.27%, and an MCC of 0.55 (Table 2). These data indicated that our method could predict binding residues for these two ligands.
Comparison with other methods
We next compared our results with other prediction methodologies. For these comparisons we chose two published methods that use similar criteria for analyzing these kinds of ligand-protein complexes . These chosen methods assign binding or non-binding status to each residue within NAD/FAD-non-binding proteins. Because these 211 212 213 214 215 216 217 218 219 220 221 222 223 224 225 226 227 228 229 230 231 232 233
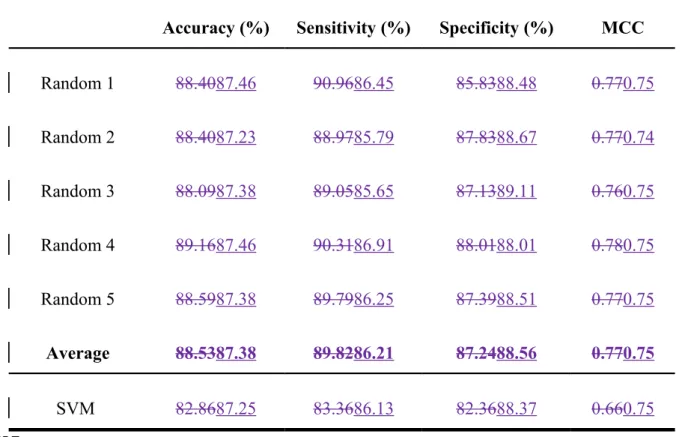
published methods use an equal number of binding and non-binding residues, we applied our prediction method to a similar dataset to make the results comparable. Random-selection processes were performed five times for all non-binding residues within ligand-protein complexes to generate the same scale for binding and non-binding residues within each protein. For FADNAD-binding proteins, our method predicted binding residues with a sensitivity of 89.8286.21% and an MCC of 0.757compared with 86.13% and 0.75 for the method developed by Ansari and Raghava (Table 3).
These values exceeded the performance of the published method (83.36% and 0.66) developed by Mishra and Raghava . For NADFAD-binding proteins, our method yielded 89.1285.68% sensitivity and an MCC of 0.7775.,These values compared with the performance of the published method (83.36% and 0.66) developed by compared with 86.13% and 0.75 for the method developed by Mishra and Raghava Ansari and Raghava (Table 4). Our method, therefore, more effectivelyhas similar performance in predicted NAD/FNAD binding sites predicted but better in FAD binding sites.
However, in native proteins, the number of binding and non-binding residues should not be equal. The equal number model needs to be further discussed.
Template matching
Figures 63–9 6 show alignments of predicted NAD/FAD-binding proteins and corresponding templates. Structures within these figures were drawn using PyMOL and color coded: light gray for the query protein; blue lines for the ligand; hotpink, orange
and, hotpink, forest or yellow sticks for adenosine-, phosphate- and
nicotinamide/flavin-binding residues that are predicted correctly; and marine dark gray sticks for non-binding residues that are predicted to be non-binding residues. Our method accurately identified 2113FADNAD-binding residues within chain B A of
D-2-234 235 236 237 238 239 240 241 242 243 244 245 246 247 248 249 250 251 252 253 254 255 256 257
hydroxyisocaproate dehydrogenaseErv2p (PDB ID:1JR81dxy) , with only tenthree
false positives (Figure 63). Four Nine nicotinamide-binding residues were identified based on of D-Lactate dehydrogenaseaugmenter of liver regeneration (chain DA; PDB ID:3KB61OQC) , three phosphate-binding residues were identified based on
phosphoglycerate dehydrogenase (chain A; PDB ID:1YBA) , five adenosine-binding residues and the other nine were identified based on C-terminal-binding
protein/brefeldin A-ADP ribosylated substrate Arabidopsis thaliana Erv1 thiol oxidase
(chain A; PDB ID:2HJ31HKU) and four by other protein templates. Our method also accurately predicted ten 23 FADNAD-binding residues within chain A C of
5-carboxymethyl-2-hydroxymuconate semialdehyde dehydrogenase of L -amino acid
oxidase (PDB ID:1F8R2D4E), with only a feweight false positives (Figure 74). Four Nine nicotinamide-binding residues were identified based on aldehyde dehydrogenase protoporphyrinogen oxidase (chain A; PDB ID:2IVD3B4W), three phosphate-binding and two eight adenosine-binding residues were identified based on 1-pyrroline-5-carboxylate dehydrogenase polyamine oxidase Fms1 (chain BA; PDB ID:1RSG2ehu)
and three by other protein templates , three were identified based on the human zinc finger protein (chain A; PDB ID:2ELM) and four were identified based on L -amino acid
oxidase (chain B; PDB ID:2JAE) .
For the FAD-binding proteins, oOur method accurately predicted that the chain A of deoxyribodipyrimidine photolyase UDP-galactose 4-epimerase from Escherichia coli (PDB ID:1A9Y1OWL) which contains 17 24 residues that bind NAD FAD
(Figure 85) and only six false positives occurred. Four Three adenosine-binding residues were identified based on human cryptochrome DASH UDP-galactose 4-epimerase (chain AX; PDB ID:2IJG1I3K) , six phosphate-binding residues were
258 259 260 261 262 263 264 265 266 267 268 269 270 271 272 273 274 275 276 277 278 279 280 281
identified based on photolyase-like domain of cryptochrome 1 (chain A; PDB ID:1U3C) and , the eleven flavin-binding residues others were identified based on photolyase gal10 fusion protein galactose mutarotase (chain A; PDB ID:1Z451IQR) and four by other protein templates. In addition, eight 30 NADFAD-binding residues were
accurately predicted within chain A H of D-amino acid oxidaseglyceraldehyde 3-phosphate dehydrogenase (PDB ID:1DC61DDO) with 14 false positives. Three Five adenosine-binding residues were predicted based on putidaredoxin reductase
carboxymethylated D -glyceraldehyde-3-phosphate dehydrogenase (chain GB; PDB
ID:1DSS1Q1R) , three adenosine-binding and nine flavin-binding residues based on D-amino acid oxidase glycosomal glyceraldehyde-3-phosphate dehydrogenase (chain A; PDB ID:1A7K1C0I), , and the othersthree phosphate-binding and five flavin-binding residues based on glycine oxidase glyceraldehyde 3-phosphate dehydrogenase (chain
AB; PDB ID:1VC21NG3) , and five by other protein templates (Figure 96).
Discussion
Small molecular cofactors (ligands) are essential for cells to perform numerous biological functions. NAD and FAD, for example, bind to proteins that play critical roles in energy transfer, energy storage, and signal transduction, to name just a few. To understand the mechanism by which these ligands affect protein function, it is important to identify ligand-binding residues within relevant proteins. The experimental
identification of these interacting residues is so difficult, however, that computational methods to accomplish this task are in high demand.
Here we developed a structure-comparison method that uses both sequence and structure information to predict NAD/FAD-binding residues within proteins. This approach also provides valuable information concerning the microenvironment of the 282 283 284 285 286 287 288 289 290 291 292 293 294 295 296 297 298 299 300 301 302 303 304 305
protein-ligand interaction. The composition of FADNAD/FNAD-binding residues that we identified here is generally similar to previous studies . Interestingly, glycine was the most frequent binding residue, binding to FAD NAD through phosphate or adenosine moieties more often than through the nicotinamide flavin moiety. In contrast, , arginine serine preferentially interacted with phosphatephosphate and flavin moieties and aspartic acid preferentially interacted with adenosine moieties of FADNAD, whereas threonine, cysteine and histidine bound to nicotinamide., whereas tyrosine primarily interacted with flavin moieties. The most common residue within NAD FAD binding sites was also glycine, which preferentially bound phosphate and adenosine moieties.
Tyrosine Serine interacted with phosphate and nicotinamide moieties, whereas histidine cysteine, tyrosine and tryptophan primarily bound to nicotinamide. By taking advantage of this kind of structural information, details concerning these critical binding sites may be revealed. For example, our method correctly predicted 15 FAD-binding residues within L -amino acid oxidase, but 18 non-binding residues were predicted to be binding
residues (Figure 7). Most of these false-positive residues are near the NAD/FAD ligand but more than 3.5 Å away. As such, these residues may also be involved in ligand binding, and our prediction methods more accurate than anticipated.
To investigate the influence of amino acids on prediction performance, the sensitivity and specificity associated with each residue were calculated (Figure 107). For NAD binding-site predictions, specificity for each residue was excellent (0.926927– 0.969966), but sensitivity was relatively low for phenylalanine, tryptophan methionine, arginine, and glutamine which were less than 0.5. For FAD binding sites, all residues achieved high specificity (0.899933–0.97167) and sensitivity (0.611532–0.850791). It should be noted that the ratio of NAD/FAD-binding residues to non-binding residues is
306 307 308 309 310 311 312 313 314 315 316 317 318 319 320 321 322 323 324 325 326 327 328 329
about 1 to 16 in our dataset. This large difference might cause lots of false positive when predicted. That is the reason for high specificity and accuracy but low sensitivity in our prediction results. Hence, tThe position of false positive residues in sequence were also investigated, 20% and 25% of false positive residues of NAD- and FAD-binding prediction occurred next to the true positive residues in sequence. It was shown that these residues also located near the ligand in the coordinate space. If these residues were treated as true positive residues, our prediction results of NAD-binding yielded 71.55% sensitivity and 0.61 MCC at a 5% FPR threshold. Under the same conditions, FAD binding-site predictions yielded 73.34% sensitivity, and an MCC of 0.64.
Compared with other prediction methods, ours did not use protein evolutionary
information but only used protein structure, did not need to use equal number dataset for training but predicted whole proteins through comparing structures of template
database. Our results yielded excellent prediction performance when analyzing
NAD/FAD-binding residues and thus provide important details concerning the binding-site microenvironment. This approach, therefore, may be used to predict putative NAD/FAD-binding proteins and the specific residues involved in the interaction.
Methods
Overview
We extracted structures of proteins bound to NAD or FAD from PDB and constructed a database of NAD/FAD-binding residue templates. Residues that were defined as binding residues by the ligand-binding database BioLiP were included in the template. Query protein structures were then compared with each template in the database using a “leave-one-out” comparison method. The fragment transformation method was used to align query and template structures. After comparing the local
330 331 332 333 334 335 336 337 338 339 340 341 342 343 344 345 346 347 348 349 350 351 352 353
protein structure, each residue was assigned a score based on both protein sequence and structure. Sequence similarity was calculated using the BLOSUM62 substitution
matrix , whereas structural similarity was calculated by measuring the root mean square deviation (RMSD) of the C carbons from local structure alignments and using a secondary structure substitution matrix according to the Dictionary of Secondary Structure of Proteins’ (DSSP) definition of secondary structure . Residues with an alignment score that exceeded a pre-determined threshold were predicted to bind NAD/FAD. This method is illustrated in Figure 8.
NAD/FAD-binding proteins and binding-residue templates
We adopted the same datasets with previous research . All protein complexes were collected from PDB and had pairwise sequence identity < 40% by using CD-HIT. Proteins chains that do not involved in NAD/FAD binding were excluded. Residues that were were defined as binding or nonbinding residues by using the ligand-binding database BioLiP. The main dataset included 184 and 165 polypeptide chains for NAD and FAD, respectively. Because NAD is composed of a nicotinamide moiety, an adenosine moiety, and a phosphate moiety, binding residues were divided into three groups: nicotinamide-binding, adenosine-binding, and phosphate-binding. FAD binding sites similarly contain flavin-binding residues, adenosine-binding residues, and
phosphate-binding residues. Groups of residues that contained more than or equal to two binding residues were considered a binding-residue template (see Figures 9 and 10). The fragment transformation method
We used the fragment transformation method to align NAD/FAD-binding residues. Each residue was treated as an individual unit and was used to align the query protein S
354 355 356 357 358 359 360 361 362 363 364 365 366 367 368 369 370 371 372 373 374 375 376
with the binding template T. The structural unit consists of a triplet formed by the atoms within a given residue. S denotes the query protein of length m, and T denotes the template of n residues. The query protein S of length m and the template T of n residues can therefore be expressed in terms of triplets as S
1,2,,m
and
n
T 1,2,, , where i (pN,pC,pC), j (qN,qC,qC) and p and q are PDB coordinates for each atom.
A matrix of dimensions
m
n
was then constructed for the residues of S and Tas:
(1)
where the element Mij is a rigid-body transformation matrix that transforms the triplet i
toj (i.e., Mij i j).
Performing triplet clustering ij
kl
D is the Cartesian distance between the target l and the transformed triplet
k ij
M , providing a measure of how similarly the triplet pairs
(i,j) and
(
k,
l)
are oriented. This allows clustering of triplet fragments using the single-linkage algorithm as follows. If for two triplet pairs, (i,j) and
(
k,
l)
, Dklij
D
0,
i
k
, and j l, then the triplets are clustered. Let
G
1 and
G
2 be two clusters, with the first containing
(i,j) and
(
k,
l)
, and the second containing (i',j') and
(
k',
l')
. If Dk'l'ij D 0,then
G
1 andG
2 are merged to form a new cluster G3, where G3 G1G2. Thesem,n m, m, ,n , , ,n , , M ... M M ... ... ... ... M ... M M M ... M M 2 1 2 2 2 1 2 1 2 1 1 1 M 377 378 379 380 381 382 383 384 385 386 387 388 389 390 391 392 393 394 395 396
procedures are performed iteratively until no new clusters can be formed. For each final cluster
G, we can obtain the transformation matrix:
l k
M , and aligned substructure
pair:
G k k S and
G l l T , where G has the minimum Cartesian distance
when using Mk,l. Scoring function
For each residue i, the binding score Ci is defined as:
R B D
G i MAX C C C C i
(2)where is the number of triplets of
S (i.e., the aligned residues of the query
structure). The alignment scores
CR , CB , and CD
are defined as:
) , ( 1 1 T S RMSD CR , (3) 1 ) , ( ) , ( BLOSUM T T T S BLOSUM CB , (4) and 1 ) , ( ) , ( SSP DSSP T T T S D CB , (5)
where RMSD(S,T) is the RMSD of all
C
atoms between S and
T,
) , (S T
BLOSUM is the sequence alignment score between S and
T calculated
using the BLOSUM62 substitution matrix, BLOSUM (T,T) is the maximum
397 398 399 400 401 402 403 404 405 406 407 408 409 410 411 412
sequence alignment score of
T, and DSSP(S,T) represents the secondary structure alignment score based on a construction substitution matrix using the definition of DSSP between S and
T, DSSP(T,T) is the maximum secondary structure alignment score of
T. The value of RMSD(S,T) should be < 3Å. For each residue i, we predict a geometric center i of the ligand by
M L l k i 1 ,
, where L is the geometric center of the binding template type
in template T .
represents the three moieties of NAD/FAD: nicotinamide, adenosine, and phosphate for NAD; flavin, adenosine, and phosphate for FAD. The binding scorek
C is added into Ci if the distance between i and
'
k
is between 3 and 9 Å, and
. Finally, the normalized binding score C i Z , is calculated as: C i C i SD C C Z , (6)
where C and SDC denote the mean and standard deviation, respectively, of the binding score Ci .
Performance assessment
The accuracy of predicting NAD/FAD-binding sites was defined as the
number of true positives and true negatives and was evaluated using a leave-one-out approach. Accuracy (ACC), the true-positive rate (TPR), and the false-positive rate (FPR) were calculated using true positive (TP), true negative (TN), false positive (FP), and false negative (FN) values as follows:
FN FP TN TP FN TP ACC (7) 413 414 415 416 417 418 419 420 421 422 423 424 425 426 427 428 429 430 431 432
FN TP TP Sensitivity TPR (8) TN FP FP 1 Specificity FPR (9)
Authors' contributions
CHL and CYS developed and implemented the methods; CHL, CYS, YFL, and JYC carried out the analysis; CHL and YFL drafted the manuscript; CHL supervised the work. All authors have read and approved the content of the final manuscript.
Acknowledgements
We are grateful to Yeong-Shin Lin (National Chiao Tung University, Taiwan) for invaluable comments.
References
1. Berman HM, Westbrook J, Feng Z, Gilliland G, Bhat TN, Weissig H, Shindyalov IN, Bourne PE: The Protein Data Bank. Nucleic Acids Res 2000, 28(1):235-242. 2. Wilkinson A, Day J, Bowater R: Bacterial DNA ligases. Mol Microbiol 2001,
40(6):1241-1248.
3. Burkle A: Physiology and pathophysiology of poly(ADP-ribosyl)ation. Bioessays 2001, 23(9):795-806.
4. Zhang Q, Piston DW, Goodman RH: Regulation of corepressor function by nuclear NADH. Science 2002, 295(5561):1895-1897.
5. Smith JS, Boeke JD: An unusual form of transcriptional silencing in yeast ribosomal DNA. Genes Dev 1997, 11(2):241-254.
433 434 435 436 437 438 439 440 441 442 443 444 445 446 447 448 449 450 451 452 453
6. Anderson RM, Bitterman KJ, Wood JG, Medvedik O, Cohen H, Lin SS, Manchester JK, Gordon JI, Sinclair DA: Manipulation of a nuclear NAD+
salvage pathway delays aging without altering steady-state NAD+ levels. J Biol
Chem 2002, 277(21):18881-18890.
7. Rutter J, Reick M, Wu LC, McKnight SL: Regulation of clock and NPAS2 DNA binding by the redox state of NAD cofactors. Science 2001, 293(5529):510-514. 8. Chen K, Mizianty MJ, Kurgan L: Prediction and analysis of nucleotide-binding
residues using sequence and sequence-derived structural descriptors.
Bioinformatics 2012, 28(3):331-341.
9. Saito M, Go M, Shirai T: An empirical approach for detecting nucleotide-binding sites on proteins. Protein Eng Des Sel 2006, 19(2):67-75.
10. Ansari HR, Raghava GP: Identification of NAD interacting residues in proteins.
BMC Bioinformatics 2010, 11:160.
11. Mishra NK, Raghava GP: Prediction of FAD interacting residues in a protein from its primary sequence using evolutionary information. BMC Bioinformatics 2010, 11 Suppl 1:S48.
12. Liu ZP, Wu LY, Wang Y, Zhang XS, Chen L: Prediction of protein-RNA binding sites by a random forest method with combined features. Bioinformatics 2010, 26(13):1616-1622.
13. Wang L, Liu ZP, Zhang XS, Chen L: Prediction of hot spots in protein interfaces using a random forest model with hybrid features. Protein Eng Des Sel 2012, 25(3):119-126.
14. Chauhan JS, Mishra NK, Raghava GP: Prediction of GTP interacting residues, dipeptides and tripeptides in a protein from its evolutionary information. BMC
Bioinformatics 2010, 11:301.
15. Roy A, Zhang Y: Recognizing protein-ligand binding sites by global structural alignment and local geometry refinement. Structure 2012, 20(6):987-997. 454 455 456 457 458 459 460 461 462 463 464 465 466 467 468 469 470 471 472 473 474 475 476 477 478 479 480
16. Xie L, Bourne PE: Detecting evolutionary relationships across existing fold space, using sequence order-independent profile-profile alignments. Proc Natl
Acad Sci U S A 2008, 105(14):5441-5446.
17. Yang J, Roy A, Zhang Y: Protein-ligand binding site recognition using
complementary binding-specific substructure comparison and sequence profile alignment. Bioinformatics 2013, 29(20):2588-2595.
18. Tseng YY, Li WH: Identification of protein functional surfaces by the concept of a split pocket. Proteins 2009, 76(4):959-976.
19. Dill KA: Dominant forces in protein folding. Biochemistry 1990, 29(31):7133-7155.
20. Govindarajan S, Goldstein RA: Evolution of model proteins on a foldability landscape. Proteins 1997, 29(4):461-466.
21. Parisi G, Echave J: Structural constraints and emergence of sequence patterns in protein evolution. Mol Biol Evol 2001, 18(5):750-756.
22. Lu CH, Lin YS, Chen YC, Yu CS, Chang SY, Hwang JK: The fragment
transformation method to detect the protein structural motifs. Proteins 2006, 63(3):636-643.
23. Schrodinger L: The PyMOL Molecular Graphics System, Version 1.3r1. 2010. 24. Dengler U, Niefind K, Kiess M, Schomburg D: Crystal structure of a ternary
complex of D-2-hydroxyisocaproate dehydrogenase from Lactobacillus casei, NAD+ and 2-oxoisocaproate at 1.9 A resolution. J Mol Biol 1997, 267(3):640-660.
25. Gross E, Sevier CS, Vala A, Kaiser CA, Fass D: A new FAD-binding fold and intersubunit disulfide shuttle in the thiol oxidase Erv2p. Nat Struct Biol 2002, 9(1):61-67.
26. Antonyuk SV, Strange RW, Ellis MJ, Bessho Y, Kuramitsu S, Inoue Y, Yokoyama S, Hasnain SS: Structure of D-lactate dehydrogenase from Aquifex aeolicus 481 482 483 484 485 486 487 488 489 490 491 492 493 494 495 496 497 498 499 500 501 502 503 504 505 506 507
complexed with NAD(+) and lactic acid (or pyruvate). Acta Crystallogr Sect F
Struct Biol Cryst Commun 2009, 65(Pt 12):1209-1213.
27. Wu CK, Dailey TA, Dailey HA, Wang BC, Rose JP: The crystal structure of augmenter of liver regeneration: A mammalian FAD-dependent sulfhydryl oxidase. Protein Sci 2003, 12(5):1109-1118.
28. Thompson JR, Bell JK, Bratt J, Grant GA, Banaszak LJ: Vmax regulation through domain and subunit changes. The active form of phosphoglycerate
dehydrogenase. Biochemistry 2005, 44(15):5763-5773.
29. Nardini M, Spano S, Cericola C, Pesce A, Massaro A, Millo E, Luini A, Corda D, Bolognesi M: CtBP/BARS: a dual-function protein involved in transcription co-repression and Golgi membrane fission. EMBO J 2003, 22(12):3122-3130.
30. Kort R, Komori H, Adachi S, Miki K, Eker A: DNA apophotolyase from
Anacystis nidulans: 1.8 A structure, 8-HDF reconstitution and X-ray-induced FAD reduction. Acta Crystallogr D Biol Crystallogr 2004, 60(Pt 7):1205-1213. 31. Huang Y, Baxter R, Smith BS, Partch CL, Colbert CL, Deisenhofer J: Crystal
structure of cryptochrome 3 from Arabidopsis thaliana and its implications for photolyase activity. Proc Natl Acad Sci U S A 2006, 103(47):17701-17706.
32. Thoden JB, Wohlers TM, Fridovich-Keil JL, Holden HM: Molecular basis for severe epimerase deficiency galactosemia. X-ray structure of the human V94m-substituted UDP-galactose 4-epimerase. J Biol Chem 2001, 276(23):20617-20623.
33. Brautigam CA, Smith BS, Ma Z, Palnitkar M, Tomchick DR, Machius M,
Deisenhofer J: Structure of the photolyase-like domain of cryptochrome 1 from Arabidopsis thaliana. Proc Natl Acad Sci U S A 2004, 101(33):12142-12147. 34. Komori H, Masui R, Kuramitsu S, Yokoyama S, Shibata T, Inoue Y, Miki K:
Crystal structure of thermostable DNA photolyase: pyrimidine-dimer recognition mechanism. Proc Natl Acad Sci U S A 2001, 98(24):13560-13565. 508 509 510 511 512 513 514 515 516 517 518 519 520 521 522 523 524 525 526 527 528 529 530 531 532 533 534
35. Todone F, Vanoni MA, Mozzarelli A, Bolognesi M, Coda A, Curti B, Mattevi A: Active site plasticity in D-amino acid oxidase: a crystallographic analysis.
Biochemistry 1997, 36(19):5853-5860.
36. Sevrioukova IF, Li H, Poulos TL: Crystal structure of putidaredoxin reductase from Pseudomonas putida, the final structural component of the cytochrome P450cam monooxygenase. J Mol Biol 2004, 336(4):889-902.
37. Song SY, Xu YB, Lin ZJ, Tsou CL: Structure of active site carboxymethylated D-glyceraldehyde-3-phosphate dehydrogenase from Palinurus versicolor. J Mol
Biol 1999, 287(4):719-725.
38. Pollegioni L, Diederichs K, Molla G, Umhau S, Welte W, Ghisla S, Pilone MS: Yeast D-amino acid oxidase: structural basis of its catalytic properties. J Mol
Biol 2002, 324(3):535-546.
39. Settembre EC, Dorrestein PC, Park JH, Augustine AM, Begley TP, Ealick SE: Structural and mechanistic studies on ThiO, a glycine oxidase essential for thiamin biosynthesis in Bacillus subtilis. Biochemistry 2003, 42(10):2971-2981. 40. Yang J, Roy A, Zhang Y: BioLiP: a semi-manually curated database for
biologically relevant ligand-protein interactions. Nucleic Acids Res 2013, 41(Database issue):D1096-1103.
41. Henikoff S, Henikoff JG: Amino acid substitution matrices from protein blocks.
Proc Natl Acad Sci U S A 1992, 89(22):10915-10919.
42. Kabsch W, Sander C: Dictionary of protein secondary structure: pattern recognition of hydrogen-bonded and geometrical features. Biopolymers 1983, 22(12):2577-2637.
43. Gower JC RG: Minimum spanning trees and single-linkage cluster analysis.
Journal of the Royal Statistical Society 1969, 18(1):11.
535 536 537 538 539 540 541 542 543 544 545 546 547 548 549 550 551 552 553 554 555 556 557 558 559 560 561
Figure Legends
Figure 1. Schematic of the method for predicting NAD/FAD-binding sites.
Figure 2. NAD-binding residue templates. A, The entire NAD-binding template. B, Nicotinamide-binding templates. C, Phosphate-binding templates. D, Adenosine-binding templates.
Figure 3. FAD-binding residue templates. A, The entire FAD-binding template. B, Flavin-binding templates. C, Phosphate-binding templates. D, Adenosine-binding templates.
Figure 41. Amino-acid frequencies within NAD/FAD-binding sites. Frequencies within NAD/FAD binding sites (whiteblack) are compared with total-protein frequencies (blackwhite). A, Adenosine-binding of NAD. B, Phosphate-binding of NAD. C, Nicotinamide -binding of NAD. D, Adenosine-binding of FAD. E, Phosphate-binding of FAD. F,Flavin-binding of FAD. It is shown the preferred types of amino acids surrounding the different moiety of NAD/FAD.
Figure 52. Atom-type frequencies within NAD/FAD-binding sites. Frequencies for both backbone (black) and side-chain (white) atoms are shown. A, Adenosine-binding of NAD. B, Phosphate-binding of NAD. C, Nicotinamide -binding of NAD. D,
Adenosine-binding of FAD. E, Phosphate-binding of FAD. F, Flavin-binding of FAD. A, B, C, NAD. D, E, F FAD. It is shown the preferred types of atoms surrounding the different moiety of NAD/FAD.
562 563 564 565 566 567 568 569 570 571 572 573 574 575 576 577 578 579 580 581
Figure 63. Identification of FADNAD-binding sites. A. Chain B A of
D-2-hydroxyisocaproate dehydrogenaseErv2p (PDB ID:1JR81DXY) was the query protein. Templates were constructed from B, D-Lactate dehydrogenase augmenter of liver regeneration (chain DA; PDB ID:1OQC3KB6), and C, phosphoglycerate
dehydrogenase (chain A; PDB ID:1YBA), D, C-terminal-binding protein/brefeldin A-ADP ribosylated substrate Arabidopsis thaliana Erv1 thiol oxidase (chain A; PDB ID:2H3J1HKU).
Figure 74. Identification of FADNAD-binding sites. A. Chain A C of
5-carboxymethyl-2-hydroxymuconate semialdehyde dehydrogenase L -amino acid oxidase
(PDB ID:1F8R2D4E) was the query protein. Templates were constructed from B,
aldehyde dehydrogenase protoporphyrinogen oxidase (chain A; PDB ID:2IVD3B4W), C, 1-pyrroline-5-carboxylate dehydrogenase polyamine oxidase Fms1 (chain BA; PDB ID:1RSG2EHU)., D, human zinc finger protein (chain A; PDB ID:2ELM), and E, L
-amino acid oxidase (chain B; PDB ID:2JAE).
Figure 85. Identification of NADFAD-binding sites. A. Chain A of
deoxyribodipyrimidine photolyaseUDP-galactose 4-epimerase (PDB ID:1A9Y1OWL) was the query protein. Templates were constructed from B, human cryptochrome DASH human UDP-galactose 4-epimerase (chain AX; PDB ID:2IJG1I3K), and C,
photolyase-like domain of cryptochrome 1 (chain A; PDB ID:1U3C), D,
photolyasegal10 fusion protein galactose mutarotase] (chain A; PDB ID:1Z451IQR). Figure 96. Identification of NADFAD-binding sites. A. Chain H of D-amino acid oxidaseChain A of glyceraldehyde 3-phosphate dehydrogenase (PDB ID:1DC61DDO) was the query protein. Templates were constructed from B, putidaredoxin reductase
582 583 584 585 586 587 588 589 590 591 592 593 594 595 596 597 598 599 600 601 602 603 604
glycosomal glyceraldehyde-3-phosphate dehydrogenase (chain BA; PDB
ID:1A7K1Q1R), C, D-amino acid oxidase Glyceraldehyde 3-phosphate dehydrogenase
(chain A; PDB ID:1VC21C0I), and D, glycine oxidase carboxymethylated D
-glyceraldehyde-3-phosphate dehydrogenase (chain GB; PDB ID:1DSS1NG3). Figure 107. Sensitivity and specificity associated with each amino acid in NAD/FAD binding-site predictions. A, NAD. B, FAD.
Figure 8. Schematic of the method for predicting NAD/FAD-binding sites.
Figure 9. NAD-binding residue templates. A, The entire NAD-binding template. B, Nicotinamide-binding templates. C, Phosphate-binding templates. D, Adenosine-binding templates.
Figure 10. FAD-binding residue templates. A, The entire FAD-binding template. B, Flavin-binding templates. C, Phosphate-binding templates. D, Adenosine-binding templates. 605 606 607 608 609 610 611 612 613 614 615 616 617 618 619 620 621
Tables
Table 1. The performance of binding-site predictions at a 5% FPR threshold.
Accuracy (%) Sensitivity (%) Specificity (%) MCC
NAD 94.4393.46 71.2667.09 95.3295.08 0.490.52
FAD 94.2993.59 74.4168.43 95.0295.22 0.490.54
622
Table 2. The performance of binding-site predictions at a maximum MCC threshold. Accuracy (%) Sensitivity (%) Specificity (%) MCC
NAD 97.0095.34 53.3357.88 98.6797.64 0.550.57
FAD 96.7294.33 57.5264.13 98.1796.27 0.540.55
624
Table 3. Comparison between the fragment transformation and SVM methods for predicting FAD NAD binding-site residues. [Authors: Please define SVM here, or in a legend below the Table.]
Accuracy (%) Sensitivity (%) Specificity (%) MCC
Random 1 88.4087.46 90.9686.45 85.8388.48 0.770.75 Random 2 88.4087.23 88.9785.79 87.8388.67 0.770.74 Random 3 88.0987.38 89.0585.65 87.1389.11 0.760.75 Random 4 89.1687.46 90.3186.91 88.0188.01 0.780.75 Random 5 88.5987.38 89.7986.25 87.3988.51 0.770.75 Average 88.5387.38 89.8286.21 87.2488.56 0.770.75 SVM 82.8687.25 83.3686.13 82.3688.37 0.660.75
Table 4. Comparison between the fragment transformation and SVM methods for predicting NAD FAD binding-site residues.
Accuracy (%) Sensitivity (%) Specificity (%) MCC 626
627 628 629
Random 1 88.5887.38 88.5585.68 88.6289.08 0.770.75 Random 2 88.8687.48 89.8985.73 87.8389.23 0.780.75 Random 3 88.4087.35 88.4985.55 88.3189.15 0.770.75 Random 4 88.3187.58 88.9385.73 87.6889.43 0.770.75 Random 5 88.4587.44 89.7685.73 87.1389.15 0.770.75 Average 88.5287.45 89.1285.68 87.9189.21 0.770.75 SVM 87.2582.86 86.1383.36 88.3782.36 0.750.66 630 631