Original Article
Plasma retinol and α-tocopherol status of the Taiwanese
elderly population
Wei-Yi Cheng
MS,1Ming-Ling Fu
MS,1,4Li-Jou Wen
BS,2Cheng Chen
MS,3Wen-Harn Pan
PhD1,3and Ching-jang Huang
PhD1,21Institute of Microbiology and Biochemistry, National Taiwan University, Taipei, Taiwan
2Department of Biochemical Science and Technology, National Taiwan University, Taipei, Taiwan 3 Institute of Biomedical Sciences, Academia Sinica, Taipei, Taiwan
4Department of Food Nutrition, Chung Hwa College of Medical Technology, Tainan, Taiwan
Biochemical assessment of vitamin A and vitamin E status of Taiwanese elderly persons was conducted by quantitative analysis of the concentration of retinol and α-tocopherol in plasma samples collected in the Elderly Nutrition and Health Survey in Taiwan (1999-2000). Plasma samples were analyzed by a reverse phase HPLC that can detect retinol and α-tocopherol simultaneously. The mean (SE) plasma retinol and α-tocopherol values in the 2373 valid samples were 2.73 (0.03) and 27.12 (0.47) µM, respectively, after weighting to the whole population using the SUDDAN program. Among the elderly persons studied, 99.52% of the population demonstrated normal plasma vitamin A status (plasma retinol equal to or greater than 0.7 µM or 0.2 µg/mL). The prevalence of deficient (less than 11.63 µM or5 µg/mL) and marginal (greater than or equal to 11.63, but less than 16.28 µM or 7 µg/mL) plasma α-tocopherol concentrations in the elderly population in Taiwan were 2.91% and 10.61%, respectively. However, the prevalence of low or inadequate vitamin E status decreased to 4.20% when the plasma α -tocopherol/cholesterol ratio was used as the indicator (less than 2.8 µg/mg). Results of the multiple linear regression analysis revealed that serum lipids had a strong influence on plasma α-tocopherol concentration. The results also showed that elderly men, those living in two Central Taiwan regions, and subjects with plasma cholesterol levels higher than 200 or lower than 174 mg/dL all had higher risk of low or inadequate α-tocopherol status than their counterparts. In conclusion, the plasma vitamin A and vitamin E status in the Taiwanese elderly are comparable to those reported for adults of developed Western societies.
Key Words: plasma α-tocopherol, plasma retinol, elderly, nutrition survey, biochemical status, Elderly Nutrition and Health Survey in Taiwan (1999-2000)
Introduction
Vitamin A and E are fat-soluble vitamins that are essential for human health. Results from dietary surveys in Taiwan over past decades have shown that vitamin A intake is adequate, but biochemical assessment of vitamin A status of elderly persons in Taiwan is not commonly reported. Signs of severe vitamin E deficiency due to inadequate dietary intake of vitamin E such as neurological abnor-malities are rarely found in humans.1 However, being the most important fat-soluble biological antioxidant in the body, vitamin E is suggested to play a significant role in preventing pathological conditions in which free-radical mediated oxidative stress is implicated, including chronic diseases such as cardiovascular disease and cancer.2,3 It is well-known that these types of chronic disease are most prevalent in the aged population in developed countries. Vital statistics over the past decades have shown that chro-nic diseases are currently the main public health issue in Taiwan. The biochemical assessment of vitamin E status in elderly people in Taiwan is thus warranted from the public health point of view. A reverse phase HPLC for the simultaneous determination of α-tocopherol and re-tinol was employed in this study to assess vitamin A and
persons collected in the Elderly Nutrition and Health Survey in Taiwan (1999-2000).
Subjects and methods Sampling and study design
The sampling scheme, anthropometric measurements, and blood collection and management procedures have been de-scribed elsewhere.4 Heparinized whole blood was used for on-site measurement of hemoglobin. Hemoglobin was mea-sured colorimetrically by the cyanomethemoglobin method (Merckotest, Merck) using a portable filter photometer Flash calibrated with hemoglobin cyanide standard solution (Merck). Mean corpuscular hemoglobin concentration (MCHC) was calculated as a percentage of hemoglobin to hematocrit. Serum was analyzed within a month for
Correspondence address: Ching-jang Huang, Ph.D, Department of Biochemical Science and Technology, National Taiwan University, 1, Sec.4, Roosevelt Rd. Taipei 106, Taiwan
Tel/Fax: 886-2-2362-1301 E-mail: cjjhuang@ntu.edu.tw
triglycerides, total cholesterol, and high-density lipo-protein cholesterol (HDL-C) using a Hitachi model 747 automatic analyzer. Low-density lipoprotein cholesterol (LDL-C) was calculated as follows: LDL-C = total cholesterol – (HDL-C) – triglycerides/5. These data, including serum cholesterol, were used in the present study for further data analysis. For the analysis of retinol and α-tocopherol, blood was drawn into heparinized tubes. After centrifugation, plasma samples were stored at -80°C until analysis.
Assay of plasma retinol and α-tocopherol
The method described by Miller et al., was employed with some modification.5 After thawing, 0.1mL of plas-ma sample was added to 0.1mL of α-tocopheryl acetate (25 µg/ml) as an internal control and 0.1mL of ice-cold ethanol containing 1% pyrogallol. This was then mixed by vortex for 1 min before adding 2 mL n-hexane and vortexing for an additional 5 mins. After centrifugation at 1000 rpm for 5 min, 1.8 mL of upper hexane phase was collected and the solvent was evaporated. The residue was dissolved in 0.1 mL of methanol-chloroform 2:1 (v/v) and analyzed by a reverse phase HPLC equipped with a LiChroCART125-4 RP-18 (5µm) column (Merck Cat. No.1.50943) and a guard column, Jasco PU-980 Intelli-gent HPLC pump and Jasco AS-2055 plus intelligent autosampler. Isocratic separation was performed with a mixture of methanol, acetonitrile and chloroform 47:55: 10 (v/v) and the flow rate was 1 mL/min. The effluent was monitored with two detectors in series: retinol was detected using a Jasco 870-UV Intelligent UV/VIS Detec-tor at 325 nm; α-tocopherol and α-tocopherol acetate were detected using a Jasco 821-FP Intelligent Spectro-flurometer at Excitation 286nm/ Emission 330nm. The concentration of each peak was calculated by intra-polation to standard curves established by analyzing vari-ous concentrations of standard compounds under iden-tical HPLC conditions. The retention times of retinol, α-tocopherol acetate and α -α-tocopherol were 2, 5 and 6 min, respectively. Standard retinol (R-7632) and α-tocopherol acetate (T-3376) were obtained from Sigma, and α-tocopherol was obtained from CALBIOCHEM (Cat. No.613424). HPLC grade methanol, acetonitrile, chloro-form, and n-hexane (Merck) were used for the preparation of the mobile phase.
The variation among different batches of analysis was monitored by including a quality control (QC) sample in each batch of analysis. This QC sample was prepared by aliquoting a thoroughly mixed batch of plasma. The co-efficients of variation of this QC sample among the 52 analysis batches for retinol and α-tocopherol were 9.62 and 9.02 % respectively. For interlaboratory comparison, the procedure was also confirmed by similarly analyzing a standardized plasma sample (SRM 968c, National Institute of Standards & Technology). Our results of this standardized sample were 0.519 ± 0.04µg/mL for retinol, which was similar to the reported value (0.484 ± 0.012 µg/mL), and 16.02 ± 0.87µg/ mL for α-tocopherol, which was within the range of the reported value (16.79 ± 0.76µg/mL).
Definitions for vitamin A and E status
Nutritional adequacy of vitamin A was represented by a plasma retinol concentration equal to or greater than 0.2 µg/mL.6 Values between 0.1 and 0.2 were considered as marginal, and values less than 0.1 were deficient. Nutri-tional adequacy of vitamin E was represented by a plasma α-tocopherol concentration equal to or greater than 7µg/ mL. Values less than 5µg/mL were considered as vitamin E deficient, values between 5 and 7µg/mL were regarded as marginal.6 Alternatively, a ratio of α-tocopherol/ cholesterol equal to or greater than 2.8 µg/mg was con-sidered vitamin E adequate.7 Multiple logistic regression analysis of dichotomized plasma tocopherol or α-tocopherol/ cholesterol ratio was performed to examine factors associated with a plasma α-tocopherol con-centration of less than 7 µg/mL or a α-tocopherol/ cho-lesterol ratio of less than 2.8.
Statistical analysis
Anthropometric as well as blood and serum biochemical parameters obtained from the survey were first checked for their correlation with plasma α-tocopherol by Pear-son’s correlation using the SAS program. Factors show-ing significant and relatively high correlation coefficients were confirmed by linear regression and logistic re-gression analysis separately and then combined for multi-variate analysis, each adjusted for age and gender using SUDDAN. In the logistic regression analysis with serum parameters, subjects were categorized by quartile based on their LDL-cholesterol, total cholesterol, triglycerides, hemoglobin and MCHC values. In addition to these sta-tistical analyses, mean, SE and prevalence data were also weighted to the Taiwan population by SUDDAN SAS-callable version 8.0.
Results
Out of the plasma samples analyzed, 2373 samples had basic background data (age, gender and strata) and were included in the statistical analysis for weighting to the population according to the stratified study design. In addition, 2349 samples also had valid serum cholesterol data from which the α-tocopherol/cholesterol could be calculated as an alternative indicator of vitamin E status. As shown in Table 1, the mean value of plasma retinol concentration was 2.73 µM for elderly persons aged over 65 in Taiwan, well above the cut-off point for nutritional adequacy of vitamin A (0.7µM). The prevalence of de-ficient and marginal plasma retinol levels were 0.36% and 0.12%, respectively. These results indicate that the bio-chemical status of vitamin A in the Taiwanese elderly population is quite satisfactory. Only 12 out of the 2373 samples analyzed showed a plasma retinol less than the cut-off point concentration, and only 3 fell into the frank deficiency category (less than 0.35µM). These 12 cases did not seem to be clustered in specific age, sex or strata groups. Preliminary logistic regression analysis showed that elderly subjects with self-reported liver cirrhosis were more likely to have marginal and deficient plasma retinol concentrations. (Odds ratio 67.334, 95% confidence inter-val 5.29-857.0, P=0.0012).
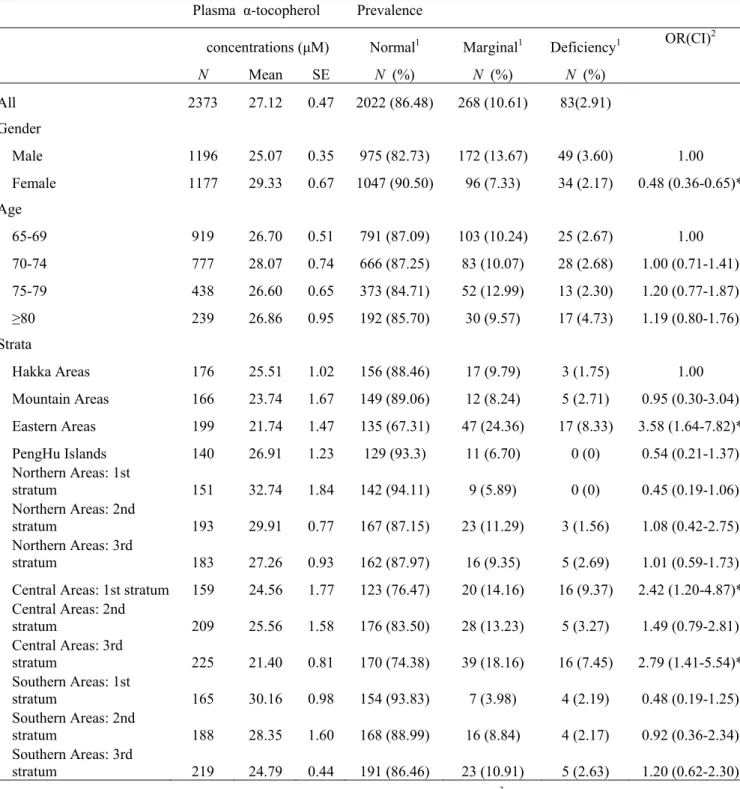
The mean plasma α-tocopherol (27.12 µM) was also higher than the cut-off point concentration (16.28 for mar-ginal and 11.63 µM for frank deficiency) for nutritional adequacy of vitamin E. However, 10.61% and 2.91% of the elderly population had plasma α–tocopherols that fell within the range of marginal and deficient respectively. The prevalence of marginal and deficient plasma α-tocopherol concentrations was higher in men than in wo-men, and was higher in the eastern areas stratum, and the first and third strata in the central areas, as shown by re-sults obtained from multiple logistic regression analysis by SUDDAN (Table 2). It is known that plasma α- tocopherol is highly associated with blood lipids and
we have also observed such an association in this study (Table 4). The plasma α -tocopherol/cholesterol ratio was therefore calculated as an alternative plasma vitamin E status indicator and data are shown in Table 3. The mean (SE) value of the plasma α-tocopherol/cholesterol ratio in the Taiwanese elderly population was 5.84 (0.11). The prevalence of inadequate vitamin E status using 2.8 µmol/ mmol as the cut-point was 4.2%. Elderly women had a lower risk of inadequate plasma α-tocopherol/ cholesterol ratio than men (odds ratio 0.56, 95% confidence interval 0.38-0.81). Residents of the first stratum in the central areas, also had a higher risk of inadequate plasma α-tocopherol/cholesterol ratio(
Plasma Retinol Prevalence
Concentration (µM) Normal1 Marginal1 Deficiency1
N Mean SE N (%) N (%) N (%) All 2373 2.73 0.03 2361 (99.52) 9 (0.36) 3 (0.12) Gender Male 1196 2.80 0.03 1190 (99.36) 5 (0.49) 1 (0.16) Female 1177 2.66 0.03 1171 (99.70) 4 (0.22) 2 (0.8) Ages 65-69 919 2.69 0.07 915 (99.45) 3 (0.32) 1 (0.23) 70-74 777 2.80 0.03 771 (99.13) 5 (0.77) 1 (0.10) 75-79 438 2.62 0.07 437 (99.94) 1 (0.06) 0 (0) ≥80 239 2.80 0.10 238 (99.94) 0 (0) 1 (0.06) Strata Hakka Areas 176 2.69 0.03 175 (99.38) 1 (0.62) 0 (0) Mountain Areas 166 3.39 0.35 166 (100) 0 (0) 0 (0) Eastern Areas 199 2.66 0.17 196 (98.66) 2 (0.92) 1 (0.41) PengHu Islands 140 2.97 0.14 140 (100) 0 (0) 0 (0) Northern Areas: 1st stratum 151 2.83 0.07 151 (100) 0 (0) 0 (0) Northern Areas: 2nd stratum 193 3.04 0.10 193 (100) 0 (0) 0 (0) Northern Areas: 3rd stratum 183 2.69 0.10 182 (100) 1 (0.56) 0 (0) Central Areas: 1st stratum 159 2.69 0.21 159 (100) 0 (0) 0 (0) Central Areas: 2nd stratum 209 2.69 0.07 208 (99.46) 1 (0.54) 0 (0) Central Areas: 3rd stratum 225 2.48 0.03 224 (99.54) 1 (0.46) 0 (0) Southern Areas: 1st stratum 165 2.87 0.07 162 (98.3) 2 (1.18) 1 (0.51) Southern Areas: 2nd stratum 188 2.59 0.14 188 (100) 0 (0) 0 (0) Southern Areas: 3rd stratum 219 2.55 0.17 217 (99.07) 1 (0.44) 1 (0.49 )
1Normal, >= 0.7µM (0.2µg/mL); 0.7 µM <=Marginal<0.35µM; Deficiency, < = 0.35µM (0.1 µg/mL)
Table 1. Plasma retinol concentrations in Taiwanese elderly persons by age, gender and strata from the Elderly Nutrition and Health Survey in Taiwan (1999-2000)
interval 1.10-36.41). Results of multivariate linear re-gression analysis showed that sex, age, BMI (β=-0.0771,
P=0.0071), MCHC (β=0.4186, P=0.0464), serum
chole-sterol (β=0.0560, P=0.0000) and triglycerides (β=0.0122,
P=0.0000) were associated with plasma α-tocopherol.
When the same analysis was conducted on the plasma α-tocopherol/cholesterol ratio, only BMI (β=-0.0004, P = 0.0058), serum triglycerides (β= 0.001, P = 0.0000) and MCHC (β=0.0021, P = 0.0380) showed an association. Table 4 shows the results of multivariate logistic regression
analysis on plasma tocopherol concentration and α-tocopherol/cholesterol ratio. Elderly persons whose serum cholesterol was at the lowest quartile (cholesterol 174 mg/dL) had significantly higher risk of having marginal or deficient plasma α-tocopherol (odds ratio = 4.4, 95% confidence interval 3.24 - 5.98, P = 0.0000) when sub-jects with a cholesterol level in the third quartile (174-200mg/dL) were taken as the reference group. Elderly persons with a cholesterol level in the highest and second quartile had significantly lower risk (Table 4).
Table 2. Plasma α-tocopherol concentrations and prevalence of deficiency in Taiwanese elderly persons by age, gender and strata from the Elderly Nutrition and Health Survey in Taiwan (1999-2000)
Plasma α-tocopherol Prevalence
concentrations (µM) Normal1 Marginal1 Deficiency1 OR(CI)2
N Mean SE N (%) N (%) N (%) All 2373 27.12 0.47 2022 (86.48) 268 (10.61) 83(2.91) Gender Male 1196 25.07 0.35 975 (82.73) 172 (13.67) 49 (3.60) 1.00 Female 1177 29.33 0.67 1047 (90.50) 96 (7.33) 34 (2.17) 0.48 (0.36-0.65)* Age 65-69 919 26.70 0.51 791 (87.09) 103 (10.24) 25 (2.67) 1.00 70-74 777 28.07 0.74 666 (87.25) 83 (10.07) 28 (2.68) 1.00 (0.71-1.41) 75-79 438 26.60 0.65 373 (84.71) 52 (12.99) 13 (2.30) 1.20 (0.77-1.87) ≥80 239 26.86 0.95 192 (85.70) 30 (9.57) 17 (4.73) 1.19 (0.80-1.76) Strata Hakka Areas 176 25.51 1.02 156 (88.46) 17 (9.79) 3 (1.75) 1.00 Mountain Areas 166 23.74 1.67 149 (89.06) 12 (8.24) 5 (2.71) 0.95 (0.30-3.04) Eastern Areas 199 21.74 1.47 135 (67.31) 47 (24.36) 17 (8.33) 3.58 (1.64-7.82)* PengHu Islands 140 26.91 1.23 129 (93.3) 11 (6.70) 0 (0) 0.54 (0.21-1.37) Northern Areas: 1st stratum 151 32.74 1.84 142 (94.11) 9 (5.89) 0 (0) 0.45 (0.19-1.06) Northern Areas: 2nd stratum 193 29.91 0.77 167 (87.15) 23 (11.29) 3 (1.56) 1.08 (0.42-2.75) Northern Areas: 3rd stratum 183 27.26 0.93 162 (87.97) 16 (9.35) 5 (2.69) 1.01 (0.59-1.73)
Central Areas: 1st stratum 159 24.56 1.77 123 (76.47) 20 (14.16) 16 (9.37) 2.42 (1.20-4.87)* Central Areas: 2nd stratum 209 25.56 1.58 176 (83.50) 28 (13.23) 5 (3.27) 1.49 (0.79-2.81) Central Areas: 3rd stratum 225 21.40 0.81 170 (74.38) 39 (18.16) 16 (7.45) 2.79 (1.41-5.54)* Southern Areas: 1st stratum 165 30.16 0.98 154 (93.83) 7 (3.98) 4 (2.19) 0.48 (0.19-1.25) Southern Areas: 2nd stratum 188 28.35 1.60 168 (88.99) 16 (8.84) 4 (2.17) 0.92 (0.36-2.34) Southern Areas: 3rd stratum 219 24.79 0.44 191 (86.46) 23 (10.91) 5 (2.63) 1.20 (0.62-2.30)
1Normal, >= 16.28µM (7µg/mL); 16.28 <= Marginal <11.63; deficiency, <= 11.63 µM (5µg/mL); 2multiple logistic regression analysis of
effects of gender, age and strata on marginal or deficient plasma α-tocopherol (< = 11.63 µM or 5 µg/mL). OR: Odds Ratio, CI: Confidence Interval, analyzed by SUDDAN
Interestingly, when the same analysis was conducted on the plasma α-tocopherol/cholesterol ratio, elderly persons with a serum cholesterol level in the highest, second and lowest quartile all had significantly higher risk of having low or inadequate plasma α-tocopherol/cholesterol ratio. Elderly subjects with a BMI greater than 30 showed a sig-nificantly higher risk of marginal or deficient plasma α-tocopherol concentration (Table 4).
Discussion
The plasma retinol concentrations observed in this study indicate that the biochemical status of vitamin A in elder-ly persons in Taiwan is satisfactory. Not onelder-ly is the mean value well above the cut-off point, but also the prevalence of marginal and deficient levels of vitamin A is as low as
0.48%. This result coincides with the fact that the mean vitamin A dietary intake of Taiwanese adult residents is ample.9 The mean vitamin A intake of Taiwanese adults was reported to be 162% (male) and 186% (female) of the RDA value in the Nutrition and Health Survey in Taiwan 1993-1996 (NAHSIT 1993-1996).8 In the survey from which plasma samples analyzed in this study were collected (the Elderly Nutrition and Health Survey in Taiwan (1999-2000); Elderly NAHSIT), the dietary vita-min A intake of Taiwanese elderly persons was reported to be 9194 IU/day, which is about 1.9 times the RDA value.9 The plasma level of vitamin E in elderly persons in Taiwan, however, is not as satisfactory as that of vita-min A. The prevalence of marginal and deficient levels were 10.61% and 2.91%, respectively. The strong de-pendence of plasma α-tocopherol on plasma lipids was
α-Tocopherol /Cholesterol Prevalence
(µg/mg) Normal1 Deficiency1 OR (CI)2
N Mean SE N (%) N (%) All 2349 5.84 0.11 2245 (95.80) 104 (4.20) Gender Male 1188 5.53 0.08 1123 (94.68) 65 (5.32) 1.00 Female 1161 6.18 0.15 1122 (97.00) 39 (3.00) 0.56 (0.38-0.81)* Ages 65-69 912 5.68 0.13 872 (95.51) 40 (4.49) 1.00 70-74 767 5.90 0.14 737 (96.38) 30 (3.62) 0.79 (0.42-1.50) 75-79 433 5.86 0.15 414 (96.04) 19 (3.96) 0.84 (0.46-1.52) ≥80 237 6.08 0.26 222 (94.98 15 (5.02) 1.11 (0.55-2.27) Strata Hakka Areas 174 5.68 0.40 170 (97.79) 4 (2.21) 1.00 Mountain Areas 164 5.22 0.23 159 (97.10) 5 (2.90) 1.31 (0.17-9.92) Eastern Areas 198 4.99 0.17 184 (93.30) 14 (6.70) 3.04 (0.59-15.68) PengHu Islands 140 5.57 0.21 138 (98.79) 2 (1.21) 0.54 (0.07-3.89)
Northern Areas: 1st stratum 149 6.71 0.39 143 (95.90) 6 (4.10) 1.80 (0.32-10.19) Northern Areas: 2nd stratum 190 6.50 0.19 181 (95.13) 9 (4.87) 2.21 (0.39-12.63) Northern Areas: 3rd stratum 179 5.99 0.15 173 (96.36) 6 (3.64) 1.59 (0.28-9.09) Central Areas: 1st stratum 157 5.58 0.41 137 (87.12) 20 (12.88) 6.32 (1.10-36.41)* Central Areas: 2nd stratum 208 5.77 0.44 199 (95.16) 9 (4.84) 2.21 (0.45-10.71) Central Areas: 3rd stratum 220 5.01 0.21 206 (94.27) 14 (5.73) 2.69 (0.53-13.68) Southern Areas: 1st stratum 163 5.99 0.21 160 (98.31) 3 (1.69) 0.73 (0.12-4.46) Southern Areas: 2nd stratum 188 5.85 0.35 180 (95.68) 8 (4.32) 1.94 (0.32-11.86) Southern Areas: 3rd stratum 219 5.25 0.12 215 (98.11) 4 (1.89) 0.84 (0.10-6.72)
Table 3. Plasm α-tocopherol/cholesterol ratio and prevalence of deficiency in Taiwanese elderly persons by gender, age and strata from the Elderly Nutrition and Health Survey in Taiwan (1999-2000)
lNormal: >=2.8 µg/mg; Deficiency: <2.8 µg/mg. 2Multiple logistic regression analysis for the effects of gender, age and strata on deficient plasma α-tocopherol/cholesterol ratio (<= 2.8 µg/mg). OR: Odds Ratio, CI: Confidence Interval, analyzed by SUDDAN
α-tocopherol concentration α-tocopherol/cholesterol ratio Mean n /N1 OR (95% CI)1 P value n /N1 OR (95%CI)1 P value
Gender Male 220 / 1193 1 45 / 1193 1 Female 132 / 1158 0.58 (0.37-0.90) 0.0167* 36 / 1158 0.62 (0.27-1.42) 0.2496 Age (year) 65-69 67.00 121 / 913 1 20 / 913 70-74 71.86 113 / 771 1.05 (0.74-1.50) 0.7820 29 / 771 1.56 (0.64-3.79) 0.3175 75-80 76.61 66 / 430 1.06 (0.73-1.53) 0.7633 19 / 430 1.54 (0.60~3.97) 0.3543 ≥80 83.48 52 / 237 1.04 (0.62-1.75) 0.8861 13 / 237 1.93 (0.60-6.18) 0.2582 BMI (kg/m2) 18.5-24 21.63 168 / 1101 1 39 / 1101 1 <18.5 17.22 57 / 211 1.51 (0.84-2.70) 0.1570 11 / 211 0.81 (0.38-1.71) 0.5618 24-27 25.33 79 / 645 1.11 (0.68-1.81) 0.6687 20 / 645 1.25 (0.55-2.85) 0.5883 27-30 28.27 27 / 275 1.10 (0.64-1.90) 0.7091 6 / 275 1.08 (0.30-3.87) 0.9034 >30 31.76 21 / 119 2.47 (1.57-3.89) 0.0004* 5 / 119 1.57 (0.54-4.57) 0.3923 LDL-C2 (mg/dL) 122-145 132.52 51 / 573 1 17 / 573 1 <98 79.94 169 / 591 0.69 (0.40-1.17) 0.1613 29 / 591 0.82 (0.21-3.14) 0.7578 98-122 108.95 104 / 589 0.87 (0.53-1.44) 0.5757 18 / 589 0.92 (0.38-2.24) 0.8481 >145 168.81 28 / 598 1.34 (0.68-2.66) 0.3805 17 / 598 0.86 (0.44-1.68) 0.6374 Cholesterol2 (mg/dL) 174-200 187.12 75 / 566 1 12 / 566 1 <174 153.28 214 / 602 4.40 (3.24-5.98) 0.0000* 33 / 602 4.18 (1.55-11.29) 0.0065* 200-227 212.54 47 / 569 0.65 (0.42-1.00) 0.0483* 18 / 569 3.11 (1.16-8.28) 0.0253* >227 256.36 16 / 614 0.21 (0.10-0.43) 0.0002* 18 / 614 3.31 (1.16-9.42) 0.0264* TG2 (mg/dL) 105-156 125.39 69 / 598 1 15 / 598 1 <75 58.39 136 / 579 1.31 (0.74-2.32) 0.3344 29 / 579 1.58 (0.55-4.55) 0.3855 75-105 89.07 106 / 580 1.28 (0.79-2.06) 0.2989 24 / 580 1.60 (0.68-3.80) 0.2701 >156 235.14 41 / 594 0.64 (0.34-1.21) 0.1619 13 / 594 0.75 (0.28-2.01) 0.5563 HgB2 (g/dL) >14.6 15.45 80 / 602 1 24 / 602 1 13.6-14.6 14.01 80 / 593 1.12 (0.73-1.73) 0.5822 14 / 593 0.71 (0.33-1.52) 0.3682 12.5-13.6 13.04 89 / 625 1.52 (0.97-2.39) 0.0667 17 / 625 0.99 (0.39-2.53) 0.9846 <12.5 11.35 103 / 531 1.40 (0.86-2.29) 0.1653 26 / 531 1.60 (0.60-4.25) 0.3358 MCHC2 (g/dL) >34.1 34.63 82 / 616 1 22 / 616 1 33.4-34.1 33.70 99 / 681 1.27 (0.73-2.19) 0.3812 21 / 681 0.84 (0.38-1.87) 0.6553 32.7-33.4 33.00 87 / 555 1.55 (0.87-2.77) 0.1330 19 / 555 1.02 (0.52-2.02) 0.9413 <32.7 31.84 84 / 499 1.30 (0.68-2.47) 0.4128 19 / 499 0.82 (0.33-2.08) 0.6710
Table 4. Risks of marginal or deficient vitamin E status as affected by BMI and some blood and serum biochemical parameters
Abbreviations: BMI, body mass index; LDL-C, low-density lipoprotein cholesterol; TG , triglycerides; HgB, hemoglobin; MCHC, mean corpuscular hemoglobin concentration. 1n/N: number of marginal or deficient/total number in this category. OR: odds ratio analyzed by
multiple logistic regression analysis weighted by SUDDAN. Plasma α-tocopherol <16.28 µM (7µg/mL); α-tocopherol/cholesterol ratio <2.8 µg/mg. 2Quantile in each category
also observed in this study (Table 4). The prevalence of deficiency decreased to 4.2% when α-tocopherol/cho-lesterol ratio was used as the indicator. It is difficult to compare the present results on vitamin E status with those of other studies due to different indicators and cut-off points used. The prevalence rate of vitamin E deficiency in the Taiwanese population, based on a plasma α-tocopherol/cholesterol + triglycerides ratio less than 1.59 µmol/mmol, was reported to be as low as 1.02% for adults aged over 19 in the NAHSIT 1993-1996.10 In this same study, the vitamin E deficiency prevalence rate estimated from 186 elderly (age >65) men and 176 elderly women was 0.13% and 0.84%, respectively, and the estimated mean (SE) plasma α-tocopherol was 20.0 (0.6) and 26.4 (2.3) µM respectively.10 Age, sex and strata differences in plasma vitamin E status were observed in NAHSIT 1993-1996.10 We also observed significant effects of sex and strata, but not that of age in the present Elderly NAHSIT survey, possibly because of a smaller range of age distribution in this elderly specific study. In contrast, the age-adjusted mean (SE) of plasma α-tocopherol and prevalence of deficiency (less than 20µM) in adults aged 18 years or over were 26.6 (0.2) and 27% respectively in the US NHANES III.11
The known association of plasma α-tocopherol with serum lipids was also observed in this study. It is of note that elderly subjects with a serum cholesterol level higher than 200 or lower than 174 mg/dL all showed higher risk of a low or inadequate α-tocopherol/cholesterol ratio. However, elderly subjects with higher serum cholesterol seem to have a lower risk of marginal or deficient plasma α-tocopherol concentration, as observed from the results of multiple logistic regression analysis (Table 4). This result strengthens the importance of maintaining optimal serum cholesterol for achieving satisfactory vitamin E status. Since a role for vitamin E in the prevention of car-diovascular disease has been implicated, this observation may be of significance to public health.
In conclusion, the plasma vitamin A status of Taiwan’s elderly population is satisfactory. The mean values of plasma α-tocopherol concentration and α-tocopherol/ cholesterol ratio were all comparable to those of USA adults observed in the NHANES III. The risk of marginal or deficient plasma α-tocopherol concentration was higher in elderly men, in elderly persons with lower or elevated serum cholesterol, and in elderly persons living in certain strata particularly the eastern and central areas.
References
1. Food and Nutrition Board, Institute of Medicine: Vitamin E. In: Dietary Reference Intakes for Vitamin C, Vitamin E, Selenium, and Carotenoids. 2000 National Academy Press, Washington, D.C.
2. Diaz MN, Frei B, Vita JA, Keaney JF Jr.. Antioxidants and atherosclerotic heart disease. N Engl J Med 1997; 337: 408-16.
3. Byers T, Perry G. Dietary carotenes, vitamin C, and vitamin E as protective antioxidants in human cancers. Ann Rev Nutr 1992; 12: 139-59.
4. Pan WH, Hung YT, Shaw NS, Lin W, Lee SD, Chiu CF, Lin MC, Chen SY, Hong CM, Huang TY, Chang HY, Tu SH, Chang YH, Yeh WT, Su SC. Elderly Nutrition and Health Survey in Taiwan (1999–2000): research design, methodology and content. Asia Pac J Clin Nutr 2005; 14 (3): 203-210.
5. Miller KW, Lorr NA, Yang CS. Simultaneous determina-tion of plasmaretinol, α-tocopherol, lycopene, α-carotene, and β-carotene by high-performance liquid chromato-graphy. Anal Biochem 1984; 138: 340-345.
6. Sauberlich HE, Skala, JH, Dowdy RP. Laboratory Tests for the Assessment of Nutritional Status. CRC Press. Cleveland, Ohio 1974; 7-80.
7. Horwitt MK, Harvey CC, Dahm CH, Searcy MT. Relationship between tocopherol and serum lipid levels for the determination of nutritional adequacy. Ann. NY Acad. Sci 1972; 203: 223-236.
8. Pan WH, Chang YH, Chen JY, Wu SJ, Tzeng MS, Kao MD. Nutrition and Health Survey in Taiwan (NAHSIT) 1993-1996: Dietary nutrient intakes assessed by 24-Hour Recall. Nutr Sci J 1999; 24: 11-39.
9. Wu SJ, Chang YH, Wei IL, Kao MD, Lin YC, Pan WH. Intake levels and major food sources of energy and nutrients in the Taiwanese elderly. Asia Pac J Clin Nutr 2005; 14 (3): 211-220.
10. Kang MJ, Lin YC, Yeh WH, Pan WH. Vitamin E status and its dietary determinants in Taiwanese: Results of the Nutrition and Health Survey in Taiwan 1993-1996. Eur J Nutr 2004; 43: 86-92.
11. Ford ES, Sowell A. Serum α-Tocopherol Status in the United States Population: Findings from the Third National Health and Nutrition Examination Survey. Am J Epidemiol 1999; 150: 290-300.