PLEASE SCROLL DOWN FOR ARTICLE
On: 16 April 2009Access details: Access Details: [subscription number 908165531] Publisher Taylor & Francis
Informa Ltd Registered in England and Wales Registered Number: 1072954 Registered office: Mortimer House, 37-41 Mortimer Street, London W1T 3JH, UK
International Journal of Production Research
Publication details, including instructions for authors and subscription information:
http://www.informaworld.com/smpp/title~content=t713696255
Aligning manufacturing flexibility with environmental uncertainty: evidence from
high-technology component manufacturers in Taiwan
Shih-Chia Chang; Neng-Pai Lin; Chwen Sheu
Online Publication Date: 20 December 2002
To cite this Article Chang, Shih-Chia, Lin, Neng-Pai and Sheu, Chwen(2002)'Aligning manufacturing flexibility with environmental uncertainty: evidence from high-technology component manufacturers in Taiwan',International Journal of Production
Research,40:18,4765 — 4780
To link to this Article: DOI: 10.1080/00207540210157196 URL: http://dx.doi.org/10.1080/00207540210157196
Full terms and conditions of use: http://www.informaworld.com/terms-and-conditions-of-access.pdf
This article may be used for research, teaching and private study purposes. Any substantial or systematic reproduction, re-distribution, re-selling, loan or sub-licensing, systematic supply or distribution in any form to anyone is expressly forbidden.
The publisher does not give any warranty express or implied or make any representation that the contents will be complete or accurate or up to date. The accuracy of any instructions, formulae and drug doses should be independently verified with primary sources. The publisher shall not be liable for any loss, actions, claims, proceedings, demand or costs or damages whatsoever or howsoever caused arising directly or indirectly in connection with or arising out of the use of this material.
Aligning manufacturing ¯exibility with environmental uncertainty:
evidence from high-technology component manufacturers in Taiwan
SHIH-CHIA CHANGy, NENG-PAI LINz and CHWEN SHEU}*
While ¯exibility improvement is among the top concerns of manufacturing managers, managers are advised to choose the dimensions of ¯exibility they want in their plants. This study investigates the strategic choice of aligning ¯exibility development with the external environment that manufacturing managers face. Considering the nature of the high-technology industry in Taiwan, we measure environmental uncertainty based on the dimensions of customer demand, supply, competitors and product technology. Empirical data were collected from manufacturing ®rms in Taiwan. We then applied path analysis to examine the eect of aligning three types of ¯exibility: product mix, new product and volume with speci®c dimensions of environmental uncertainty. The results indicate that the matching of manufacturing ¯exibility with environ-mental uncertainty is necessary to ensure pro®t and sales performance. When faced with certain environmental stimuli, management should choose to empha-size and develop particular manufacturing ¯exibility.
1. Introduction
Over the last decade, manufacturing companies have faced both increasing tech-nology innovation and more competitive markets. Constantly changing techtech-nology induces product and process innovations, which provide customers with more choices and manufacturers with more ways to compete. All of those changes ulti-mately increase the complexity and uncertainty of the manufacturing environment and create new challenges to management. For instance, the currently popular supply chain management is mostly motivated by the availability of new information technology, such as enterprise resource planning systems.
The literature has suggested the development of manufacturing ¯exibility to deal with the constantly changing and increasingly uncertain manufacturing environ-ment. Many believe that high manufacturin g ¯exibility could enable ®rms to respond to rapid market changes quicker with lower eort and cost. Flexibility has become an eective weapon to gain competitive advantage in an uncertain manufacturing environment (De Meyer et al. 1989, Gerwin 1993, Jordan and Graves 1995, Beach et
al. 2000). In the past, many studies have investigated the impact of external environmental uncertainties on the level of manufacturing ¯exibility and thus on manufacturing performance. This study examines the relationship between environmental uncertainty and manufacturing ¯exibility from a dierent aspect.
International Journal of Production ResearchISSN 0020±7543 print/ISSN 1366±588X online # 2002 Taylor & Francis Ltd http://www.tandf.co.uk/journals
DOI: 10.1080/00207540210157196
Revision received February 2002.
{ Department of Business Administration, National Taipei College of Business, Taipei, Taiwan, ROC.
{ School of Management, National Taiwan University, Taipei, Taiwan, ROC. } Department of Management, Kansas State University, Manhattan, KS 66506, USA. * To whom correspondence should be addressed. e-mail: csheu@ksu.edu
We take into consideration the multi-dimensional nature of both ¯exibility and environmental uncertainty and examine the one-to-one relationship between these two factors. The premise is that organizations can be ¯exible in some ways and less ¯exible in others (Suarez et al. 1996). Speci®cally, managers may have to choose the dimension in which they want their plants to be ¯exible. Environmental uncertainty could be the factor that determines this important strategic choice. In other words when faced with certain environmental stimuli, management should choose to emphasize and develop particular sets of manufacturing ¯exibility. Therefore, the purpose of this study is to map the relationship between the dimensions of manu-facturing ¯exibility and uncertainty. We are interested in how dierent environmen-tal uncertainty dimensions (demand, supply, competition and technology) link with speci®c types of manufacturing ¯exibility such as new products, volume and product mix. Furthermore, this study tests the eectiveness of such mapping on business performance. Theoretically, the alignment of a particular environmental uncertainty dimension with a speci®c type of manufacturing ¯exibility should improve business performance.
We ®rst review and summarize the theoretical relationship between manufactur-ing ¯exibility and environmental uncertainty with the emphasis on de®nition and measurement . We then present the research design, including the basic model, hypotheses and statistical methods. Finally, statistical results and discussions are oered.
2. Literature review
This section reviews previous studies on manufacturing ¯exibility, environmental uncertainties and their relationship.
2.1. Manufacturin g ¯exibility
Manufacturin g ¯exibility was originally de®ned as the ability of a manufacturing ®rm to respond to external environmental changes (Mandelbaum 1978). Recent research provides a more speci®c de®nition of manufacturing ¯exibility. For exam-ple, Upton (1994) de®nes manufacturing ¯exibility as the ability to respond to envir-onmental changes with less time and cost. Other researchers suggest that manufacturing ¯exibility is a multi-dimensional construct and could be measured in many dierent ways (Sethi and Sethi 1990, Gerwin 1993). Based on dierent logics for interpreting its various dimensions, manufacturing ¯exibility can be classi®ed in many dierent ways. De Toni and Tonchia (1998) provide a comprehensive review of various classi®cation schemes. For example, one could classify manufacturing ¯ex-ibility by the variations such as process, product or production volume.
For the purpose of this study we chose to review manufacturing ¯exibility in a manner relating ¯exibility to environmental uncertainty. Speci®cally, several studies have classi®ed manufacturing ¯exibility into internal and external ¯exibility (Lynch and Cross 1991, Chen et al. 1992, Upton 1994). External manufacturing ¯exibility is relative to the need of customer requirements. Examples of external manufacturing ¯exibility are new product ¯exibility, product mix ¯exibility and volume ¯exibility. It is usually recognized and perceived better since it directly aects a ®rm’s competi-tiveness. On the other hand, internal manufacturing ¯exibility is relative to the need to meet customer requirements eciently, and it is not directly related to market demand and environmental uncertainties. Examples of internal manufacturing ¯exibility are machine and routing ¯exibility. Generally, its impact
on a ®rm’s market competitiveness is rather indirect and is usually not recognized by customers.
2.2. Environmental uncertainties
Many studies in organizationa l theory have addressed the issue of external envir-onmental uncertainty. Most of these studies delve into the issues of how ®rms should predict elements of their environment, such as competitors, customers and suppliers (Burns and Stalker 1961, Duncan 1972, Downey and Slouch 1975). Overall, the literature suggests that ®rms should adopt a more organic structure to cater to a more complex environment where jobs are less specialized and more complex. On the other hand, ®rms should apply a mechanistic structure to a more predictable envir-onment with greater subdivision of tasks and simpler job assignments.
Business strategy literature provides various approaches for measuring environ-mental uncertainty. Some studies suggest the use of objective measures (Dean and Snell 1996, Kotha and Orne 1989, Wernerfelt and Karnai 1987). For example, uncertainty could be measured based on four dimensions: demand, supply, compe-titive and external. On the other hand, another group of researchers proposes the perceptual measure of environmental uncertainty (Duncan 1972, Bourgeois 1980, Swamidass and Newell 1987). They suggest that the perceptions of the environment are more important than the actual environment. Managers will make decisions based on their perceptions of the degree of environmental uncertainty.
2.3. Environmental uncertainty and manufacturing ¯exibility
While this paper investigates the use of manufacturing ¯exibility to address environmental uncertainty, there are many other approaches that managers can take. For instance, March and Simon (1958) suggest the use of `organizationa l slack’ to provide excess resources to cope with environmental uncertainties. Alternatively, managers can invoke some form of environmental control. Sethi and Sethi (1990, p. 294) provide an automated transfer line analogy, suggesting that `work in progress is presented, by means of transfer mechanisms, to successive machine tools in proper position to be grasped and worked (i.e. environmental control), eliminating the sensory and manipulative functions (i.e. ¯exibility compo-nent) of workers who loaded the machines by hand’. More recently, Pagell and Krause (1999) found that manufacturing ®rms developed various competitive strategies to reduce the impact of environmental uncertainty.
In general, there are two research issues pertaining to the relationship between uncertainty and manufacturing ¯exibility (Pagell and Krause 1999). First, what is the speci®c one-to-one relationship between these two multi-dimensional variables? Second, does the ®t between external uncertainty and types of manufacturing ¯ex-ibility lead to better business performance?
Again, the literature in organizational theory has extensively investigated the issue of aligning internal aspects of the organization with the external environment (Venkatraman 1989, Venkatraman and Prescott 1990, Bluedorn 1993). Many opera-tions managemen t studies also con®rmed the notion of aligning internal structure with an uncertain external environment. They suggest that manufacturing companies should develop ¯exibility for the sake of dealing with short product life cycles and environmental uncertainty more eectively (Mascarenhas 1981, Correa 1994). Swamidass and Newell (1987) and Tombak and De Meyer (1988) ®nd that an increase in manufacturing ¯exibility resulting from higher environmental uncertainty
would lead to better business performance . Gerwin (1993) and Beach et al. (2000) support the eect of environmental uncertainty on manufacturing ¯exibility. Manufacturin g ®rms should develop a speci®c type of manufacturing ¯exibility corresponding to the unique features of the external environments. In other words, a ®t between the type of manufacturing ¯exibility and factors contributing to external environmental uncertainty is necessary. Managers should examine their external environments when making decisions to develop manufacturing ¯exibility. Braglia and Petroni (2000) empirically con®rm the relationship between these two factors but oer no speci®c one-to-one relationship or comment the eectiveness of such alignment.
Contrary to previous research, Pagell and Krause (1999) study users of advanced manufacturing technologies (AMT) and ®nd no relationship between uncertainty and manufacturing ¯exibility. The level of manufacturing ¯exibility (a composite measure of new product introduction, modi®cation and product mix ¯exibility) is not associated with the level of environmental uncertainty. Moreover, the results of Pagell and Krause (1999) showed that ®rms do not bene®t from the matching of internal manufacturing ¯exibility with environmental uncertainty. Many manufac-turing ®rms, in response to external environmental uncertainty, chose to focus on other competitive priorities rather than ¯exibility. Badri et al. (2000) observe a strong positive relationship between increased uncertainty and an increased emphasis on ¯exibility as a manufacturing strategy. Nevertheless, both high and low performers in their sample were responding to increased uncertainty by increasing their level of ¯exibility, thus making it impossible to determine the true performance bene®ts, if any, of responding to uncertainty with ¯exibility.
In summary, the literature holds inconsistent views on the relationship between manufacturing ¯exibility and environmental uncertainty and the notion of `align-ment’. There are several reasons for this inconsistency. One of the primary reasons is that the levels of uncertainty and manufacturing ¯exibility are often de®ned and measured in dierent ways. For instance, not every study incorporated volume ¯ex-ibility and/or new product ¯ex¯ex-ibility even though both are recognized as important types of ¯exibility in manufacturing today. Some studies focus on internal routing and machine ¯exibility, while others look into external manufacturing ¯exibility such as mix and new products. In the case of external environmental uncertainty, some studies use managerial perceptions to produce subjective and perceptual measures. On the other hand, many researchers adopt dierent environmental factors to create objective measures of uncertainty. It is no wonder that the relationship of manufac-turing ¯exibility and uncertainty is not conclusive.
Also lacking in the literature is empirical veri®cation of the one-to-one relation-ship between types of manufacturing ¯exibility and dimensions of environmental uncertainty. Suarez et al. (1996) support the need for choosing dimensions along which ®rms want their systems to be ¯exible. They suggested that management could make the strategic choice based on the environment. Given the multi-dimensional nature of both manufacturing ¯exibility and uncertainty, the exact relationship between the two needs to be de®ned more precisely. For example, constantly chan-ging customer demand would lead to short product life cycles, which creates a great degree of uncertainty in a ®rm’s operations. This type of uncertainty, in turn, drives ®rms to develop new product ¯exibility but not volume ¯exibility. The alignment between manufacturing ¯exibility and uncertainty must be assessed based on the one-to-one relationship rather than on aggregate level (e.g. a high level of
turing ¯exibility versus a high level of uncertainty). It is important that management recognize such an alignment, so that companies can allocate resources to develop the appropriate type of manufacturing ¯exibility to deal with particular external uncertainty.
3. Model building and hypothesi s
This paper intends to map the relationship between types of manufacturing ¯exibility, various environmental uncertainty dimensions and business performance. Based on our observation from high-technolog y industries (PCB, personal compu-ters, monitors and motherboard) in Taiwan, we found three types of manufacturing ¯exibility to be most critical to a ®rm’s competitive advantage. They are new product
¯exibility, mix ¯exibility and volume ¯exibility.Based on Sethi and Sethi (1990) and Suarez et al. (1996), new product ¯exibility is the ability to introduce new products, volume ¯exibility is the ability to operate pro®tably at dierent overall output levels and product mix ¯exibility is the ability to manufacture a variety of products within a short period of time. These de®nitions are also adopted by many other studies (e.g. Jaikumar 1986, Boyer and Leong 1996). As an example, almost all customer orders for monitors in Taiwan are from large overseas PC companies such as IBM, Apple and Hewlett Packard. Subject to the overall economy, those large clients frequently change their contract manufacturing orders (in quantity and delivery dates) to absorb demand uncertainties from end users. Such changes have forced their con-tract manufacturer s to develop volume ¯exibility through outsourcing and overtime. In the case of environmental uncertainty, we use Wernerfelt and Karani’s (1987) de®nition to measure the level of uncertainty: demand, supply, competitive and technology. We did not include the three uncertainty dimensions (union, public view and government regulations) suggested by Duncan (1972), since they are irre-levant in Taiwanese industry. The procedure for measuring these four dimensions is described in the next section. Overall, our de®nition of environmental uncertainty is consistent with the environment of the high-technolog y industry in Taiwan. For example, the PCB industry is known for being highly capital- and technology inten-sive. Most PCB ®rms are contract manufacturers , and they all have to compete in the open market subject to a great degree of uncertainty from customers and competi-tors. Since Taiwan lacks natural resources, the majority of components are imported from overseas, which creates a longer and more uncertain supply lead-time. Finally, the technology used in PCB industry (e.g. surface mount) is highly innovative and programmable and thus oers the opportunity to make a high variety of board designs requested by clients. Overall, this industry faces a very dynamic environment from all four dimensions. The concept of ¯exibility is de®nitely nothing new to manufacturers.
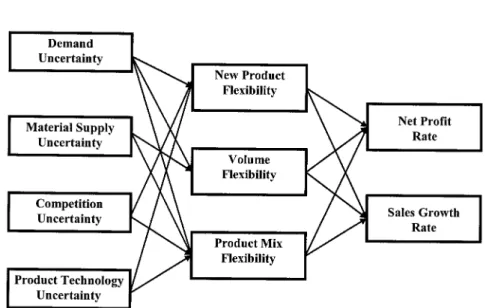
Figure 1 describes the research hypothesis relating to the relationship between uncertainty, manufacturing ¯exibility, and business performance. In the rest of this section we summarize the theoretical relationship in each linkage, based on the observation from a high-technolog y industry as well as the literature.
3.1. Customer demand uncertainty and manufacturin g ¯exibility
The high-technology industry is known for its highly uncertain customer demand in terms of product options and volume. The level of uncertainty is dicult to handle for original equipment manufacturers (OEM) in Taiwan considering the frequent changes of delivery schedule from overseas PC companies. Theoretically, the
ture has supported the relationship between demand uncertainty and various types of manufacturing ¯exibility. Chen et al. (1992) indicate that manufacturing ®rms are speeding up the new product development process to introduce new products to the market in order to satisfy customers’ constantly changing desires toward product features. Gerwin (1993) point out that it is important for ®rms to oer various product options to stay competitive. Sethi and Sethi (1990) suggest the importance of developing the capability of adjusting the level of production, thereby responding to highly uncertain market demands. Overall, demand uncertainty (including volume, options and features) motivates manufacturing ®rms, which in turn leads to higher levels of new product ¯exibility, product mix ¯exibility and volume ¯ex-ibility. Accordingly, we propose the following research hypotheses.
HD1: Customer demand uncertainty leads to higher new product ¯exibility. HD2: Customer demand uncertainty leads to higher product mix ¯exibility. HD3: Customer demand uncertainty leads to higher volume ¯exibility.
3.2. Supply uncertainty and manufacturing ¯exibility
Since some of the critical components of high-technolog y products come from other countries, such as Malaysia and Japan, high-technolog y ®rms in Taiwan also face a high degree of supply uncertainty. Dixon (1992) observes that the capability of oering various product options enables ®rms to buer against a temporary shortage or ¯uctuations of raw material and component supplies. Krajewski and Ritzman (1999) argue that manufacturing ®rms should develop capacity cushions to absorb quality problems and delivery inconsistency from vendors. Accordingly, we propose the following research hypotheses.
Figure 1. Basic model of relationshi between environmental uncertainty, manufacturing ¯exibility and business performance.
HS1: Supply uncertainty leads to higher product mix ¯exibility. HS2: Supply uncertainty leads to higher volume ¯exibility. 3.3. Competitor uncertainty and manufacturing ¯exibility
In addition to local competition in the same industry, Taiwan has received increasing competition from nearby Asian countries such as Korea and China in high-technolog y products. Ward et al. (1995) examine the relationship between busi-ness strategy and corporate environments from Singapore manufacturers . They sug-gest developing the capability of oering various product options in dierent market segments. Such capability can then better respond to competitor’s strategy. As the market uncertainty increases due to the addition of new competitors or the exit of existing ®rms, ®rms should continue to oer new products to stay ahead of their competitors (Chen et al., 1992, Kerin et al. 1992). Accordingly, we propose the following research hypotheses.
HC1: Competitor uncertainty leads to higher new product ¯exibility. HC2: Competitor uncertainty leads to higher product mix ¯exibility. 3.4. Product technology uncertainty and manufacturin g ¯exibility
Gerwin (1993) and Lieberman and Montgomery (1988) ®nd that product tech-nology innovation triggers development and introduction of new products. Firms should develop new products to pre-empt the market. Often, new market opportu-nities come with technological innovation. It is important that ®rms apply new technology to oer various product options to take advantage of new opportunities (Kekre and Srinivasm 1990, Chen et al. 1992). Accordingly, we propose the follow-ing research hypotheses.
HT1: Product technology uncertainty leads to higher new product ¯exibility. HT2: Product technology uncertainty leads to higher product mix ¯exibility. 3.5. Manufacturin g ¯exibility and business performanc e
Many studies suggest that manufacturing ¯exibility contributes to business per-formance including ®nancial (e.g. return on assets, net pro®t) and non-®nancial performance (e.g. market share, sales growth). For example, ®rms are able to increase their market share by oering various product options (Bolwijn and Kumpe 1990, 1991). Swamidass and Newell (1987), Kekre and Srinivasan (1990) and Gupta and Somers (1996) con®rm the positive eect of product mix and new product ¯exibility on sales growth and net pro®t rate. Finally, Gerwin (1993), Gupta and Somers (1996) and Tannous (1996) support the positive eect of volume ¯ex-ibility on sales growth and net pro®t, while Pagell and Krause (1999) ®nd an insig-ni®cant relationship. In this study, we chose net pro®t and sales growth rate to measure business performance due to data availability and the suggestions from the CEOs interviewed. According to those previous studies, we suggest the following hypotheses.
HP1: New product ¯exibility leads to higher pro®t.
HP2: New product ¯exibility leads to higher sales growth rate. HP3: Product mix ¯exibility leads to higher pro®t.
HP4: Product mix ¯exibility leads to higher sales growth rate. HP5: Volume ¯exibility leads to higher pro®t.
HP6: Volume ¯exibility leads to higher sales growth rate.
4. Research design 4.1. Survey
A survey methodology was used to collect data pertaining to the research hypothesis. The sample was randomly selected from 1000 Manufacturin g Firms in
Taiwan 1997±1998. A ®eld test of the survey instrument was conducted by meeting with manufacturing executives, vice presidents or presidents from four companies. 296 questionnaires were mailed to top executives (Vice President, General Managers or Plant Managers ) in selected SBUs in high-technolog y manufacturing , including ®rms from personal computers, PCB, monitors and motherboard industries. These four industries have similar market structure, and they are subject to similar envir-onmental uncertainty. Most ®rms are OEMs of large computer companies in the United States or Europe. The homogeneity of the nature of their operations envir-onment and production processes reduces the possibility of contamination from multiple industry studies (Swamidass and Newell 1987). 103 questionnaire s were returned and 87 were valid samples for statistical analysis. Among the 87 question-naires returned, 25 were from the personal computer industry, 27 from motherboard companies, 18 from monitor manufacturers and 17 from PCB manufacturers .
A copy of the questionnaire is included in the Appendix. The questionnaires included multi-item instruments to measure uncertainty and manufacturing ¯exibil-ity variables. Questions related to the four dimensions of environmental uncertainty were based on a seven point Likert scale. Managers were asked to rate, on a 16-item instrument, the perceived uncertainty in their environment between the extremes of always predictable and never predictable. Ratings assigned by top executives to the items in the uncertainty instrument were weighted by the average importance assigned to the respective item in a separate instrument (Swamidass and Newell 1987). This subjective measurement of environmental uncertainty is consistent with many previous studies (Lawrence and Lorsch 1969, Duncan 1972, Swamidass and Newell 1987, Miller 1993). The assumption is that only top executives, based on their experience and intuition, are in a position to judge the impact of various dimensions of their environment.
For the three types of manufacturing ¯exibility, we measured new product ¯ex-ibility by the total number of new models made in two years (Jaikumar 1986, Dixon 1992). Product mix ¯exibility is measured as the total number of distinct part/pro-duct families (i.e. the number of PCB models and sizes made) made in two years (Dixon 1992). Volume ¯exibility is measured as the ratio of production volume ¯uctuation and unit cost while the production volume ¯uctuation is computed as the variance of monthly production (Suarez et al. 1996).
Finally, for business performance, we asked about sales performance and ®nan-cial performance. Sales performanc e was measured by sales growth rate. Finan®nan-cial performance was measured in terms of net pro®t. Similar to the Vickery et al. (1993) study, each measure was assessed in three ways.
(1) The ®rm’s performance relative to its major competitors,
(2) The ®rm’s performance relative to its historic performance and/or company goals, and
(3) The actual values.
4.2. Statistical methods
There were two stages of statistical analysis. In the ®rst stage we performed factor analysis on environmental uncertainty items to investigate the dimensions of envir-onmental uncertainty. The results were then used for path analysis, which veri®ed the theoretical relationship presented in ®gure 1. The path model provides a method for developing explicit relationships within the proposed model and verifying its structure. Several studies have suggested the use of path analysis to analyse the relationship between a precursor variable such as environment and strategic choice (Ward et al. 1995). Hair et al. (1998) recommend an absolute minimum sample size of 50 or ®ve observations for each estimated parameter. Accordingly, this study has enough samples to conduct the path analysis.
5. Statistical results
5.1. Results of factor analysis
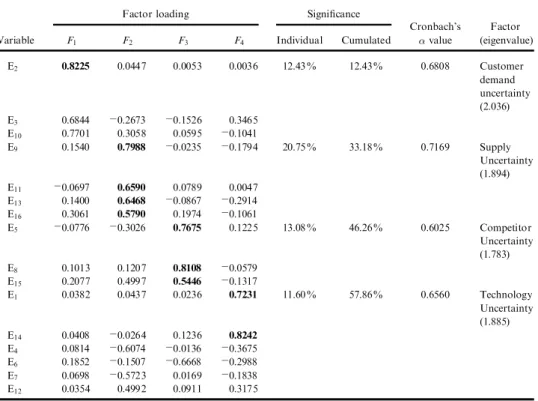
Table 1 presents the results of the varimax factor analysis. The factor rotation yielded four dimensions from a total of 16 variables of environmental uncertainty. Numbers shown in the table are the environmental uncertainty variables’ factor loading (relationships) to the four dimensions identi®ed. Highlighted numbers are the individual question’s factor loading (relationships) to the four major dimensions of the questionnaire. The Bartlett test of sphericity was used to assess the overall signi®cance of the correlations among the strategy variables. All eigenvalues from the three factors were greater than 1.0. All standardized factor loadings were 0.50 or above, the majority falling above 0.70; thus, the loadings can be considered large
Variable
Factor loading Signi®cance
Cronbach’s ¬value Factor (eigenvalue) F1 F2 F3 F4 Individual Cumulated E2 0.8225 0.0447 0.0053 0.0036 12.43% 12.43% 0.6808 Customer demand uncertainty (2.036) E3 0.6844 ¡0.2673 ¡0.1526 0.3465 E10 0.7701 0.3058 0.0595 ¡0.1041 E9 0.1540 0.7988 ¡0.0235 ¡0.1794 20.75% 33.18% 0.7169 Supply Uncertainty (1.894) E11 ¡0.0697 0.6590 0.0789 0.0047 E13 0.1400 0.6468 ¡0.0867 ¡0.2914 E16 0.3061 0.5790 0.1974 ¡0.1061 E5 ¡0.0776 ¡0.3026 0.7675 0.1225 13.08% 46.26% 0.6025 Competitor Uncertainty (1.783) E8 0.1013 0.1207 0.8108 ¡0.0579 E15 0.2077 0.4997 0.5446 ¡0.1317 E1 0.0382 0.0437 0.0236 0.7231 11.60% 57.86% 0.6560 Technology Uncertainty (1.885) E14 0.0408 ¡0.0264 0.1236 0.8242 E4 0.0814 ¡0.6074 ¡0.0136 ¡0.3675 E6 0.1852 ¡0.1507 ¡0.6668 ¡0.2988 E7 0.0698 ¡0.5723 0.0169 ¡0.1838 E12 0.0354 0.4992 0.0911 0.3175
Table 1. Results of factor analysis.
(Bollen and Lennox 1991). The reliability of each construct was measured with Cronbach’s ¬. The coecient alpha values for the three factors are 0.6808, 0.7169, 0.6025 and 0.6560, respectively. In general, all three dimensions are very clear, showing a signi®cant relationship between those dimensions and the factor loading. The four factors found in the results are summarized as follows.
Factor 1 (F1): Customer uncertainty
The ®rst factor consists of three variables: E2 (change of custo-mer ¯avour in product features), E3 (possibility and predictabil-ity of customer switching to competitors) and E10 (change of customer demand volume).
Factor 2 (F2): Supply uncertainty
The second factor includes four variables: E9 (improvement of vendor quality), E11 (possibility of increasing vendor production capacity), E13 (possibility of changing vendor delivery date) and E16 (possibility of vendor quality variation)
Factor 3 (F3): Competitor uncertainty
The third dimension includes three variables: E5 (possibility and predictability of competitors changing their price), E8 (possibi-lity and predictabi(possibi-lity of competitors changing marketing strat-egy) and E15 (possibility and predictability of entry/exit of new/ current competitors).
Factor 4 (F4): Product technology uncertainty
The last factor includes two variables: E1 (change of core pro-duction technology) and E14 (change of supporting technology). 5.2. Results of path analysis
Path analysis is used empirically to ascertain the directions and magnitude of the causal relationships proposed in ®gure 1. Before we ran the path analysis, we exam-ined the correlation matrix for the data set. The correlation matrix is displayed in table 2, which indicates that the correlations between pairs of variables were insig-ni®cant.
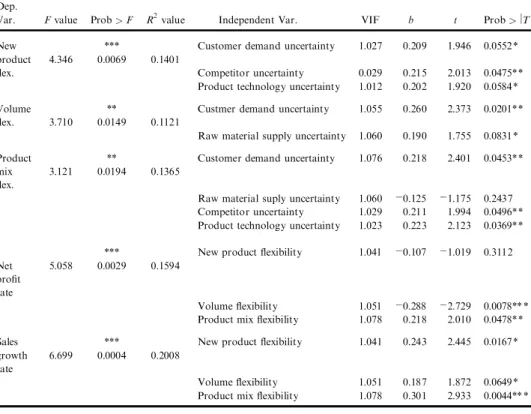
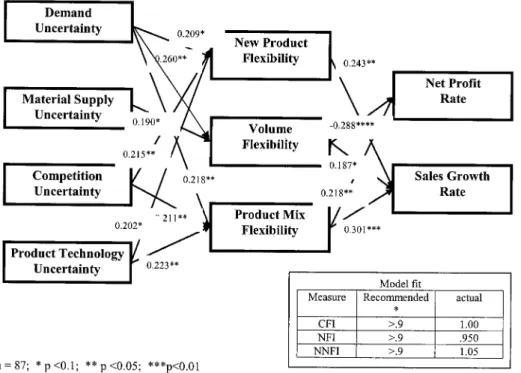
Path analysis was performed for the entire data set on the model presented in ®gure 1. Hair et al. (1998) note that when testing casual models, researchers who have good theory are able to use more precise tests (one-tail tests as opposed to two-tail tests). For the majority of the links in our model we hypothesize a speci®c relationship; hence, we used one-tail tests for signi®cance. Table 3 shows the results of this analysis. Additionally we reported three measures of ®t: CFI, Normed Fit Index (NFI) and Non-Normed Fit Index (NNFI). The model with all signi®cant paths is presented as ®gure 2. The rest of this section summarizes the results of the path analysis.
5.2.1. Environmental uncertainty and manufacturin g ¯exibility
According to table 3 and ®gure 2, demand uncertainty, competition uncertainty and technology uncertainty all present positive relationships with new product
¯exibility. This result supports hypotheses HD1, HC1 and HT1. The characteristics of high-technolog y industry (typi®ed by short product life cycle, severe competition and constant technology innovation) force companies to research and develop new
(a) Manufacturing ¯exibility
Demand Supply Competition Technology uncertainty uncertainty uncertainty uncertainty
Demand 1.0 uncertainty Supply uncertainty 0.186 1.0 (0.885) Competition 0.182 0.043 1.0 uncertainty (0.011) (0.694) Technology ¡0.082 0.109 0.068 1.0 uncertainty (0.451) (0.317) (0.534) (b) Manufacturing ¯exibility
New product Volume Product mix ¯exibility ¯exibility ¯exibility
New product 1.0
¯exibility
Volume ¯exibility 0.066 (0.544) 1.0
Product mix 0.176 (0.102) ¡0:177 1.0
¯exibility (0.101)
Table 2. Correlation matrix
Dep.
Var. Fvalue Prob > F R2value Independent Var. VIF b t Prob > jTj
New *** Customer demand uncertainty 1.027 0.209 1.946 0.0552* product 4.346 0.0069 0.1401
¯ex. Competitor uncertainty 0.029 0.215 2.013 0.0475**
Product technology uncertainty 1.012 0.202 1.920 0.0584* Volume ** Custmer demand uncertainty 1.055 0.260 2.373 0.0201** ¯ex. 3.710 0.0149 0.1121
Raw material supply uncertainty 1.060 0.190 1.755 0.0831* Product ** Customer demand uncertainty 1.076 0.218 2.401 0.0453** mix 3.121 0.0194 0.1365
¯ex.
Raw material suply uncertainty 1.060 ¡0.125 ¡1.175 0.2437 Competitor uncertainty 1.029 0.211 1.994 0.0496** Product technology uncertainty 1.023 0.223 2.123 0.0369** *** New product ¯exibility 1.041 ¡0.107 ¡1.019 0.3112 Net 5.058 0.0029 0.1594
pro®t rate
Volume ¯exibility 1.051 ¡0.288 ¡2.729 0.0078** * Product mix ¯exibility 1.078 0.218 2.010 0.0478** Sales *** New product ¯exibility 1.041 0.243 2.445 0.0167* growth 6.699 0.0004 0.2008
rate
Volume ¯exibility 1.051 0.187 1.872 0.0649* Product mix ¯exibility 1.078 0.301 2.933 0.0044** *
* P < 0:1; ** P < 0:05; *** P < 0:01
Table 3. Results of path analysis.
products to stay competitive. Next, the uncertainty of customer demand drives the development of volume ¯exibility, which supports hypothesis HD3. Speci®cally, ®rms able to adjust production levels are able to respond to demand uncertainty better. As discussed earlier, most OEM ®rms in Taiwan constantly face the uncertainty of order cancellation or quantity change from overseas customers. Working overtime and outsourcing are very common ways to cope with demand changes without increasing cost or sacri®cing quality and delivery. Finally, as vendor delivery becomes unreli-able, ®rms are forced to increase volume ¯exibility through establishing outsourcing. This ®nding supports hypothesis HS2.
In the case of product mix ¯exibility, demand uncertainty, competitor uncertainty and technology uncertainty all present signi®cant relationships. This is consistent with Kekre and Srinivasm (1990), stating that the capability of oering various product options is an eective way to take new market opportunities presented by technology innovation. Additionally, Suarez, et al. (1996) asserted that the develop-ment of product mix ¯exibility could provide the `cushion’ eect to lessen production instability from customer demand and competition. Overall, the statistical results support hypotheses HD2, HS1 and HC2.
The only insigni®cant relationship found was the eect of supply uncertainty on product mix ¯exibility (HS1) (see table 3). The original rationale of this relationship was that the uncertainty of procuring necessary components from vendors could force ®rms to oer dierent product options to meet customer demand (Dixon 1992). In this case, since most ®rms are contract manufacturers , they must produce to the exact product speci®cations requested by clients. Having the capability of oering a high variety of product options does not mitigate the negative impact from supply uncertainty.
Figure 2. Model with signi®cant relationships n ˆ 87; * p < 0:1; ** p < 0:05; *** p < 0:01
5.2.2. Manufacturin g ¯exibility and business performance
The results in table 3 show that, with the exceptions of the relationship between new product ¯exibility and net pro®t (HP1), all relationships between manufacturing ¯exibility and two performance measures (HP2±HP6) are signi®cant. New product ¯exibility is related to sales growth but not to net pro®t. While new product intro-duction increases sales, it could not generate enough revenue to oset enormous R&D expenses in the short term. We also suspect that the generally lower pro®t across the high-technology industries in 1997 and 1998 is attributed to this insignif-icant relationship.
6. Implications and conclusions
Empirical studies in manufacturing ¯exibility have not investigated the alignment of speci®c dimensions of environmental uncertainty with types of manufacturin g ¯exibility. This study examined the relationship between environmental uncertainty, manufacturing ¯exibility and business performance in high-technology industries. Using the data collected from 87 high-technology manufacturing ®rms in Taiwan, we analysed the eect of aligning three types of manufacturing ¯exibility: product mix, new product and volume with speci®c dimensions of environmental uncertainty. Matching manufacturing ¯exibility with dimensions of environmental uncertainty is necessary to ensure pro®t and sales performance. As ®rms face challenges of various uncertainties from the market, suppliers, competitors and technology, they must invest and develop speci®c types of manufacturing ¯exibility to respond.
One thing we learned from this study worth noting by managers and researchers was that the relationship between uncertainty and manufacturing ¯exibility may be industry dependent. Pagell and Krause (1999) studied users of advanced manufac-turing technologies (AMT) and found no relationship between the two issues. Unlike the high-technolog y ®rms sampled in this study, AMT users might develop manu-facturing ¯exibility for the sake of either reducing lead-time or improving quality. The eect of environmental uncertainty on manufacturing ¯exibility is thus incon-sistent between the two dierent industries.
Practically, even ®rms in the same industry may experience dierent levels and types of environmental uncertainty and thus choose to develop dierent manufacturing ¯exibility strategies. For example, there are two types of plant in the PCB industry. One is a captive plant that produces for downstream plants or divisions of the same company, and one is a contract manufacturer (which we studied) that produces for various companies. Captive plants are likely to be more insulated from market pressure than contract manufacturers . Suarez et al. (1996) studied captive plants and found a slightly dierent relationship between suppliers and product mix ¯exibility. The impli-cation is that since uncertainty and manufacturin g ¯exibility are complicated issues, no universal conclusions can be drawn without ®rst considering the factors of industry and/or even the positions of ®rms in supply chain system.
In summary, manufacturing ¯exibility has been suggested as an important concern as ®rms develop their business strategy and, thereby, their organizationa l capabilities. It is clear that ®rms should consider speci®c environmental variables in developing the necessary manufacturing ¯exibility. The environment should be built into designing competitive strategy. Furthermore, this study chose to investigate the ®t between environmental uncertainty and manufacturing ¯exibility in high-technol-ogy component manufacturers in Taiwan. Those ®rms sampled operate in a rather dynamic and hostile environment, which reinforces the eect of `®t’ on sales and
pro®t performance. Hamlin (1999) observes similar business behaviours from the OEMs in many Asian countries. Generally, high-technolog y contract manufacturers in Asian countries face similar demand, supply, technology and competition uncer-tainties. Therefore, we believe that the results of this study provide valuable insights to managers in other Asian countries (e.g. China, South Korea and Malaysia). On the other hand, we are more uncertain about the application to other, more tradi-tional, manufacturing environments, such as the textiles or machine tool industries. Companies in a more stable environment are likely to de®ne environmental uncer-tainty dierently and thus address manufacturing ¯exibility in a dierent way.
While our results indicate the importance of `®t’ between manufacturing ¯exibility and environmental uncertainty, we do not suggest that ®rms continuously and blindly invest in various types of manufacturing ¯exibility. It is important that manufacturing managers distinguish between required (the amount needed), potential (the amount designed into a system) and actual (the amount obtained in practice) manufacturing ¯exibility for the previously identi®ed dimensions (Dixon 1992, Gerwin 1993). Speci®cally, once the type of manufacturing ¯exibility is identi®ed given the environ-mental uncertainty, managers should perform some sort of discrepancy performance to examine the three levels of ¯exibility before any investment is made. After all, developing more ¯exibility, even with the alignment of environmental uncertainty, is not always better if the actual ¯exibility is equal to the required ¯exibility.
Another limitation of this study is related to the measures of manufacturing ¯exibility and uncertainty. The use of single item indicators for the manufacturing ¯exibility measure could limit the generalizability of the statistical results, although there is no one right way to combine multiple indicators underlying a multidimen-sional concept (Flynn et al. 1999, Noble 1995). On the other hand, there are researchers who advocate the use of single item indicators for better eciency in social science studies (e.g. Drolet and Morrison, 2001). In any case, the statistical results are mostly consistent with previous studies and our observation s from the ®eld. Research in this area should try to establish operationally useful measurement criteria across dierent industries to facilitate empirical study.
Appendix: Survey items and scales
I. Environmental Uncertainty
Over the past three years, please indicate the degree of predictability of the changes of each of the following environmental factors.
Highly Not predictable predictable 1. Change of current core production technology (E1) 1 2 3 4 5 6 7 2. Change of customer preference in product features (E2) 1 2 3 4 5 6 7 3. Customers switch to competitors (E3) 1 2 3 4 5 6 7 4. Change of current customer pro®le (E4) 1 2 3 4 5 6 7 5. Change of competitors’ price (E5) 1 2 3 4 5 6 7 6. Change of the length of product life cycle (E6) 1 2 3 4 5 6 7 7. Change of acceptable quality level in the current market (E7) 1 2 3 4 5 6 7 8. Change of competitors’ marketing strategy (E8) 1 2 3 4 5 6 7 9. Improvement of vendor quality as requested (E9) 1 2 3 4 5 6 7 10. Change of customer demand (volume) on current products (E10) 1 2 3 4 5 6 7 11. increase of vendor production capacity as requested (E11) 1 2 3 4 5 6 7 12. Change of current market share of major products (E12) 1 2 3 4 5 6 7 13. Change of delivery reliability of material and parts (E13) 1 2 3 4 5 6 7 14. Change of non-core production technology (E14) 1 2 3 4 5 6 7
15. entry of new competitors and exit of current competitors (E15) 1 2 3 4 5 6 7 16. Change of the current level of vendor quality (E16) 1 2 3 4 5 6 7 II. Manufacturing ¯exibility
1. How many distinct products/parts made in the last two years? 2. How many new models introduced in the last two years?
3. What are the highest and lowest monthly production volumes in the last two years? 4. What is the total annual production volume (in unit) in the last three years? 5. What is the average labour cost per unit of product?
III. Business performance
IV. Company background information
References
Badri, M. A., Davis, D. and Davis, D., 2000, Operations strategy, environmental uncer-tainty, and performance: a path analytic model of industries in developing countries. Omega, 28, 155±173.
Beach, R., Muhlemann, A. P., Price, D. H. R., Patterson, A. and Sharp, J. A., 2000, A review of manufacturing ¯exibility. European Journal of Operational Research, 122, 41± 57.
Bluedorn, A. C., 1993, Pilgrim’s progress: trends and convergence in research on organiza-tional size and environment. Journal of Management, 19, 163±191.
Bollen, K. and Lennox, R., 1991, Conventional wisdom on measurement: a structural equation perspective. Psychological Bulletin, 110(2), 305±314.
Bolwijn, P. T. and Kumpe, T., 1990, Manufacturing in 1990s-productivity, ¯exibility, and innovation. Long Range Planning, 23, 45±57.
Bolwijn, P. T. and Kumpe, T., 1991, The success of ¯exible, low-cost, and quality competi-tors: a European perspective. European Management Journal, 9(2), 135±144.
Bourgeois, L. J., III, 1980, Strategy and environment: a conceptual integration. Academy of Management Review, 5, 25±39.
Boyer, K. K. and Leong, G. K., 1996, Manufacturing ¯exibility at the plant level. Omega,
24(5), 495±510.
Braglia, M. and Petroni, A., 2000, Toward a taxonomy of search patterns of manufacturing ¯exibility in small and medium-sized ®rms. Omega, 28, 195±213.
Burns, T. and Stalker, G. M., 1961, The Management of Innovation (London: Tavistock). Chen, I. J., Clinton, R. J. and Chung, C. H., 1992, The marketing±manufacturing interface
and manufacturing ¯exibility. Omega, 20(4), 431±443.
Correa, H. L., 1994, Linking Flexibility, Uncertainty and Variability in Manufacturing Systems(London: Avery).
De Meyer, A., Nankeen, J., Miller, J. G. and Ferrous, K., 1989, Flexibility: the next competitive battle: the manufacturing futures survey. Strategic Management Journal,
10, 135±144.
De Toni, A. and Tonchia, S., 1998, Manufacturing ¯exibility: a literature review. International Journal of Production Research, 36(6), 1587±1617.
Dean, J. W. and Snell, S. A., 1996, The strategic use of integrated manufacturing: an empirical examination. Strategic Management Journal, 17, 459±480.
Dixon, J. R., 1992, Measuring manufacturing ¯exibility: an empirical investigation. European Journal of Operations Research, 60, 131±143.
Drolet, A. L. and Morrison, D. G., 2001, Do we really need multiple-item measures in service research? Journal of Service Research, 3(3), 196±204.
Downey, H. and Slouch, J., 1975, Uncertainty: measures, research, and sources of variation. Academy of Management Journal, 8, 562±578.
Duncan, R. B., 1972, Characteristics of organizational environments and perceived environ-mental uncertainty. Administrative Science Quarterly, 17, 313±327.
Flynn, B. B., Schroeder, R. G. and Flynn, E. J., 1999, World class manufacturing: an investigation of Hayes and Wheelwright’s foundation. Journal of Operations Management, 17, 249±269.
Gerwin, D., 1993, Manufacturing ¯exibility: a strategic perspective. Management Science,
39(4), 395±410.
Gupta, Y. P. and Somers, T. M., 1996, Business strategy, manufacturing ¯exibility, and organizational relationships: a path analysis approach. Production and Operations Management, 5(3), 204±233.
Hair, J. F., Anderson, R. E., Tatham, R. L. and Black, W. C., 1998, Multivariate Data Analysis,5th edn (Upple Saddle River, NJ: Prentice Hall).
Hamlin, M., 1999, The New Asian Corporation (San Francisco, CA: Jossey-Bass).
Jaikumar, R., 1986, Post-industrial revolution. Harvard Business Review, November± December, 110±118.
Jordan, W. C. and Graves, S. C., 1995, Principles on the bene®ts of manufacturing processes ¯exibility. Management Science, 41(4), 577±594.
Kekre, S. and Srinivasan, K. S., 1990, Broader product line: a necessity to achieve success? Management Science, 36(10), 1216±1231.
Kerin, R. A., Aaradarajan, R. P. and Peterson, R. A., 1992, First-mover advantage: a synthesis, conceptual framework, and research propositions. Journal of Marketing, 56, 33±52.
Kotha, S. and Orne, D., 1989, Generic manufacturing strategies: a conceptual synthesis. Strategic Management Journal, 10, 211±231.
Krajewski, L. T. and Ritzman, L. P., 1999, Operations Management Strategy and Analysis, 6th edn (New York: Addison-Wesley), p. 308.
Lawrence, P. R. and Lorsch, J. W., 1969, Organization and Environment: Managing Dierentiation and Integration(Homewood, IL: Irwin).
Lieberman, M. B. and Montgomery, D. B., 1988, First mover advantage. Strategic Management Journal, 9, 41±58.
Lynch, R. L. and Cross, K. F., 1991, Measure Up! Yardstick for Continuous Improvement (Cambridge, MA: Blackwell).
Mandelbaum, M., 1978, Flexibility and decision making. European Journal of Operations Research, 44(1), 17±27.
Mascarenhas, B., 1981, Planning for ¯exibility. Long Range Planning, 14(5), 573±574. March, J. G. and Simon, H. A., 1958, Organizations (New York: Wiley).
Miller, K. D., 1993, Industry and country eects on managers’ perceptions of environmental uncertainties. Journal of International Business Studies, 21(2), 311±331.
Noble, M. A., 1995, Manufacturing strategy: testing the cumulative model in a multiple country context. Decision Sciences, 26(5), 693±721.
Pagell, M. and Krause, D. R., 1999, A multiple-method study of environmental uncertainty and manufacturing ¯exibility. Journal of Operations Management, 17, 307±325. Sethi, A. K. and Sethi, S. P., 1990, Flexibility in manufacturing: a survey. International
Journal of Flexible Manufacturing Systems, 2(4), 289±328.
Suarez, F. F., Cusumano, M. A. and Fine, C. H., 1996, An empirical study of manufacturing ¯exibility in printed circuit board assembly. Operations Research, 44(1), 223±240. Swamidass, P. M. and Newell, W. T., 1987, Manufacturing strategy, environmental
uncer-tainty and performance: a path analytic model. Management Science, 33(4), 509±524. Tannous, G. F., 1996, Capital budgeting for volume ¯exible equipment. Decision Sciences,
27(2), 157±177.
Tombak, M. and Demeyer, A., 1988, Flexibility and FMS: an empirical analysis. IEEE Transaction on Engineering Management, 35(2), 101±107.
Upton, D. M., 1994, The management of manufacturing ¯exibility. California Management Review,Winter, 72±89.
Venkatraman, N., 1989, The concept of ®t in strategic research: toward verbal and statistical correspondence. Academy of Management, 14, 423±444.
Venkatraman, N. and Prescott, J. E., 1990, Environmental-strategy coalignment: an empirical test of its performance implications. Strategic Management Journal, 11, 1±23. Vickery, S. K., Droge, C. and Markland, R. E., 1993, Production competence and business
strategy: do they aect business performance? Decision Sciences, 24(2), 435±455. Ward, P. T., Duray, R., Leong, K. G. and Sum, C.-C., 1995, Business environment,
opera-tions strategy, and performance: an empirical study of Singapore manufacturing. Journal of Operations Management, 13, 99±115.
Wernerfelt, B. and Karnai, A., 1987, Competitive strategy under uncertainty. Strategic Management Journal, 8, 187±194.