Evaluation of Bone Mineral Density of the Lumbar Spine and
Proximal Femur in Population-based Routine Health Examinations
of Healthy Asians
W. P. CHAN, J.-F. LIU & W.-L. CHI
Department of Radiology, School of Medicine, Taipei Medical University, Taipei, Taiwan, Republic of China; Taipei Medical University-Municipal Wan Fang Hospital, Taipei, Taiwan, Republic of China; Federation Clinic, Taipei, Taiwan, Republic of China
Chan WP, Liu J-F, Chi W-L. Evaluation of bone mineral density of the lumbar spine and proximal femur in population-based routine health examinations of healthy Asians. Acta Radiol 2004;45:59–64.
Purpose: To understand the peak bone mineral density (BMD) and annual loss of BMD of the lumbar spine (L-BMD) and the proximal femur (F-BMD) and the prevalence of osteoporosis in both sexes in Taipei City, Taiwan.
Material and Methods: The medical records from a recent 3-year period of annual health examinations at a single institution were reviewed. A total of 1514 men (mean age 49.08¡13.62) and 1955 women (48.07¡14.12), who lived in the Taipei area, had no major systemic disorders, and who had undergone both L-BMD and F-BMD examinations, were recruited.
Results: In women, peak L-BMD (1.078¡0.133 g/cm2) occurred in the 30 to 39-year age
group, whereas peak F-BMD (0.873¡0.101 g/cm2) occurred in the 17 to 29-year age
group. In men, peak L-BMD (1.095¡0.137 g/cm2) and F-BMD (0.989¡0.140 g/cm2)
both occurred in the 17 to 29-year age group. The estimated annual bone loss was 0.69% of peak L-BMD in women over 50 years; in the proximal femur this was 0.688% in women and 0.332% in men. In women over 60 years, approximately half of the population had osteoporosis in the lumbar spine.
Conclusion: We report descriptive BMD data of a Chinese population recruited from a Taipei urban area who underwent routine health examination. The values are similar to or higher than those of Japanese, Canadian and Greek populations. L-BMD was lower than that in the Lebanese, and F-BMD of both sexes was lower than that reported in the Greek study.
Key words: Bone mineral density; Chinese; osteopenia; osteoporosis; peak bone mass Wing P. Chan, Department of Radiology, Taipei Medical University-Municipal Wan Fang Hospital, 111 Hsing-Long Road, Section 3, Taipei 116, Taiwan, Republic of China (fax. z886 2 2931 6809, e-mail. wingchan@tmu.edu.tw)
Accepted for publication 6 October 2003
Osteoporosis is a bone condition in which the quantity of bone per unit volume decreases while the bone is normal in composition. The condition is characterized by low bone mass and microarchi-tectural deterioration of the bone tissue, leading to enhanced bone fragility and a consequent increase in prevalence of fracture (1). Both osteoporosis and osteoporotic fractures are important epidemiologic problems in developed countries because of the growing population of elderly people.
In Taiwan, the elderly population (older than 65) increased by 8.6% from 1989 to the end of 2000, accounting for 1.92 million people. In a previous
local study (16), bone mineral density (BMD) values of the lumbar spine (L-BMD) of Chinese in Taiwan, measured using a dual photon absorpti-ometer (DPA), were similar to those of Caucasians, whereas the BMD values of the femur (F-BMD) were 10% to 15% lower. BMD decreased signifi-cantly with age, especially in postmenopausal women. Women lose their bone tissue by between 1% and 4% annually during the first 10 years after the menopause (5). In Taiwan, the prevalence of vertebral fractures after age 65 is 18% for women and 12% for men (16).
The recruited subjects in previous BMD studies
Acta Radiol Downloaded from informahealthcare.com by Taipei Medical University on 03/25/11
(17–19) in Taiwan were healthy volunteers. The sample sizes were relatively small and did not include comparable numbers of young adults. In the present study, therefore, the BMD values of a large population of Chinese who live in Taipei City and who had undergone routine health examination were reviewed. This cross-sectional study reports peak BMD, annual bone loss of L-BMD and F-BMD, and the prevalence of osteoporosis in both men and women in this population-based screening in Taipei City.
Material and Methods
The medical records from a recent 3-year period of annual health examinations at the Federation Clinic were reviewed. The Federation Clinic is a private health examination institution in Taipei. Subjects were recruited by advertisement; they were mainly people of middle-class economic level and their family members. They have a variety of examina-tion packages to choose, most of which include both L-BMD and F-BMD measurements. Recruited subjects were not from any selected occupations.
Inclusion criteria were that subjects lived in the Taipei area, had no major systemic disorders, and had undergone BMD examination of both the lumbar spine and proximal femur. A total of 3469 people (1514 men and 1955 women) were recruited. Their mean (¡ standard deviation, SD) ages were 48.07¡14.12 years for women and 49.08¡13.62 for men, ranging from 17 to 89.
BMD was determined by dual-energy X-ray absorptiometry (DXA) densitometer (XR36, Nor-land Corporation, Wisc., USA). Three experienced technicians performed the examinations and obtained the data for this study. Bone density was measured in both the lumbar vertebrae and the proximal femur in the posteroanterior projection for each subject. Each patient was examined in the supine position; measurement of the L-BMD was performed first. Both knees were slightly flexed with an accessory for examining the L-BMD, whereas both legs were placed flat with each foot strapped onto a foot holder for F-BMD. Each patient was aligned in the middle of the examination table and parallel to the long axis of the table. The areas to be scanned were L2 to L4 for L-BMD and the left femoral neck for F-BMD.
Although BMD derived from projection techni-ques is the bone tissue mass per unit area, not per unit volume, BMD customarily represents the apparent area density. In this article, the term BMD is used to represent the bone density per unit
area. The BMD values were expressed in grams per square centimeter (g/cm2). All measurements were performed on a single scanner with an average daily percentage of coefficients of variation (CV%) of 0.61% on a lumbar spine phantom.
According to the recommended criteria of the World Health Organization, osteoporosis was defined using the T-score as the diagnostic mea-surement if the BMD value was 2.5 SD below the mean of a young reference population; osteopenia was defined as a BMD value between 1 and 2.5 SD below the mean of a young reference population; and a BMD value not less than 1 SD below the mean of a young reference population was classified as normal. The young reference was defined as the peak BMD and SD obtained from our local reference data from the manufacturer. The raw data were originally from a database of normal Chinese women obtained by a national university hospital research group. These data were used for the BMD equipment of the same manufacturer nationwide.
One-way analysis of variance (ANOVA) and Tukey’s post-hoc tests were used to determine the differences in BMD among age groups. Linear
Fig. 1. Bone mineral density of the lumbar spine (L-BMD) by age in Chinese women and men (¤ L-spine/women; & L-spine/ men).
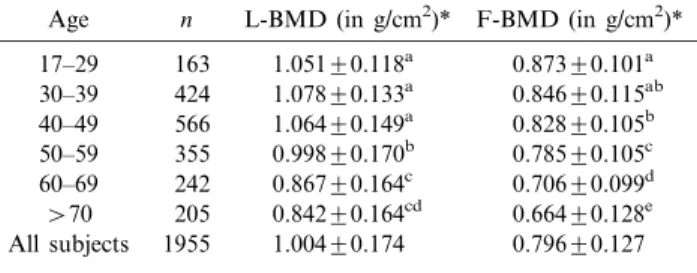
Table 1. Bone mineral density of the lumbar spine (L-BMD) and proximal femur (F-BMD) in Chinese women
Age n L-BMD (in g/cm2)* F-BMD (in g/cm2)* 17–29 163 1.051¡0.118a 0.873¡0.101a 30–39 424 1.078¡0.133a 0.846¡0.115ab 40–49 566 1.064¡0.149a 0.828¡0.105b 50–59 355 0.998¡0.170b 0.785¡0.105c 60–69 242 0.867¡0.164c 0.706¡0.099d w70 205 0.842¡0.164cd 0.664¡0.128e All subjects 1955 1.004¡0.174 0.796¡0.127 n: number of subjects.
*Values in the same column with different superscripts are significantly different (Pv0.05).
Acta Radiol Downloaded from informahealthcare.com by Taipei Medical University on 03/25/11
regression was used to estimate the annual bone loss of L-BMD and F-BMD. Strata analysis was used if there were different patterns in the younger and older populations. A P value of less than 0.05 was considered to indicate a statistically significant difference.
Results Peak BMD
In women, peak L-BMD (1.078¡0.133 g/cm2) occurred in the 30 to 39-year age group (Table 1, Fig. 1). The L-BMD was relatively stable from ages 17 to 49, and decreased after age 50. In the proximal femur, peak BMD (0.873¡0.101 g/cm2) occurred in the 17 to 29-year age group. The F-BMD was stable between ages 17 and 39, and then decreased after age 40 (Fig. 2).
In men, peak BMD of both the L-spine (1.095¡ 0.137 g/cm2) and proximal femur (0.989¡0.140 g/cm2) occurred in the 17 to 29-year age group (Table 2, Figs. 1 and 2). The L-BMD decreased slowly after
the peak. In contrast, F-BMD decreased consider-ably after the peak, and bone loss became milder after age 60.
Aging and bone loss
In women older than 50 years, the estimated annual bone loss of the L-spine was 0.007 g/cm2, which was approximately 0.690% of peak L-BMD. Annual bone loss of the proximal femur (0.688%) was more than 2-fold that in the 17 to 49 age group (0.269%). In men over 50 years, annual bone loss in the proximal femur was 0.332% of peak F-BMD, which was approximately half (0.613%) that of the 17 to 49 age group.
Prevalence of osteoporosis
Prevalence was calculated using local reference data from the equipment manufacturer. In women, the prevalence of osteopenia in the lumbar spine was between 25.5% and 31.0% in all age groups. After the age of 60, approximately half of the population had osteoporosis in the lumbar spine, accounting for 50.0% of people in 60 to 69-year age group and 55.1% in the group aged over 70. The prevalence of osteoporosis in the proximal femur (47.3%) peaked in subjects over 70.
In men, the prevalence of osteopenia and osteoporosis was fairly low in the lumbar spine; only 2 of 158 men (1.1%) over 60 years were considered to have osteoporosis. In the proximal femur, the prevalence of osteopenia increased with age, but only 5.1% of men over 70 years were considered to have osteoporosis.
The prevalence of osteoporosis was also calcu-lated by using our peak L-BMD data, as shown in Table 4.
Discussion
Our studied population seemed to have a higher peak L-BMD and F-BMD than reported for Japanese women in the Japanese Population-Based Osteoporosis Study (JPOS) (6) (Table 3), Canadian women in the Canadian Multicentre Osteoporosis Study (CaMos) (15), and non-Hispanic white women in the National Health and Nutrition Survey (NHANES III) (7, 8). In a Greek popula-tion (4), F-BMD values were higher than ours, and a Lebanese group (10) had higher L-BMD than those in our study.
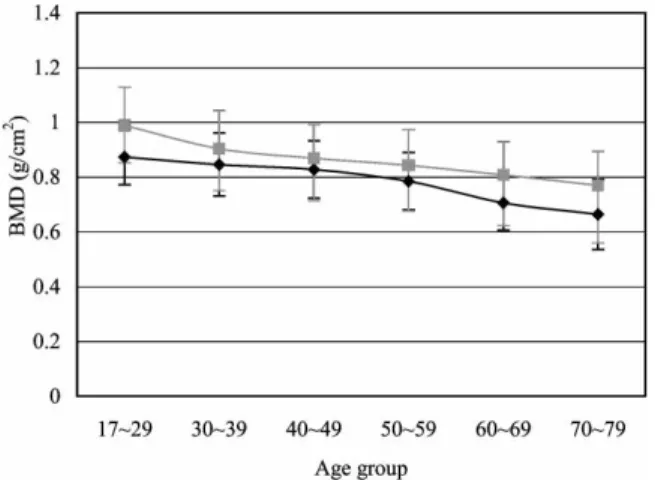
The peak L-BMD in our male population is lower than those of the Lebanese (10), but higher than those of the Canadian men (15). Our peak F-BMD was also higher than those of both Canadian Fig. 2. Bone mineral density of the proximal femur (F-BMD) by
age in Chinese women and men (¤ femoral neck/women; & femoral neck/men).
Table 2. Bone mineral density of the lumbar spine (L-BMD) and proximal femur (F-BMD) in Chinese men
Age n L-BMD (in g/cm2)* F-BMD (in g/cm2)*
17–29 84 1.095¡0.137a 0.989¡0.140a 30–39 284 1.057¡0.153ab 0.904¡0.138b 40–49 506 1.047¡0.156ab 0.869¡0.122cd 50–59 281 1.036¡0.166ab 0.843¡0.131d 60–69 201 1.029¡0.185b 0.808¡0.121ef w70 158 1.044¡0.210ab 0.770¡0.124f All subjects 1514 1.047¡0.167 0.859¡0.137 n: number of subjects.
*Values in the same column with different superscripts are significantly different (Pv0.05).
Acta Radiol Downloaded from informahealthcare.com by Taipei Medical University on 03/25/11
men (15) and non-Hispanic white men (7), and close to that of the young healthy men in Rochester, New York (12) and the Lebanese (10).
Extensive data (3, 9) suggest that peak BMD at most sites is reached by the age of 20, but bone size and BMD continue to increase through young adulthood. The bone mass in Asian populations is usually slightly lower than that of Caucasians. These differences appear to be mainly associated with the smaller bone size of the Asians. Genetic factors account for as much as 80% of the variance in peak bone mass. Black populations have a higher bone mass than Caucasians or Asians, and men
have bigger, denser skeletons than women (3). Recent research (3) also suggests that polymorph-ism of the vitamin D receptor gene has an important effect on bone density in women. Other potential determinants of peak bone mass include exercise, diet, smoking, alcohol consumption, and hormonal factors. Smoking and alcohol consump-tion during adolescence and early adult life appear to have an adverse effect on peak bone mass (3).
Peak BMD can be different even in the same ethnic group (Table 3). YUet al. (21) also employed
DXA to determine the BMD of 445 Chinese in Beijing, and reported peak L-BMD in the 30 to
Table 4. Prevalence of normal bone, osteopenia, and osteoporosis in people aged w50 from L-BMD values calculated from different peak BMD data
Peak BMD Percentage of normal bone, osteopenia, and osteoporosis
Age group
Mean¡SD
(in g/cm2) Normal Osteopenia Osteoporosis
Women
Calculated from local reference data* 20–29 1.041¡0.075 32.3% 28.3% 38.4%
Calculated from this study 17–29 1.051¡0.118 45.0% 35.5% 19.5%
30–39 1.078¡0.133 42.6% 39.5% 17.8%
Men
Calculated from local reference data* 20–29 0.994¡0.160 87.2% 12.5% 0.3% Calculated from this study
Men 17–29 1.095¡0.137 64.4% 32.2% 3.4%
Women 17–29 1.051¡0.118 71.1% 25.5% 3.4%
Women 30–39 1.078¡0.133 68.9% 27.7% 3.4%
*Local reference data obtained from the equipment manufacturer.
Table 3. Comparison of peak BMD and prevalence of osteoporosis in various epidemiological studies
Lumbar spine Proximal femur
Peak BMD Prevalence of osteoporosis (age §50) Peak BMD Prevalence of osteoporosis (age §50) Age group Mean¡SD (g/cm2) Age group Mean¡SD (g/cm2) Women CaMos (15) 25–39 1.042¡0.121 12.1% 25–29 0.857¡0.125 7.9% NHANES III (7) – – 20–29 0.858¡0.120 JPOS (6) 20–40 1.051¡0.115 38% 15–19 0.849¡0.099 11.6% Greece (4) 30–35 1.044¡0.100 25–30 0.923¡0.110 Lebanon (10) 20–39 1.110¡0.120 11% 20–39 0.900¡0.120 2% Beijing (21, 22) 30–39 1.202¡0.140 20–29 0.971¡0.140 This study 30–39 1.078¡0.133 38.4%** 17–29 0.873¡0.101 23.8%** Men CaMos (15) 25–39 1.058¡0.127 2.9% 25–29 0.910¡0.125 6.6% NHANES III (7) – – 20–29 0.934¡0.137 2–4%* Greece (4) 30–35 1.108¡0.130 25–30 1.038¡0.110 Rochester (12) – – 20–29 0.986¡0.109 Lebanon (10) 20–39 1.240¡0.120 9% 20–39 1.070¡0.130 9% Beijing (21, 22) 30–39 1.180¡0.140 20–39 1.060¡0.170 Taiwan (18) 20–29 1.056¡0.127 – – This study 17–29 1.095¡0.137 0.3%** 17–29 0.989¡0.140 2.0%**
*Caucasian 4%, Hispanic 2%, African-American 3%.
**Local reference data obtained from the manufacturer were used as the young-adult reference.
Acta Radiol Downloaded from informahealthcare.com by Taipei Medical University on 03/25/11
39-year age group in both sexes; their peak values were higher than those in our study. People in Beijing commonly ride a bicycle as a mode of transport (22); such daily exercise might contribute, in part, to the development of higher peak bone mass of the Chinese in Beijing than in Taipei.
Cortical and trabecular bone loss progresses with aging in both sexes, although the rate of bone loss varies according to the anatomic site. Bone loss starts between the ages of 35 and 40 in both sexes, possibly because of impaired new bone formation, and declining osteoblast function (3). Bone loss increases at menopause, because of marked reduc-tions in the circulating concentrareduc-tions of estradiol and progesterone. Women lose 35% to 50% of trabecular and 25% to 30% of cortical bone mass with age, whereas men lose 15% to 45% of trabecular and 5% to 15% of cortical bone (3).
In the present study, L-BMD values decreased only slightly in men with increasing age. TSAIet al.
(19) reported a similar observation. It is well known that certain factors can elevate the L-BMD values in elderly people; these include vertebral osteo-arthritis, aortic wall calcification, and other ectopic spinal calcifications (14). Nevertheless, the pattern of femoral bone loss was different between men and women. The rate of bone loss in men over 50 was approximately half that of those aged 17 to 50, whereas there was exactly the opposite pattern in women. There were similar results in the Greek study (4). The annual bone loss in men was 2-fold (spine 0.36%–0.4%; femur 0.58%–0.68%) that in women (spine 0.1%–0.22%; femur 0.3%–0.36%) between the ages of 20 and 50, whereas after age 50 the differences were the reverse; bone loss in men (0.4%–0.64%) was approximately one-third that in women (1.28%–01.6%) in the lumbar spine and about half of that in the femoral neck (men 0.7%– 0.78%; women 1.22%–1.48%).
The pattern of decline in L-BMD and F-BMD with age is similar in Japanese women (5, 13). Bone loss in aging Japanese women is higher than in Caucasian women in the United States, possibly because of the smaller body size of postmenopausal Japanese women and/or a cohort effect (13). There are no studies comparing bone tissue turnover of Asians, Blacks, and Caucasians.
In our population, the cumulative losses of L-BMD and F-BMD in women and F-BMD in men were essentially the same. Although our observation could be a cohort effect, a similar result has been reported in a Greek study (4). This indicates that the total bone loss is equal in both sexes, but the pattern and rate of BMD decline differ between the sexes. Notwithstanding the
greater loss of trabecular bone after menopause, more compact bone was lost in the 60 to 70-year age group, resulting in a total bone loss balance (4). Longitudinal studies, however, are necessary to determine whether there are different BMD pat-terns between men and women.
The prevalence of osteoporosis in the lumbar spine in women older than 50 in our study population was similar to that reported in the JPOS (6) (Table 3), and much higher than in the CaMos (15), eastern Poland (18.5%) (2), and Lebanon (10). At the proximal femur, the pre-valence of osteoporosis in our study population was much higher than that reported in the JPOS (6), the CaMos (15), and the Lebanese (10).
In men older than 50, the prevalence of osteo-porosis in our studied population was quite low compared with the CaMos results (15) (Table 3), and similar to those in the NHANES III study (7). The prevalence of osteoporosis in the femur is about one-third that reported in CaMos. Because osteoporosis is one of the risk factors for fracture, this low prevalence would probably be reflected by a lower incidence of hip fracture. The annual incidence of hip fracture over the age of 65 for men and women in Taiwan was 203 per 100,000 population in 1996 (unpublished data), which is close to that of Beijing people (20) and is lower than that of Caucasian populations (11).
When the T-scores are calculated, a peak BMD or reference data from a young age group can be used, and the results might be affected by the reference data applied. Because our study popula-tion was not randomly selected, we used local reference data to calculate the T scores; however, we also compared the prevalence of osteoporosis by using peak L-BMD of our population as the standard (Table 4). When local reference data were used in our study, 38.4% of women older then 50 were considered to have osteoporosis; however, the prevalence was less then 20% when the peak L-BMD was used for the calculation. This could be explained by the relatively small SD of the local reference data (about 60% of that in other studies), and therefore, the prevalence might be overestimated.
T scores for men are usually calculated from the female young-adult peak; we also compared the prevalence of osteoporosis in men older than 50 by using different peak BMD values (Table 4). Only 2 of the 158 men were considered to have osteoporo-sis when local reference data were used, but the prevalence was 3.4% no matter whether male or female peak L-BMD were used, and is similar to that in the CaMos study. The local reference had a
Acta Radiol Downloaded from informahealthcare.com by Taipei Medical University on 03/25/11
lower mean and higher SD than ours, and that resulted in a lower cut-off point for osteoporosis.
Because of the limited number of men and women under 20 years in the studied population, we combined those who were younger than 29 into the same age group in the final analysis. It is possible that peak BMD occurred before the age of 20, which is when measurements were taken in the present study.
This investigation was a cross-sectional study, and therefore the rate of bone loss was not calculated in the same group of individuals in a longitudinal follow-up, but between different indi-viduals in different age spans, which is a known limitation and will not reflect the true result of the rate of bone loss.
In addition, because subjects in this study were not selected using a territory-wide randomized method, there could be a bias in that these subjects might be more health conscious and have a more active lifestyle, resulting in overestimation of the BMD values. On the other hand, there might be a bias in the opposite direction, in that subjects might already have osteoporosis and therefore more likely to be screened.
In conclusion, descriptive BMD data of a Chinese population who underwent routine health examinations in a Taipei urban area are similar to or higher than those of Japanese, Canadian, and Greek populations. L-BMD was lower than that in the Lebanese, and F-BMD of both sexes was lower than that reported in the Greek study.
References
1. Consensus development conference. Prophylaxis and treatment of osteoporosis. Am J Med 1991;90:107–10. 2. Filip RS, Zagorski J. Bone mineral density and
osteoporosis in rural and urban women. Epidemiologi-cal study of the Lublin region (Eastern Poland). Ann Agric Environ Med 2001;8:221–6.
3. Francis RM, Sutcliffe AM, Scane AC. Pathogenesis of osteoporosis. In: Stevenson JC, Lindsay R, editors. Osteoporosis. London: Chapman & Hall, 1998:29. 4. Hadjidakis D, Kokkinakis E, Giannopoulos G,
Merakos G, Raptis SA. Bone mineral density of vertebrae, proximal femur and os calcis in normal Greek subjects as assessed by dual-energy X-ray absorptiometry: comparison with other populations. Eur J Clin Invest 1997;27:219–27.
5. Hoshi K, Yamada H, Tsukikawa S, Sugano T, Endo C, Sato A. The bone mineral density change with aging of Japanese women measured by single energy X-ray absorptiometry and dual energy X-ray absorptiometry. Arch Gynecol 1996;253:65–9.
6. Iki M, Kagamimori S, Kagawa Y, Matsuzaki T,
Yoneshima H, Marumo F. Bone mineral density of the spine, hip and distal forearm in representative samples of the Japanese female population: Japanese Population-Based Osteoporosis (JPOS) Study. Osteo-poros Int 2001;12:529–37.
7. Looker AC, Orwoll ES, Johnston CC, Lindsey RL, Wahner HW, Dunn WL, et al. Prevalence of low femoral bone density in older US adults from NHANES III. J Bone Miner Res 1997;12:1761–8.
8. Looker AC, Wahner HW, Dunn WL, Calvo MS, Harris TB, Heyse SP, et al. Updated data on proximal femur bone mineral levels of US adults. Osteoporos Int 1998; 8:468–89.
9. Luz Villa M, Nelson L, Nelson D. Race, ethnicity, and osteoporosis. In: Marcus R, Feldman D, Kelsey J, editors. Osteoporosis. London: Academic Press; 2001. p. 569.
10. Malouf G, Salem S, Sandid M, et al. Bone mineral density of the Lebanese reference population. Osteo-poros Int 2000;11:756–64.
11. Melton LJ III. Hip fractures: a worldwide problem today and tomorrow. Bone 1993;14:1–8.
12. Melton LJ III, Atkinson EJ, O’Connor MK, O’Fallon WM, Riggs BL. Bone density and fracture risk in men. J Bone Miner Res 1998;13:1915–23.
13. Ohmura A, Kushida K, Yamazaki K, Okamoto S, Katsuno H, Inoue T. Bone density and body composi-tion in Japanese women. Calcif Tissue Int 1997;61: 117–22.
14. Szulc P, Garnero P, Munoz F, Marchand F, Delmas PD. Cross-sectional evaluation of bone metabolism in men. J Bone Miner Res 2001:1642–50.
15. Tenenhouse A, Joseph L, Kreiger N, Poliquin S, Murray TM, Blondeau L, et al. Estimation of the prevalence of low bone density in Canadian women and men using a population-specific DXA reference stan-dard: the Canadian Multicentre Osteoporosis Study (CaMos). Osteoporos Int 2001;11:897–904.
16. Tsai KS. Osteoporotic fracture rate, bone mineral density, and bone metabolism in Taiwan. J Formos Med Assoc 1997;96:802–5.
17. Tsai KS, Huang KM, Chieng PU, Su CT. Bone mineral density of normal Chinese women in Taiwan. Calcif Tissue Int 1991;48:161–6.
18. Tsai SC, Kao CH, Wang SJ, ChangLai SP, Yen RF, Chieng PU. Normal data for lumbar spine bone mineral content in healthy Chinese men. Calcif Tissue Int 1997;61:114–6.
19. Tsai KS, Pan WH, Hsu SH, Cheng WC, Chen CK, Chieng PU, et al. Sexual differences in bone markers and bone mineral density of normal Chinese. Calcif Tissue Int 1996;59:454–60.
20. Xu L, Lu A, Zhao X, Chen X, Cummings SR. Very low rate of hip fracture in Beijing, People’s Republic of China: the Beijing Osteoporosis Project. Am J Epidemiol 1996;144:901–7.
21. Yu W, Qin M, Xu L, et al. Bone mineral analysis of 445 normal subjects assessed by dual X-ray absorptiometry. Chin J Radiol 1998;30:625–9.
22. Yu W, Qin M, Xu L, et al. Bone mineral analysis of proximal femur in 445 normal subjects assessed by dual X-ray absorptiometry. Chin J Radiol 1998;32:23–6.
Acta Radiol Downloaded from informahealthcare.com by Taipei Medical University on 03/25/11