Facile Surface Functionalization of Carbon/Nafion for Enhancement of Methanol Electro-Oxidation
Yu-Chi Hsieh,a Li-Chung Chang,b Pu-Wei Wu,a,* Jyh-Fu Lee,c and Chen-Hong Liaoa
a
Department of Materials Science and Engineering, National Chiao Tung University, Hsin-Chu 30010, Taiwan
b
Graduate Program for Science and Technology of Accelerator Light Source, National Chiao Tung University, Hsin-Chu 30010, Taiwan
c
National Synchrotron Radiation Research Center, 101 Hsin-Ann Road, Hsinchu Science Park,
We report a facile electrochemical method to produce functional groups on the carbon surface in which multiple cyclic voltammetric (CV) sweeps are imposed in 0.5 M H2SO4 electrolyte
on the samples containing carbon cloth, Vulcan XC72R, and Nafion ionomer. With supply of ambient O2, the generation of
radicals from the oxygen reduction and Nafion ionomer degradation enables an accelerated formation of oxygenated functional groups on the carbon surface. Raman analysis reveals structural variation for the carbon electrodes after CV modifications. X-ray photoelectron spectroscopy confirms the alteration of carbon structure in conjunction with notable increase of oxygenated groups and reduction in fluorine amount. The functionalized electrodes allow a 250% increment for PtRu electrodeposition as compared to the reference sample. We carry out electrochemical measurements on methanol electro-oxidation for the PtRu samples. The functionalized electrode demonstrates significant improvement in apparent current density and mass activity as opposed to the reference sample.
Carbon is widely used as the electrode support for various electrochemical applications. Unfortunately, the untreated carbon is often hydrophobic that allows limited adsorption of catalyst precursors and catalysts. Therefore, it is of particular interest to carry out additional functionalization treatments on the carbon surface to render a hydrophilic surface instead. Moreover, it is expected that the oxidized functional groups on carbon supports lead to an increased Pt loading and promote methanol electro-oxidation (MOR) (1, 2). Conventional carbon functionalization involves tedious treatments in acidic solution at elevated tempeature. It is suggested that the Nafion ionomer could possibly be decomposed with the formation of functional groups that attach themselves onto the carbon support. Previously, responsible mechanisms for Nafion membrane degradation have been studied in polymer membrane fuel cells (3). However, the decomposition of Nafion ionomer and the resulting species have not been investigated carefully. In this work, we impose deliberate electrochemical decompositions of Nafion ionomer and evaluate their effects on the carbon supports for PtRu deposition and MOR activities.
Vulcan XC-72R is deposited onto a 2×2 cm2 carbon cloth by an ink dispersion which contains carbon (8 mg) and Nafion ionmer solution (5 wt%; 5 mg). Afterward, the
samples undergo cyclic voltammetric scans (CV) 20 cycles in excess O2 from -0.2-0.9 V,
-0.2-1.1 V, and -0.2-1.4 V in 0.5 M H2SO4 to decompose Nafion ionomers, resulting in
the formation of functional groups on the samples. The reference sample for comparison is immersed in 0.5 M H2SO4 for 30 min. Next, PtRu nanoparticles are electrodeposited
and analyzed for methanol oxidation reaction (MOR) activities with and without pretreatments. The PtRu electrolyte concentrations for the Pt, Ru, and H2SO4 are 5.0 mM,
5.0 mM, and 0.25 M, respectively. Pulse electrodeposition parameters include current on-time of 50 ms, current off-on-time of 100 ms, current density of -50 mA/cm2, and total coulomb charge of 8.0 C/cm2. Electrochemical measurements are conducted at room temperature in a three-electrode arrangement using an EG&G 263A. Cyclic voltammetric analysis (CV) is imposed in a potential range from −0.2 to 0.9 V at a scan rate of 50 mV/s in 0.5 M H2SO4 and 1 M CH3OH for methanol oxidation. The samples undergoing CV
scans in potential ranges from −0.2 to 0.9 V, -0.2 to 1.1 V, and -0.2 to 1.4 V are designated as re-0.9v, re-1.1v, and re-1.4v.
Figure 1(A) provides the CV profiles for the first and 20th cycles on the samples of re-0.9v and re-1.1v. Apparently, these profiles exhibit notable double-layer characteristics. As expected, the capacitive responses are increasing with CV cycles, inferring possible chemical degradation of Nafion ionomer. To remove the capacitive effect of XC-72R, we perform identical experiments with the electrodes containing carbon cloth and Nafion ionomer only, as shown in Figure 1 (B). Interestingly, there appear obvious oxidation and reduction peaks centering at 0.55 and 0.34 V. In addition, the amount of oxidized functional groups increases steadily with increasing cycles. According to Wang et al., these peaks are indicative of hydroquinone-quinone redox couple, suggesting the formation of oxidized functional groups on carbon surface (4).
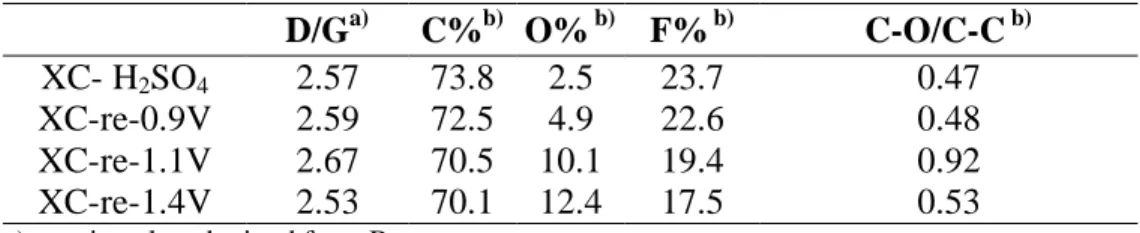
Figure 2 provides the Raman spectra for the electrodes after treatments in CV scans and H2SO4 immersion. As shown, all samples reveal characteristic peaks which are
defined as D-band (1310 cm-1) and G-band (1596 cm-1), respectively. The D-band represents the presence of defects and disorder in the carbon structure while the G-band reflects the graphitic in-plane vibrations with E2g symmetry (5). Hence, the ratio for D/G
signals indicates the crystallinity of carbon. As mentioned earlier, the electrode undergoing simple H2SO4 immersion is selected for comparison purpose and it exhibits a
D/G value of 2.57. In contrast, the sample after CV scans reveals a D/G value of 2.53~2.67. Numeric D/G data are listed in Table 1. This moderate variation in the D/G ratio infers that the carbon structure is slightly changed after CV treatments.
Figure 3 presents the XPS survey profiles on the samples at various CV potentials and H2SO4 immersion, respectively. It can be seen that a larger potential leads to more
oxygenated species and lower fluorine content. This result is also presented in Table 1. The reduction of fluorine content indicates the degradation of Nafion ionomer, while excess oxygen infers the presence of oxidative functional groups on the carbon surface.
Figure 4(A) shows the C1s XPS spectrum on the samples at various CV potentials and H2SO4 immersion, respectively. The oxygen content on the carbon black surface
reveals the percentage of several oxygenated functions, such as alcohols (286.3-287.0 eV), carbonyls (287.5-288.1 eV), and carboxyls (289.3-290.0 eV). The detailed curve-fitting results from the C1s XPS profiles are shown in Figure 4(B). The percentage of oxygenated functions (C-O/C-C) is listed in Table I. As shown in Figure 4(A), we observe that a larger potential leads to more carbon functional groups. Therefore, we surmise that the Nafion ionomer is decomposed and attacked by oxygen becoming
2018 ecsdl.org/site/terms_use) unless CC License in place (see abstract). address. Redistribution subject to ECS terms of use (see
140.113.38.11
oxygen-containing functional groups on surface. However, for samples of re-1.4v, it is possible that excess electric potential leads to the desorption of functional groups on the carbon surface.
Subsequently, we electrodeposit PtRu nanoparticles at electrodes with various functional group contents. Table II lists the experimental parameters as well as results from ICP-MS for the PtRu nanoparticles and electrochemical parameters form CV curves in apparent current density and mass activity. Because relevant electrodeposition parameters including current on-time, current off-time, current density, and total coulomb charge remain unchanged, the resulting Pt/Ru ratio is maintained in the range of 77~78 at%. As presented, the PtRu loadings are in range of 99.8~257.4 μg/cm2. Interestingly, the PtRu loading is increasing with increasing amount of functional groups.
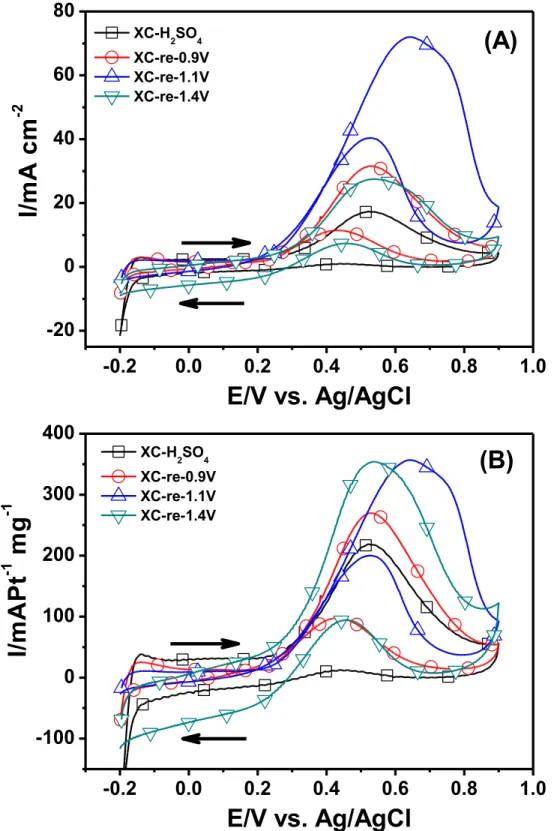
Figure 5(A) shows the MOR apparent current density for samples undergoing identical electroplating process. According to literature, in these profiles the anodic peak (if) is attributed to the oxidation of methanol while the cathodic peak (ib) corresponds to
the oxidation of carbonaceous species produced from earlier methanol oxidation (6, 7, 8). As shown, the methanol oxidation current density is proportional to PtRu loading. Figure 5(B) presents the MOR mass activity for samples undergoing identical electroplating process. At a larger CV potential scan, we observe a reduced value for both the onset potential and anodic peak potential. Furthermore, the electrode with CV scans reveals a larger mass activity than that of H2SO4 immersion, and detailed MOR data are listed in
Table II. These behaviors confirm that the presence of oxidized functional groups is conductive to MOR activities.
In summary, we conduct multiple CV scans in an acidic electrolyte on the
electrodes containing carbon cloth, XC72R, and Nafion ionomer. With O2 supplied from
ambient, we observe an accelerated formation of functional groups on the carbon surface. Raman analysis reveals structural modification after CV scans. Results from XPS spectra exhibit an increase of oxygenated groups with a notable reduction in fluorine content. The functionalized electrode allows a large extent of PtRu adsorption as compared to the untreated one. The observed catalytic ability enhancement is attributed to the functional groups on the carbon surface that promotes the oxidation of methanol with nearby PtRu.
-0.2 0.0 0.2 0.4 0.6 0.8 1.0 1.2
-8
-4
0
4
8
12
I/
m
A
c
m
-2E/V vs. Ag/AgCl
XC -re-0.9v 1st cycle XC -re-0.9v 20th cycle XC -re-1.1v 1st cycle XC -re-1.1v 20th cycle(A)
-0.2 0.0 0.2 0.4 0.6 0.8 1.0 1.2
-3
-2
-1
0
1
2
3
4
(B)
I/
m
A
c
m
-2E/V vs. Ag/AgCl
CV scan 1st cycle CV scan 20th cycleFigure 1(A) provides the CV profiles at first and 20th cycles for the samples of re-0.9v and re-1.1v. (B) CV profiles for electrodes containing carbon cloth, and Nafion ionomer, undergoing surface treatments with O2 supplied from ambient.
2020 ecsdl.org/site/terms_use) unless CC License in place (see abstract). address. Redistribution subject to ECS terms of use (see
140.113.38.11
1000 1500 2000 XC-re 0.9V
In
te
n
s
it
y
/
a
.u
.
Wavelength / cm
-1 XC-H2SO4 D-band G-band XC-re 1.1V XC-re 1.4VFigure 2 Raman spectra for electrodes after surface treatments in various CV scans and H2SO4 immersion.
1000 800 600 400 200 0 FKLL XC-re-1.4V XC-re-1.1V
In
te
n
s
it
y
/
a
.u
.
Binding Energy / eV
XC-H2SO4 XC-re-0.9V F1s O1S C1SFigure 3 XPS profiles for electrodes after surface treatments in CV scans and H2SO4
immersion. The untreated one is the as-prepared electrode for comparison purpose.
2022 ecsdl.org/site/terms_use) unless CC License in place (see abstract). address. Redistribution subject to ECS terms of use (see
140.113.38.11
294 292 290 288 286 284 282
In
te
n
s
it
y
/
a
.u
.
Binding Energy / eV
XC-H2SO4 XC-re-0.9V XC-re-1.1V XC-re-1.4V(A)
C1s294
292
290
288
286
284
282
In
te
n
s
it
y
/
a
.u
.
Binding Energy / eV
(B)
C-C sp2/sp3 C-OH C=O C-OOH C-FFigure 4(A) C1s XPS profiles for electrodes after surface treatments in various CV scans and H2SO4 immersion. (B) Curve-fitting of the C1s XPS profile for the electrode after
-0.2 0.0 0.2 0.4 0.6 0.8 1.0 -20 0 20 40 60 80
I/
m
A
c
m
-2E/V vs. Ag/AgCl
XC-H2SO4 XC-re-0.9V XC-re-1.1V XC-re-1.4V(A)
-0.2 0.0 0.2 0.4 0.6 0.8 1.0 -100 0 100 200 300 400 XC-H2SO4 XC-re-0.9V XC-re-1.1V XC-re-1.4V(B)
I/
m
A
P
t
-1m
g
-1E/V vs. Ag/AgCl
Figure 5 CV profiles for methanol electro-oxidation in (A) apparent current density, and (B) mass activity. The electrodes underwent surface treatments in CV scans and H2SO4
immersion
2024 ecsdl.org/site/terms_use) unless CC License in place (see abstract). address. Redistribution subject to ECS terms of use (see
140.113.38.11
TABLE I. Raman and XPS D/Ga) C%b) O% b) F% b) C-O/C-C b) XC- H2SO4 2.57 73.8 2.5 23.7 0.47 XC-re-0.9V 2.59 72.5 4.9 22.6 0.48 XC-re-1.1V 2.67 70.5 10.1 19.4 0.92 XC-re-1.4V 2.53 70.1 12.4 17.5 0.53
a) ratio value obtained from Raman. b) ratio value obtained from XPS.
Table II. Loading of PtRu and Pt, as well as electrochemical parameters from CV curves in apparent
current density and mass activity of PtRu nanoparticles deposited on carbon supports.
Loading Forward scan Backward scan
PtRua) Ptb) Vfc) ifd) ife) Vbf) ibg) ibh)
μg/cm2 at% (mV) mA/cm2 (Pt•mg) mA/ (mV) mA/cm2 (Pt•mg) mA/
XC- H2SO4 102.8 77 532 17.2 218.2 438 1.0 12.2 XC-re-0.9V 150.0 78 528 32.0 273.6 420 11.2 96.1 XC-re-1.1V 257.4 78 635 71.5 355.7 525 40.4 201 XC-re-1.4V 99.8 77 538 27.3 353.9 451 7.4 95.8 a
total weight of PtRu as determined by ICP-MS
b
Pt in PtRu atomic ratio
c
peak potential in anodic scan
d
peak apparent current density in anodic scan
e
peak mass activity in anodic scan
f
peak potential in cathodic scan
g
peak apparent current density in cathodic scan
h
peak mass activity in cathodic scan
Acknowledgments
Financial supports from the National Science Council of Taiwan and National Synchrotron Radiation Research Center are highly appreciated.
References
1. J. H. En, M. Y. Wang, B. Liu, Z. Fan, K. Z. Cui and Y. Kuang, Journal of
Physical Chemistry B, 110, 11775 (2006).
2. S. Stevanovic, V. Panic, D. Tripkovic and V. M. Jovanovic, Electrochem.
Commun., 11, 19 (2009).
3. C. Chen, T.F. Fuller, J. Electrochem. Soc. 156, B1218 (2009).
4. J. Wang, G. Yin, Y. Shao, S. Zhang, Z. Wang, Y. Gao, J. Power Sources, 171, 331 (2007).
5. G. Zhang, S. Sun, D. Yang, J.P. Dodelet, E. Sacher, Carbon, 46, 196 (2008). 6. Z.B. Wang, G.P. Yin, J. Zhang, Y.C. Sun, P.F. Shi, Electrochim. Acta, 51, 5691
(2006)
7. T.C. Deivaraj, J.Y. Lee, J. Power Sources, 142, 43 (2005).
8. Z. Liu, M Shamsuzzoha, E.T. Ada, W.M. Reichert, D.E. Nikles, J. Power Sources,
164, 472 (2007).
2026 ecsdl.org/site/terms_use) unless CC License in place (see abstract). address. Redistribution subject to ECS terms of use (see
140.113.38.11