碩
士
論
文
利 用 腦 電 波 訊 號 之 循 環 交 替 模 式 偵 測
Detection of Cyclic Alternating Pattern
in Electroencephalographic Signals
研 究 生:李健銘
指導教授:陳永昇 博士
國 立 交 通 大 學
資 訊 工 程 研 究 所
碩 士 論 文
A Thesis
Submitted to Institute of Computer Science and Engineering College of Computer Science
National Chiao Tung University in partial Fulfillment of the Requirements
for the Degree of Master
in
Computer Science August 2011
Hsinchu, Taiwan, Republic of China
to
Institute of Computer Science and Engineering
College of Computer Science
in partial fulfillment of the requirements for the degree of
Master in the subject of
Computer Science
National Chiao Tung University Hsinchu, Taiwan
i
發展改良型長度變化模板式演算法來進行睡眠循環交替模式之偵測。在本演算法中,比
較相對性的功率譜數值與閾值來判斷循環交替模式中的A-phase 之存在與否和長度,而
在判斷出A-phase 之後,利用循環交替模式之標準評比方式決定出單一睡眠循環與睡眠
循環序列。在A-phase 之子模式分類中則結合相關 Carlo Navona 等學者在 2002 年所提
出之方法、碎型維度與k 最近鄰居法分類器以提升分類準確度。 首先我們利用二位有失眠疾病的受測者的睡眠腦波作為腦電波特徵的測試資料,此 兩位受試者循環交替模式之偵測準確度為66%,A-phase 之子模式分類準確度為 67%。 並藉由和Barcaro 演算法做比較,驗證本演算法結合改良型長度變化模板式演算法與閾 值之優越性。接著我們利用147 位呼吸中止指數大於五的呼吸中止症受試者與 41 位呼 吸中止指數小於五的無呼吸中止症受試者睡眠腦波作為腦電波特徵的測試資料。在不同 的年齡層中,計算循環交替模式率的結果,呼吸中止症的受測者顯著高於無呼吸中止症 的受測者。且在重度呼吸中止症受試者之循環交替模式率會有顯著提升。可驗證我們所 設計的睡眠循環交替模式演算法能夠偵測到可信賴的循環交替模式率。
ii
Our study has inherited advantages of previous methods. It employed the descriptor of power spectrum, because the descriptor of power spectrum can provide a normalized measure. It also made use of the improved variable length template to detect the most suitable A-phase length of CAP detection algorithm. In order to decide A-phases’ length and existence, our method made use of descriptor to compare with threshold. After the detection of A-phase, it is used for determining CAP cycle and CAP sequence by CAP scoring rule. In the classification of A-phase subtypes, our method has attempted to enhance classification accuracy by using Navona classification method, fractal dimension, and k-NN classifier.
In our experiment, we applied sleep EEG features of two insomnia subject's brain waves as the testing data. The accuracy of the proposed method is 65% in the CAP detection and 70.30% in A1, 24.4% in A2, and 65.4% in A3 in the classification of A-phase of subtypes. The proposed method combines variable length template method and EXIST/LENGTH thresholds method. Compared to Barcaro method, the proposed method is superior because of its usage of variable length template. We also used sleep EEG of 147 obstructive sleep apnea syndrome (OSAS) subjects and 41 non-OSAS subjects as the testing data. The CAP rates of 188 OSAS patients obtained by the proposed method are higher than those of non-OSAS subjects, which is consistent to the literature. For the severe OSAS subjects, the CAP detection results show increased values of CAP rates.
iii
循環交替模式人工判讀的結果作為我們比較的基準。
碩士學業結束代表我將進入人生的另外一個階段,這兩年來的回憶與經驗讓我受益匪淺, 也讓我對人生有一些自己的體悟,相信對人生的下一個階段有所幫助。謝謝所有幫助我 鼓勵我的人,謹以此論文獻給我的家人。
1.2.3 Macrostructure : sleep stage and Rechtschaffen and Kales rules . . 4
1.2.4 Microstructure : Arousal and CAP . . . 8
1.3 Cyclic Alternating Pattern . . . 8
1.3.1 CAP A-phase EEG events . . . 11
1.3.2 Scoring Rules for CAP or non-CAP . . . 13
1.4 Subtypes of A-phase . . . 16
1.5 Thesis overview . . . 17
2 Automated Detection Algorithm for Cyclic Alternating Pattern 21 2.1 Introduction to automated cyclic alternating pattern detection . . . 22
2.2 Survey of automated cyclic alternating pattern methods . . . 23
2.2.1 Feature extraction method . . . 23
2.2.2 Detection methods . . . 29
2.2.3 Discussion of previous method . . . 30
2.3 The proposed method . . . 31
2.3.1 Signal preprocessing . . . 31
2.3.2 Feature extraction . . . 32
2.3.3 A-phase detector . . . 34
2.3.4 Context decision . . . 35
2.3.5 Classification of A-phase subtypes . . . 36 v
4.1.5 Vertex sharp wave . . . 68
4.2 Hjorth parameter . . . 68
4.3 Fractal dimension . . . 71
4.4 Subtypes . . . 72
4.5 Problems of automated CAP detection . . . 72
4.5.1 Reasons for bad classification . . . 72
5 Conclusions and Future Works 77 5.1 Conclusions . . . 78
5.2 Future works . . . 78
Bibliography 81
1.10 Examples of A-phase subtypes of CAP . . . 19
2.1 Framework of cyclic alternating pattern sequence classification . . . 23
2.2 Example of gains to classified CAPS automatically . . . 24
2.3 Descriptor sample . . . 26
2.4 Fractal dimension with A-phase subphase . . . 27
2.5 Variable length template matched filters . . . 30
2.6 EXIST/LENGTH Threshold Decision . . . 38
2.7 The A-phase detector of the proposed method . . . 39
2.8 The context decision procedure of the proposed method. . . 40
2.9 The A-phase subtypes classification method used in the previous study. . . 41
2.10 The proposed A-phase subtypes classification method which is combined with the k-NN classification method and A-phase classifier. . . 42
3.1 The CAP rates of OSAS and non-OSAS subjects in different age groups. . . 46
3.2 The CAP rates of mild OSAS, moderate OSAS, severe OSAS and non-OSAS subjects in different age groups. . . 46
3.3 CAP rate of two subjects with A-phases of RemLogic result and CAP report 47 3.4 Capsnogram of Subject1 with A-phases of RemLogic result and CAP report 48 3.5 Capsnogram of Subject2 with A-phases of RemLogic result and CAP report 49 3.6 CAP rate analysis of two subject . . . 50
3.7 Evaluation of A-phases classification of two subjects . . . 53 vii
4.9 CAP rate compare with fractal dimension . . . 71 4.10 A-phase accuracy compare with fractal dimension . . . 72 4.11 CAP subtypes classification results of Subject1 of two kinds of ground truth
in four classify methods . . . 73 4.12 CAP subtypes classification results of Subject2 of two kinds of ground truth
in four classify methods . . . 74
3.5 Ground truth . . . 59
3.6 Accuracy of Subtypes of the proposed method . . . 59
4.1 CAP A-phase detection without vertex sharp wave . . . 68
4.2 CAP A-phase detection with vertex sharp wave . . . 68
1.1
Motivation
Sleep plays an important role in our life. On the average, people spend one-third of their life times sleeping. Therefore, sleep quality is essential for good quality of life. The sleep quality will bring people a lot of advantages, such as increased concentration, increased physical activity, increased ability of body cell requirement, and lowering blood pressure. The poor quality of sleep may lead to the lack of concentration, fatigue, high blood pres-sure, stress increases, and other negative affective states. Nowadays, varies types of sleep disorders such as narcolepsy [18], obstacle sleep apnea, and insomnia, may result in poor sleep quality.
In the past study, sleep-related research have been a lot, in which there is a large part of the analysis on the quality of sleep. Many researches used polysomnography (PSG) to record sleep signals and utilized subjective self-report such as Pittsburgh sleep quality index (PSQI) for analysis. Because we also need objective analysis of sleep quality, human sleep Electroencephalography (EEG) scored by PSG could be used to analyze the quality of sleep. There are two parts of sleep quality analysis used sleep EEG. One is sleep staging of macrostructure, the other is arousal and CAP of microstructure. We plan to develop an algorithm for accurate CAP classification of the micro-organization of human sleep Electroencephalography (EEG) without human intervention.
sors, amplifiers, filters, analog-digital converters and computer with peripheral devices. The PSG could use EEG, EOG, and EMG to automatically analyze sleep stages and use EEG to automatically analyze CAP, then provide sleep stage report and CAP report. The PSG system also could use respiration, snoring, and oxygen saturation values for analyzing sleep related breathing disorders and other parameters such as body temperature, ECG, and blood pressure have their own usefulness in sleep research. Although most PSG system has the function of sleep scoring and CAP detection, most sleep specialist would rather score manually and the PSG system report is used for reference. Due to sleep scoring system is unreliable; PSG system is only for signal acquisition. Now in Taiwan, many hospitals set up sleep center. In sleep center, they have professional devices and suitable environ-ments for sleep data recording. These two reason is needed for reducing noise while signal recording.
1.2.2
Sleep EEG
Sleep is a complex behavioral and physiological process. In the sleep EEG, the signal for the analysis of sleep is divided into two major categories of macrostructure and mi-crostructure. Macrostructure of sleep has some parameters, such as total sleep time, time in bed, sleep efficiency, sleep latency, wake after sleep onset, sleep stages, rapid eye move-ment latency. Macrostructure part is the analysis of sleep stages. Sleep signals are used to analyze sleep stages according to R & K procedure. The sleep signal is divided every 20s or 30s as an epoch of sleep stage classification. In sleep, it can be divided into two states which are rapid eye movement (REM) and non-rapid eye movement (NREM). REM sleep
than alpha waves. Delta waves are the highest amplitude and the slowest EEG rhythms. Theta waves and delta waves become more and more obvious in the EEG background ac-tivities during deep sleep. Microstructure part is divided into two types of arousal and CAP. Arousal represents the fragmentation of sleep and sleep signal is applied to arousal analysis which calculates the number of occurrences of sleep arousal. Another is that the direction of this study, Cyclic alternating pattern (CAP). CAP is a defense mechanism of sleep, be-cause CAP likes a sentinel in accordance with the same physical condition at certain times to certain frequencies or the length of time to do some physical state monitoring. If CAP sequences appear frequently, it indicates the sleep state is tight, sleep phenomenon is not stable and the sleep quality is poor. However, If CAP sequences appear infrequently, there are health problems that may not be dealt with timely. Therefore, CAP is very important indicator in sleep quality analysis.
1.2.3
Macrostructure : sleep stage and Rechtschaffen and Kales rules
In the last 4 decades, the standard of classification of the single sleep stages, which is proposed by Rechtschaffen and Kales in 1968 [13], has been widely used. The stan-dard of the single sleep stage classification which is proposed by Rechtschaffen and Kales (R&K) paradigm is based on the electroencephalogram (EEG), electrooculogram (EOG), and electromyogram (EMG). In EEG, it is the minimum requirement of central leads of EEG such as C3-A2 and C4-A1 and occipital leads such as O2-A1 and O1-A2 are addi-tionally recorded. Two EOG leads are placed at the outer corners of the eyes to detect
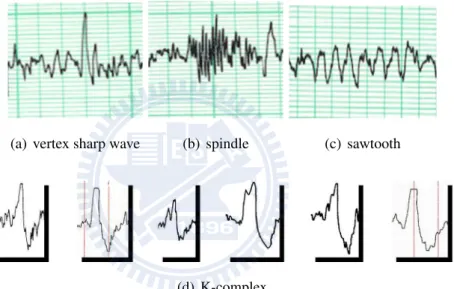
(a) vertex sharp wave (b) spindle (c) sawtooth
(d) K-complex
Figure 1.1: (a) vertex sharp wave; (b) spindle wave; (c) sawtooth wave; (d) K-complex wave
• Stage W (Wakefulness): The EEG contains alpha activity with low voltage or not and mixed frequency activity.
• Stage 1: Stage 1 is the beginning of the sleep cycle. it is characterized by the low voltage and mixed frequency of EEG signal. Stage 1 can be considered the transition between wakefulness and other sleep stages. In Stage 1, the alpha wave is less than 50% in overall epoch and the slow wave with sharp negative voltage which is called vertex sharp wave may appear in the EEG.
drowsy
Stage1
1.Relatively low voltage, mixed frequency; 2.May be theta (3-7 cps) activity with greater ampli-tude 3.Vertex sharp waves; 4.Synchronous high-voltage theta bursts in children
SEMs Tonic activity, may
be slight decrease from waking
NREM Stage2
Background: relatively low voltage, mixed fre-quency; Sleep spindles: waxing, waning, 12-14 cps (>0.5sec); K complex: negative sharp wave followed immediately by slower positive compo-nent (>0.5sec); spindles may ride on KCs; KCs maximal in vertex; spontaneous or in response to sound
Occasionally SEMs near sleep onset
Tonic activity, low level
Stage3 20%-50% high amplitude (>75 uV), slow fre-quency (<2cps); maximal in frontal
None, picks up EEG
Tonic suppression; phasic twitches Stage4 >50% high amplitude, slow frequency None, picks up
EEG
Tonic activity, low level
REM Relatively low voltage, mixed frequency Phasic REMs Tonic suppression; phasic twitches
Adopted from Principles and Practice of Sleep Medicine, 2nd Ed. W.B. SAUNDERS company, which is modified from Rechtschaffen A, Kales A (eds): A Manual of Standardized Terminology: Techniques and Scoring System for Sleep Stages of Human Subjects. Los Angeles, UCLA Brain Information Service/Brain Research Institute, 1968.
• Stage 4: Stage 4 contains more than 50% slow delta waves of an epoch.
• Stage REM: In most human adults, Stage REM accounts for 20%25% of total sleep time. Stage REM is defined by a relatively low voltage, mixed frequency EEG. In Stage REM state, it may appear sawtooth wave, which is looks like a sawtooth.
Physiological significance Sleep fragmentation Sleep instability
(Figure source:Origin and Significance of the Cyclic Alternating Pattern (CAP), Sleep Medicine Reviews,Mario Giovanni Terzano and Liborio Parrino, 2000.)
1.2.4
Microstructure : Arousal and CAP
In the sleep microstructure analysis, we introduce above that contains CAP and arousal. In this section, we will introduce these two kinds of EEG phenomena of sleep microstruc-ture of their characteristics and their differences and similarities. The EEG phenomena of sleep microstructure are an important research to attempt to overcome the limitations of the macrostructure. In sleep analysis, CAP plays an important role on the investigation of sleep instability and arousal quantification is a significant indicator of sleep fragmentation. In this field, we also unsure whether arousals and CAP A-phase are primary cerebral phe-nomena or evoked responses to activating peripheral events [17]. Both studies have some differences and similarities we present in the Table 1.2 and Table 1.3 [17].
1.3
Cyclic Alternating Pattern
A clinical meaning of CAP is that a number of sleep disorders can be qualified as relat-ing either to the A-phase or to the B-phase [16]. CAP is an index to determine the quality of sleeping and as a marker of arousal instability. CAP can appear spontaneously in non-REM sleep, but it can occur also in association with identifiable sleep pathophysiologies
and neurovegetative activities
Increased amounts of arousals and of CAP rate both reflect a condition of disturbed sleep
(Figure source:Origin and Significance of the Cyclic Alternating Pattern (CAP), Sleep Medicine Reviews,Mario Giovanni Terzano and Liborio Parrino, 2000.)
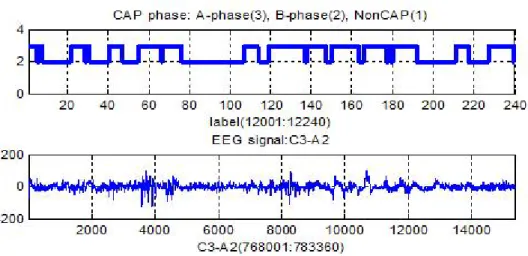
(e.g. sleep-disordered breathing and periodic leg movement activity) [1]. CAP occurs not only at drowsiness and light sleep, but in all NREM stages. The CAP sequence, originally conceptualized as an arousal phenomenon, has evolved theoretically to encompass both the process of sleep maintenance and sleep instability. When falling into sleep, information is exchanged among many parts of brain during consciousness, and the frequency of in-formation exchanging reduces, while the exchanges won’t disappear. During sleep, EEG would show the waves with higher frequency and amplitude, which calls ”micro-arousal”. This kind of micro-arousal is to detect whether our body has problem or not. That is why we say CAP likes the sentinel. CAP time and CAP rate can be used to evaluate the sleep efficiency. CAP time can be calculated throughout total NREM sleep and within the single NREM stages. CAP rate is defined by the ratio of CAP time to sleep time. By detecting the rate of CAP which can be measured in NREM sleep (the ratio of CAP time to NREM stage time) and in the single NREM stages (the ratio of CAP time to a given NREM stage to the total duration), the higher the CAP rate the poorer sleep quality. Many factors may affect the CAP rate. For example, CAP rate is increased by perturbing conditions and de-creased by hypnotic medication. But the strongest factor is age. Some previous researches show that CAP rate shows a u-shape evolution along the life span (teenagers: mean 43.4%;
Figure 1.2: CAP sequence and EEG signal C3-A2
young adults: 31.9%; middle aged: 37.5%; elderly: 55.3% [17]) in human sleep. We can observe micro cyclical alternation of sleep by a diagram which is called sleep capsnogram. As shown in Figure 1.2, it appears different CAP phases following with different time in sleep process.
The CAP subtype classification extends the current American Sleep Disorders Asso-ciation (ASDA) definitions to include a periodicity dimension and a possible marker of pre-arousal activation regarding CAP to be an arousal process [15] [2]. These typically transient events such as EEG bursts with high-amplitude, delta-like wave or K-complex sequence are considered to reflect a possible arousal process. According some sleep phe-nomena with sleep instability, CAP A-phase can classify as the type of slow wave activity (subtypes A1 of CAP) marks the brains attempt to preserve sleep and subtypes A2 and A3 of CAP with the high-amplitude, slow activity to perform that sleep becomes too unstable or the preservation attempt fails.
CAP analysis is not a method to replace sleep staging or arousal scoring. But CAP analysis is a quantitative sleep analysis and provides a tool to use in our quest to look at human sleep.
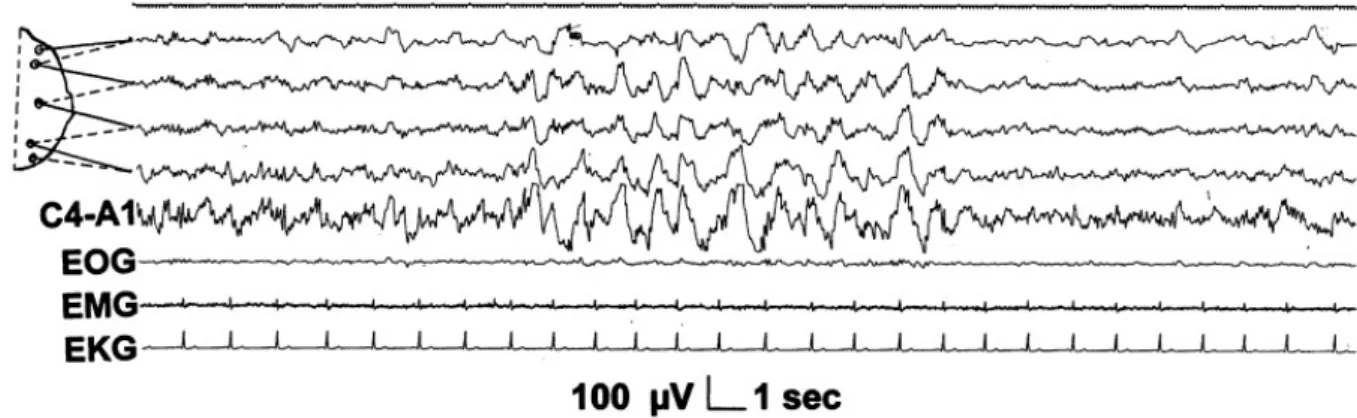
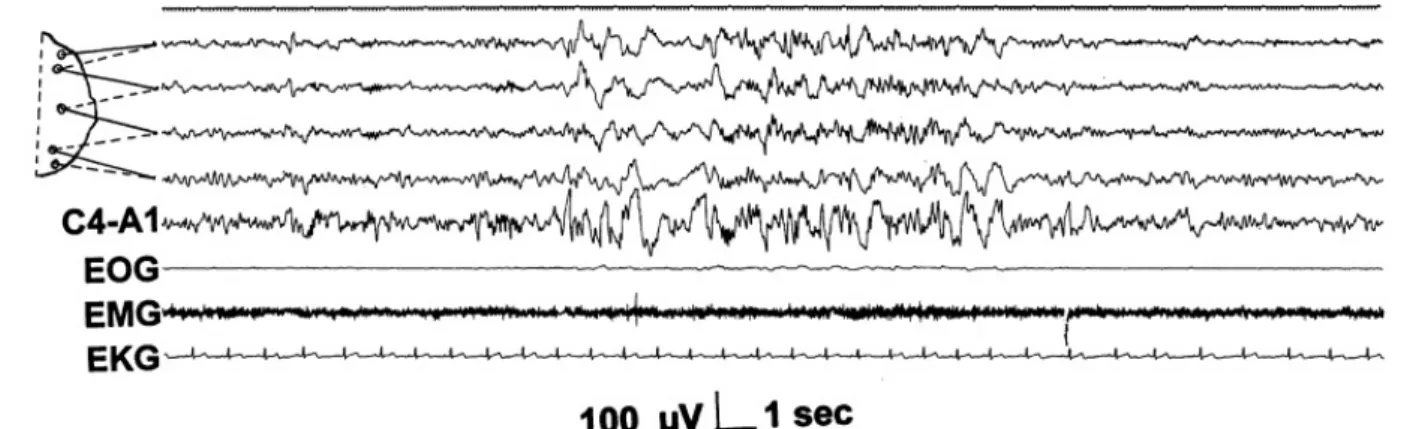
Figure 1.3: Delta burst. Top 4 channels is Bioplolar parasagittal EEG derivation of the right side : FP2F4 , F4C4 , C4P4 , P4O2; C4A1: C4 connects to left ear (A1); EOG: Elec-trooculogram; EMG: Electromyogram; EKG: Electrocardiogram. (Figure source: Sleep Medicine 3, Consensus Report, Mario Giovanni Terzano et al.: Atlas, rules, and recording techniques for the scoring of cyclic alternating pattern (CAP) in human sleep, p 187-199, 2002)
1.3.1
CAP A-phase EEG events
In this section, we introduce CAP A-phase EEG events. A-phase can be composed of rhythms with slower and higher-voltage, rhythms with faster and lower-voltage, or by mixed patterns including both. They may include: delta bursts, vertex sharp transients, K-complex sequences with or without spindles, polyphasic bursts, K-alpha, intermittent alpha, and EEG arousals [15].
Delta bursts
The EEG delta burst is a wave with frequency range from 0.5 to 4 Hz and with at least 1/3 higher average amplitude than the background signal activity.
Vertex sharp transients
Vertex sharp transients are EEG potentials which has variable amplitude (up to 250 mV) and length of time between 50 ms to 200 ms. Sequences of vertex sharp transients are composed at least two repetitive potentials lasting at least 2 s.
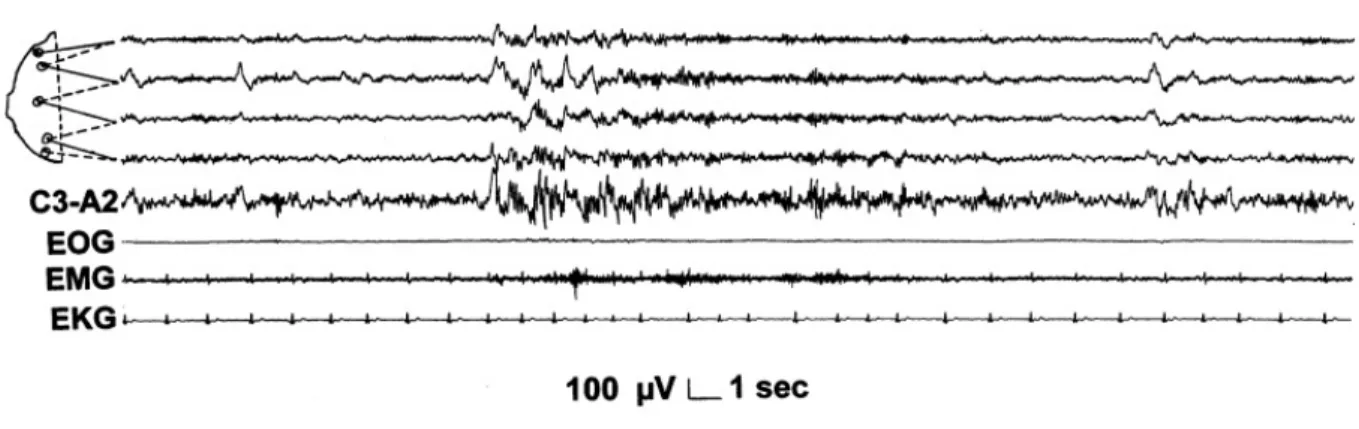
Figure 1.4: Sequence of vertex sharp transients. Top 4 channels: Bipolar parasagittal EEG derivation on the left side : P3O1 , F7T3 , T3T5 , FzCz; C3A2: C3 connected to right ear (A2). (Figure source: Sleep Medicine 3, Consensus Report, Mario Giovanni Terzano et al.: Atlas, rules, and recording techniques for the scoring of cyclic alternating pattern (CAP) in human sleep, p 187-199, 2002)
K-complex sequences with or without spindles
complex sequences is composed at least two consecutive complexes. Each K-complex presents a biphasic pattern or triphasic pattern consisting of a rapid negative com-ponent and a slower positive wave. The K-complex may be mixed with or followed by a sleep spindle. The length of time of a single K-complex is between 0.5 to 2 s; therefore, K-complex sequence duration is more than 2 s.
Polyphasic bursts
Polyphasic bursts consist of high-voltage delta waves and intermixed with theta, alpha, or beta waves. Polyphasic bursts can include at least two delta peaks.
K-alpha
K-alpha is composed of a K-complex and the following as an alpha (8-13 Hz) burst. The overall duration of K-alpha is at least 2 s.
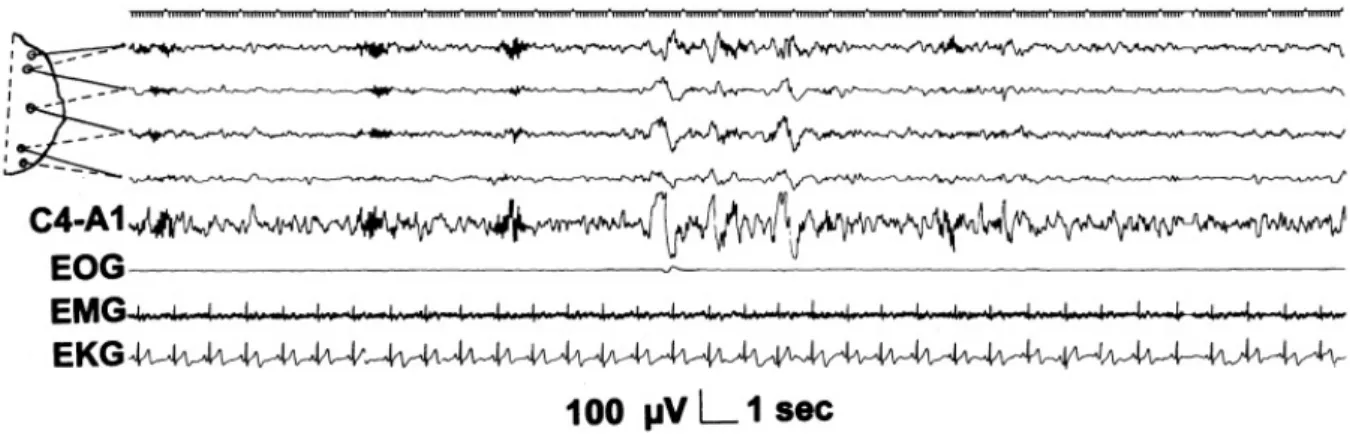
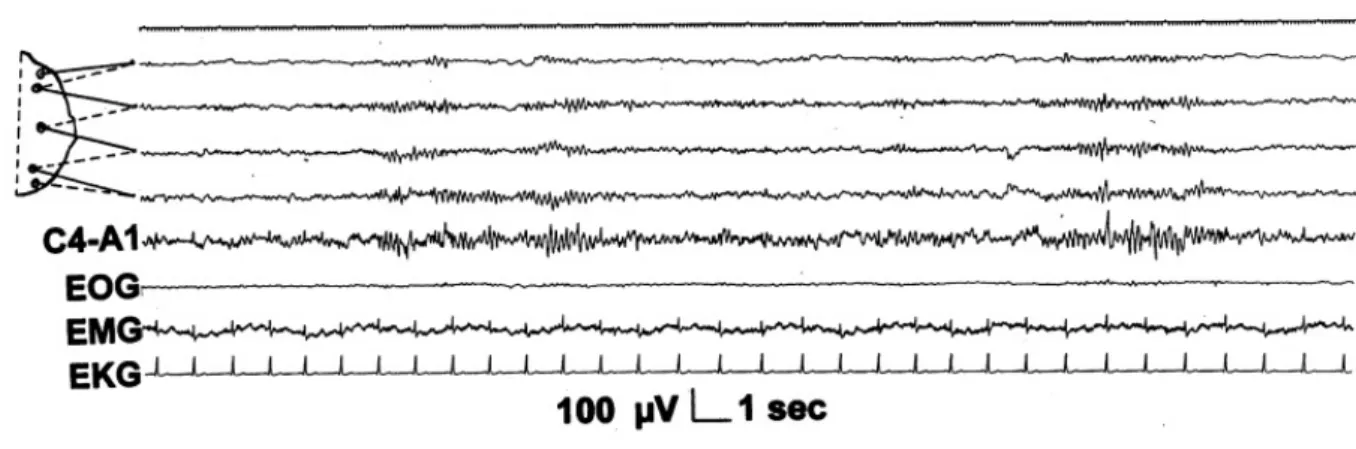
Figure 1.5: K-complexes sequences associated with spindles. Top 5 channels: EEG deriva-tion as in Figure 1.3 (Figure source: Sleep Medicine 3, Consensus Report, Mario Giovanni Terzano et al.: Atlas, rules, and recording techniques for the scoring of cyclic alternating pattern (CAP) in human sleep, p 187-199, 2002).
Intermittent alpha
At sleep onset, the alpha rhythm field tends to spread forward, then it fragments into intermittent sequences in sleep stage 1. When sleep progresses, it disappears. Before it vanishes, the EEG activity of Alpha may also increase in amplitude and decrease in frequency.
EEG arousals
EEG arousals could interrupt sleep continuity shortly and the duration of EEG arousals is more than 3 s. It is a phenomenon that are sudden frequency shifts to faster rhythms such as theta, alpha, beta, but not spindles.
1.3.2
Scoring Rules for CAP or non-CAP
From previous researches, we can list systematically with CAP scoring rules [15]. Requirements for scoring a CAP sequence
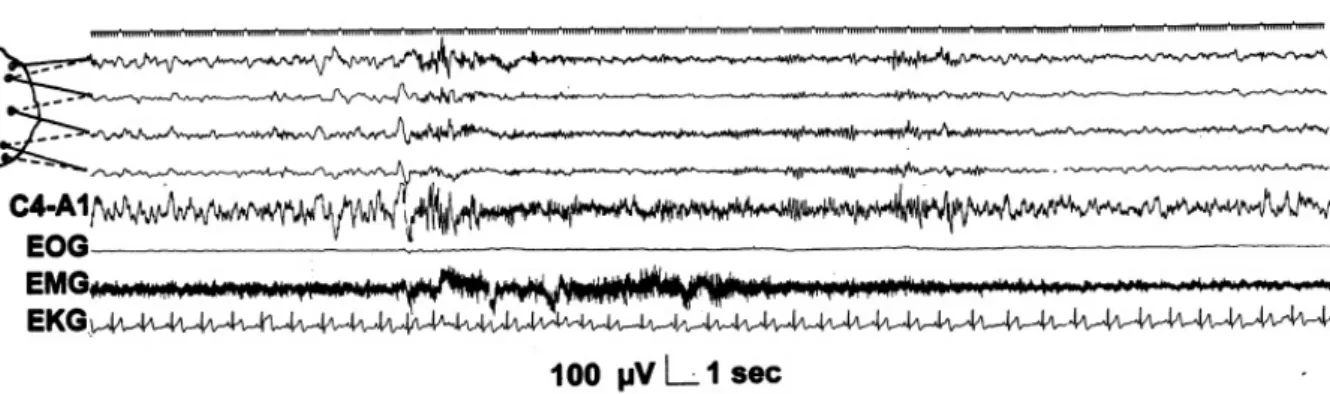
Figure 1.6: Polyphasic burst in stage 2 sleep. Top 5 channels: EEG derivation as in Fig-ure 1.3 (FigFig-ure source: Sleep Medicine 3, Consensus Report, Mario Giovanni Terzano et al.: Atlas, rules, and recording techniques for the scoring of cyclic alternating pattern (CAP) in human sleep, p 187-199, 2002).
2. Each CAP sequence is composed of at least two CAP cycles. Onset and termination of a CAP sequence
3. All CAP sequences start with a A-phase and end with a B-phase. Non-CAP
4. If the CAP sequence disappear more than 60 s, This period of time is scored non-CAP. 5. An isolated A-phase means that is preceded or followed by another A-phase but the
duration between them is more than 60 s. An isolated A-phase is scored non-CAP. 6. The A-phase in the end of the CAP sequence is scored as non-CAP.
7. B-phase with duration between 2 s and 60 s is the signal between two A-phases. Minimal criteria for the detection of a CAP sequence
8. CAP sequences have no upper limits on overall duration and on the number of CAP cycles.
Figure 1.7: K-alpha complex in stage 2 sleep. Top 5 channels: EEG derivation as in Figure 1.4 (Figure source: Sleep Medicine 3, Consensus Report, Mario Giovanni Terzano et al.: Atlas, rules, and recording techniques for the scoring of cyclic alternating pattern (CAP) in human sleep, p 187-199, 2002).
Stage shifts
9. CAP sequence is scored in non-REM sleep and CAP sequence scoring can extend across adjacent sleep stages so it is not interrupted by a sleep stage shift.
Temporal limits
10. Each phase of CAP is between 2 s and 60 s in duration.
11. If the B-phase between two A-phases less than 2 s, the two A-phases are scored an A-phase.
12. If the B-phase between two A-phases longer than 60 s, the two A-phases is scored two different CAP sequences.
Amplitude limits
13. phase is the repetitive element represented by the recurring EEG feature. The A-phases phasic activities is at least 1/3 higher average amplitude than the background signal activity.
Figure 1.8: Intermittent alpha rhythm in stage 1 sleep. Top 5 channels: EEG derivation as in Figure 1.3 (Figure source: Sleep Medicine 3, Consensus Report, Mario Giovanni Terzano et al.: Atlas, rules, and recording techniques for the scoring of cyclic alternating pattern (CAP) in human sleep, p 187-199, 2002).
14. B-phase is a background signal. Phase B is used to separate the A-phase.
1.4
Subtypes of A-phase
CAP A-phase involves different degrees from EEG activities, muscle tone and neu-rovegetative responses, so A-phase can be classified into three subtypes. There are A1, A2, and A3. The three subtypes classification is based on the percentage of EEG synchrony and EEG desynchrony in the all A-phase duration. EEG synchrony is the reciprocal pro-portion of high-voltage slow waves and EEG desynchrony is low-amplitude fast rhythms. The following are three subtypes description. [15]
subtypes A1: In subtypes A1, this A phase primary with EEG synchrony patterns in-volves intermittent alpha rhythm in stage 1, sequences of K-complexes or delta bursts in the other NREM stages, vertex sharp transients, and polyphasic bursts. Subtypes A1 with EEG desynchrony activity is below 20% of all A-phase duration.
subtypes A2: In subtypes A2, this A-phase mixes with EEG desynchrony patterns and slow high-voltage waves such as K-complexes with alpha and beta activities, K-alpha and arousals with slow wave synchronization. Subtypes A2 with EEG desynchrony activity is
Figure 1.9: Arousal preceded and followed by sleep. Top 5 channels: EEG derivation as in Figure 1.3 (Figure source: Sleep Medicine 3, Consensus Report, Mario Giovanni Terzano et al.: Atlas, rules, and recording techniques for the scoring of cyclic alternating pattern (CAP) in human sleep, p 187-199, 2002).
20-50% of all A-phase duration.
subtypes A3: In subtypes A3, this A phase with desynchronized EEG patterns involves transient activation phases, EEG arousals, K-alpha, and polyphasic bursts. The A3 subtypes is primary with rapid low-voltage rhythms and with over 50% EEG desynchrony activity of all A-phase duration.
Generally, the number of subtypes A1 is more than subtypes A2 and subtypes A3. Because subtypes A1 has different patterns with A2 and A3, A1 is easier distinguished in A-phase than A2 or A3.
1.5
Thesis overview
In this chapter we introduce the purpose of this study at first, and second we introduce analysis system sleep quality as PSG and sleep quality analysis as macrostructure and mi-crostructure. Finally, we introduce about CAP and A-phase subtypes. In Chapter 2, we introduce the automated CAP detection method in the past and the proposed method of modified CAP detection algorithm. In the beginning, we introduce several related work of CAP detection algorithm. By all related work, we talk about two kinds of features used in CAP detection and a new feature to subtypes A-phase classification, and we also mention
Figure 1.10: These samples are separated to represent the A-phase subtypes of CAP. Sam-ple a and b are subtypes A1; samSam-ple c and d are subtypes A2; samSam-ple e, f, g, and h are subtypes A3. (Figure source:Origin and Significance of the Cyclic Alternating Pattern (CAP), Sleep Medicine Reviews,Mario Giovanni Terzano and Liborio Parrino, 2000).
CAP have been extensively explored with the attempt to overcome the limitations of the R & K procedure. In earlier study, an automatic detection system of CAP sequences was proposed by Rosa et al. [14]. The system has three parts: The feature extraction part is an EEG generation model-based maximum likelihood estimator. The detector part is a variable length template matched filter, which adjusts template length to decide A-phase length in order to decide CAP A-phase and non-A-phase. The classification criteria part is a context decision system, which is rule-based on a consensus report by Terzano et al. [15]. Another automatic method was based on the computation of seven descriptors to recogni-tion and classificarecogni-tion of the A-phase proposed by Umberto Barcaro et al. [1]. In order to compute these descriptors, it used two suitable thresholds and simple criteria for logical discrimination [1]. It is also to define a unified method for the auto recognition and quan-titative description of EEG phasic events of sleep microstructure occurring during NREM sleep, particularly arousals, A-phase subtypes of cyclic alternating pattern, and spindles. The conclusion is that visually defined events can be reliably identified by means of auto-matic recognition. Then, an autoauto-matic method for the recognition and classification of the A-phases of the cyclic alternating pattern was proposed by Navona et al. [9]. This method is based on five descriptors computed from different frequency band of EEG signals and for the recognition and classification with a simple procedure with the mathematical and computational points of view. Recently, some features were proposed on the relation with EEG complexity measures, such as fractal dimension (FD), sample entropy, and Hjorth parameter [5] [6]. These studies suggest that features may assist in the detection of sleep dynamic structures.
Figure 2.1: Framework of cyclic alternating pattern sequence classification
2.2
Survey of automated cyclic alternating pattern
meth-ods
Generally, the CAP detection algorithm has a flow chart shown in Figure 2.1. This flow chart includes preprocessing, feature extraction, A-phase detector, and context decision. The automated CAP A-phase subtypes classification with another flow chart that involves preprocessing, feature extraction, and classification. The differences with the CAP detec-tion algorithm are the selecdetec-tion of feature sets and the A-phase detector method. We can get some information about how to combine different feature sets and A-phase detector meth-ods. In automated CAP A-phase subtypes classification, some features were mentioned in previous studies, so we tried to use this information to improve accuracy.
2.2.1
Feature extraction method
In the literature, there are two different EEG feature extraction methods in CAP detec-tion algorithm. There are gains and short-long term ratios. The following is the parameters and descriptions of the two feature extraction methods. After these two features, we
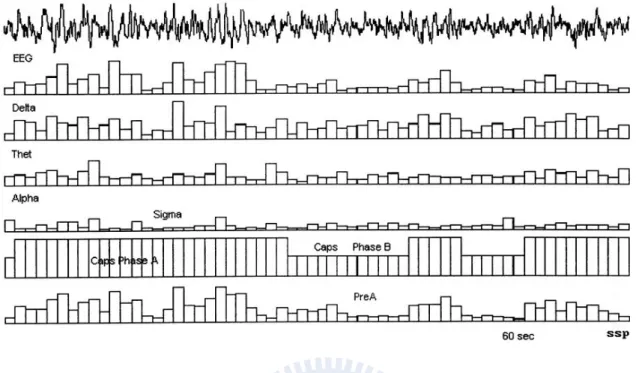
intro-Figure 2.2: An CAP automatic classification result with the duration of 60 s. The top row id the EEG CA-A1 channel. The following 4 rows are the estimated gains of delta band, theta band, alpha band, and sigma band. The sixth row represents CAPS detection result. The hight level is A-phase. The middle level is B-phase. The zero level is NCAPS. The bottom row is the weighted combination of the estimated gains.) (Figure source: Clinical Neurophysiology, A.C. Rosa et al.: Automatic detection of cyclic alternating pattern (CAP) sequences in sleep: preliminary results, p 585-592, 1999)
duce one kind of EEG features used in sleep microstructure analysis.
Gains
The sleep EEG process is described by an EEG generation model with physiological background [4]. The necessary features set for CAP detection algorithm are obtained by estimating the gains shown in Figure 2.2. There are separated four components (delta, theta, alpha, and beta). For each component, a vector of gains was computed every 0.5 or 1 s, so we can get delta, theta, alpha, and sigma activities.
taken two reasons into account: it should be short to provide microstructure information for CAP detection algorithm and long enough to ensure Fourier transform correctness. The long interval value is considered for macrostructure information.
In the third part, the descriptors for each band are computed according the following formula: ShortAveragei = 1 2k i+k X t=i−k e xi(t) (2.1)
where k denoted the number of sample points of 1 s interval and i denoted each point of time. So we compute short average at 2 s interval.
LongAveragei = 1 64k i+32k X t=i−32k e xi(t) (2.2)
where k denoted the number of sample points of 1 s interval and i denoted each point of time. So we compute long average at 64 s interval.
In the third part, the descriptors for each band are computed according the following formula:
descriptori =
ShortAveragei− LongAveragei
LongAveragei
Figure 2.3: The rows from top to bottom are EEG signal C3-A2 channel, delta band de-scriptor, theta band dede-scriptor, alpha band dede-scriptor, sigma band dede-scriptor, and beta band descriptor.
Fractal dimension
In fractal geometry, fractal dimension (FD) is a statistical quantity. The fractal dimen-sion gives an indication of how completely a fractal appears to fill space. Fractal dimendimen-sion used in sleep microstructure was proposed by Chouvarda in 2010 [3]. This work explores the relationship between EEG complexity measures such as fractal dimension and sam-ple entropy, sleep macrostructure structure such as sleep stages, and sleep microstructure structure such as A-phase activation of CAP. FD has the relationship with the transitions between light and deep sleep. Finally, A-phase subtypes A1, A2, and A3 has progressively
Figure 2.4: This figre represents FD in solid blue line, Sleep Stages in dotted red line, and A-phases with subtypes in black dots. A-phase subtypes A1, A2, and A3 has progressively increased its FD values. (Figure source: Annual International Conference of the IEEE EMBS, I. Chouvarda et al.: EEG Complexity during Sleep: on the effect of micro and macro sleep structure , 2010)
increased its FD values. It is shown in Figure 2.4. FD values of show a progressively increase
In the time domain analysis, it is hard to present the signal variability between the dif-ferent of A-phase or non-A-phase since scoring is based on the analysis of EEG power spectrum. But fractal dimension is an EEG complexity measure which can be used to estimate EEG signal variability. Fractal dimension analysis is frequently used in biomed-ical signal processing including EEG analysis. The two types of approaches are used in the applications of FD, those are time domain and phase space domain. Previous meth-ods estimate the FD in the time domain or original waveform domain. We compare three algorithm proposed by Rosana in 2001 [5], Higuchi’s algorithm, Katz’s algorithm and Pet-rosian’s algorithm. In the IEEG signal, the Katz’s algorithm is the most consistent method for distinguishing ability of epileptic states. It is relative insensitivity to noise. Higuchi’s method is a better accurate estimation of FD than other algorithms. But in synthetic data,
skn= {s(n), s(n + k), s(n + 2k), ..., x(n + b
k ck)} ,for n = 1, 2, ..., k (2.4) Where n is initial time value and k shows the time interval between points. Second, The average length Ln(k) is computed as
Ln(k) = bN −n k c X i=1 |s(n + ik) − s(n + (i − 1)k)|(n − 1) bN −m k ck (2.5)
For each time series sk n
Where N is the overall length of data s and (N − 1)bN −nk ck is used to normalize. Third, all time series has the same scale k to compute average length, so the mean of the k length Ln(k) for n = 1, ..., k. This procedure run for each k from 1 to kmax. For each k, the sum
of average length L(k) is L(k) = k X t=1 Ln(k) (2.6)
L(k)is the total average length for scale k. L(k) is proportional to k−D. Then D means the fractal dimension by Higuchi’s method. In the curve of ln(L(k)) versus ln(1/k), we can estimate the FD with the slope of the least squares linear best fit.
ture of this filter is shown in Figure 2.5. The A-phase detector is a filter using template matched method and threshold decision to decide A-phase. First, a sliding unit amplitude square pulse (2 s duration) is convoluted by feature values. Compare with a threshold, if the convolution value is larger than threshold, then repeating the convolution with the square pulse by increasing pulse length 1 s which means variable pulse. At last, the convolution process stops when the convolution value is smaller than threshold. Finally, the length of the square pulse is the length of candidate A-phase and all non-A-phases are candidate B phase.
EXIST/LENGTH threshold decision
Another algorithm for A-phase detection method was proposed in 2002 and 2004. The A-phase detection method use two thresholds and two conditions to recognize and classify the microstructure events and characteristic during sleep, a exist threshold (equal to 1) and a length threshold (equal to 0). The two conditions have a small different setting, by [9], The candidate A-phase condition is at least one descriptor in one of all components above the length threshold for all the points and the A-phase condition is at least one point in delta or the theta descriptor above the recognition threshold in the candidate A-phase. But in [1], except the two conditions are mentioned above, this research gives a restriction to candidate A-phase. The limits of the length of A-phase is that all of these bands’ descriptor of the first two consecutive points at the left and the first two consecutive points at the right below the length threshold. The example is shown in Figure 2.6.
Figure 2.5: ”The implementation structure of the matched filter. The feature input (LL) is windowed (multiplied) by the output of the variable pulse (zero or one) which is controlled by the threshold output (A-phase). The moving average of windowed feature is the input of the threshold block. The whole process is equivalent to a unit amplitude variable length square pulse template filter.” (Figure source: Clinical Neurophysiology, A.C. Rosa et al.: Automatic detection of cyclic alternating pattern (CAP) sequences in sleep: preliminary results, p 585-592, 1999)
2.2.3
Discussion of previous method
After reviewing related researches for automated CAP detection method, we prefer to adopt the method of short-long term ratios and template length filter method.
We choose short-long term ratios because it has some advantages better than each com-ponent’s gain. The features of short-long term ratios are considered the EEG signals re-lationship between short-term variability and long-term variability. Short-long term ratios method is very simple from the mathematical and computational points of view, which pro-vides a strong and significant data reduction from the original EEG signal. These descrip-tors are an extension of powerful macrostructure descripdescrip-tors, some of which are commonly applied to the quantitative analysis of sleep EEG. The method appears extensible to other microstructure phenomena different from the CAP.
2.3
The proposed method
The procedure of CAP detection algorithm can be divided into four main steps: (1) EEG preprocessing, (2) feature extraction, (3) A-phase detector, and (4) context decision. The flow chart of CAP A-phase subtypes has three steps: (1) feature extraction, (2) classifier-based classification, and (3) rule-classifier-based classification. First, EEG raw data is recorded from PSG, then preprocessing for noise removal. Second, some features of the preprocessed EEG signals are extracted. We use seven bands of band power and Hjorth parameter activity to calculate their descriptors and to compute fractal dimension for A-phase detection and subtypes classification. In A-phase detector, we propose an automated method which can adjust parameters and make some extension to detect A-phase. In context decision, we choose some parameters set as same as previous researches. In subtypes classification, we choose k-nearest neighborhood (k-NN) algorithm.
2.3.1
Signal preprocessing
At first, we use the raw EEG signal which is C3-A2 channel, and the sampling fre-quency is 128 Hz. Then, the continuous time EEG signal are segmented with every 0.5-second interval. We choose the segment length of 0.5 0.5-seconds because earlier studies con-sidered about the microstructure and decided a suitable time length. For instance, an 8 hour records will divide into 57600 segments.
in CAP consensus report, we extract the feature sets in the frequency domain. We divide the frequency band into seven sub-bands between 0.5 Hz and 45 Hz. In addition, we also divide the δ band into lower and higher band. The δ band is 0.5-4 Hz. The band is divided into delta (0.5-2.5 Hz) and delta (2.5-4 Hz) ; The θ band is 48 Hz; The α band is 8-12 Hz; The σ band is 12-15 Hz; The β band is 15-25 Hz. Besides, the total band is defined with the range of 0.5-45 Hz. The EEG signal is filtered by using the butterworth filter and the bandwidth of each frequency bands is defined above. These eight frequency bands is shown in Table 2.1.
Table 2.1: Eight frequency bands with its frequency range respectively Frequency band Range (Hz)
1. Total band 0.5-45 2. Delta band 0.5-4 3. Lower delta band 0.5-2.5 4. Higher delta band 2.5-4 5. Theta band 4-8 6. Alpha band 8-12 7. Sigma band 12-15 8. Beta band 15-25
ShortAveragei = 1 5 i+2 X t=i−2 e xi(t) (2.7)
where i denoted each point of time and the band power is average each 0.5 s. So we compute short average between -2 to 2 that depends on the band power average length.
LongAveragei = 1 129 i+64 X t=i−64 e xi(t) (2.8)
where i denoted each point of time and the band power which average each 0.5 s. So we compute long average between -64 to 64 that depends on the band power average length.
In the second part, the descriptors for each band are computed according the following formula :
descriptori =
ShortAveragei− LongAveragei
LongAveragei
(2.9) Because the descriptor provides a relatively measured between the short interval signal instantaneous and background signals variation.
Fractal dimension
In the time domain analysis, it is hard to present the signal variability between the different of A-phase or non-A-phase since scoring is based on the analysis of EEG power spectrum. But fractal dimension is an EEG complexity measure which can be used to estimate EEG signal variability. The proposed method computes one fractal dimension
shape). The activity values are used in the proposed method and calculate in 500 ms time window without overlapping. We compute two activity average values each 0.5 s of the short interval with 2 s and long interval with 64 s, then calculate descriptor as formula 2.9.
2.3.3
A-phase detector
We plan to construct an A-phase detector. The A-phase detector determines the pe-riod of time of the A-phase for all night sleep. In the A-phase detector, we combine two methods that are the variable length template and the EXIST/LENGTH thresholds because we plan to inherit the two methods advantages and to avoid their disadvantages. The variable length template method for CAP detection was proposed in 1999 and the EXIST/LENGTH thresholds method for CAP detection was proposed in 2004. Using the variable length template method to detect A-phase is a more reasonable method than the EXIST/LENGTH thresholds method. Because the EXIST/LENGTH thresholds method determines short-long term ratios of each time point and compares short-long term ra-tios with the EXIST/LENGTH thresholds to decide A-phase or not, the EXIST/LENGTH thresholds method could not make adjustments according to features near the time. The variable length template method could solve the problem. The variable length template can vary template length to cover features near the time to fit template. In the previous A-phase detectors, the EXIST/LENGTH thresholds method used two thresholds (EXIST/LENGTH) is better than the variable length template method used one threshold. In the definition of A-phase, the length of A-phase is decided by all band descriptors. But the exist of A-phase is decided by delta band particularly. The proposed A-phase detector uses two thresholds
Step2. Initial a 2 s sliding unit square pulse to be template.
Step3. Decide what band descriptors we want to use for detecting A-phase.
Step4. Calculate convolution value between template and descriptor values for every band descriptors we use, if one of convolution values is larger than length threshold, then repeating the convolution with the square pulse by increasing pulse length 0.5 s. if not, then sliding the pulse window right 0.5 s.
Step5. stop the convolution process when the convolution value is smaller than threshold. the feature values convoluted by square pulse are candidate A-phase.
Step6. Compare every feature values of candidate phase. If one of the candidate A-phase descriptors of every bands larger than exist threshold, the candidate A-A-phase is called A-phase. The non-A-phase is candidate B-phase.
Step7. We repeat the A-phase detection procedure until all night EEG signals are checked.
2.3.4
Context decision
In this part, we mention about CAP scoring method used to detect CAP sequence and divide non-A-phase into B-phase and non-CAP. CAP scoring is defined by the context decision method considered by previous studies, so we use the same requirements. First, we examine the CAP sequence epoch by epoch. If the epoch’s stage is NREM, then we
than 60 s, is scored non-CAP. 3) The A-phase in the end of the CAP sequence is scored as non-CAP. When all epoch is calculated completely, we can calculate CAP parameter such as CAP rate, average length of CAP sequences to identify the performance of CAP detection algorithm. We follow these rules to develop our algorithm which is shown in Figure 2.8.
2.3.5
Classification of A-phase subtypes
In the classification of A-phase subtypes, we plan to combine previous classification method which was proposed in 2002 and k-NN (k-nearest-neighborhood) classifier to im-prove the classification accuracy. In fact, the sub-phase of the A-phase classification method proposed in 2002 was based on their classification criteria of A-phase. The recog-nition of an A-phase is required that either the delta or the theta descriptor overcomes the threshold. In addition, the recognition of a sub-phase of the A-phase is considered about different bands descriptor which overcomes the recognition threshold. The theta, alpha and beta descriptors are considered for the recognition of the sub-phase. The recognition of the sub-phase should be sufficed that one of the three descriptor overcomes the threshold. If no sub-phase is recognized, then the A-phase is an A1-phase. If a sub-phase is recognized, then the A-phase is an A2-phase or A3-phase. Then the classification of A2-phase and A3-phase is based on tail. The tail is the portion of the A-phase with low values of the delta descriptor. If the tail is shorter than two-fifths of the A-phase length, it is an A2-phase. Otherwise it is an A3-phase. The classification procedure is show in Figure 2.9.
0.5 second and then average all fractal dimension values of entire A-phase. Second, the k-NN classifier is used to classify A1-phase and non-A1-phase by the features of fractal dimension values and time dimension values. Third, delta band descriptor should be cal-culated for the proposed method. Finally, it is used in the proposed method of the criteria to classify A2-phase and A3-phase with the tail. If the tail is shorter than two-fifths of the A-phase length, it is an A2-phase. Otherwise it is an A3-phase.
Figure 2.6: The top curve represents the F4-C4 channel with the duration of 20 seconds. The other rows show the descriptors of seven frequency bands. These bands from top to bottom are delta, lower delta, higher delta, theta, alpha, sigma, and beta. These descriptors are sampled every 0.5 s. (Figure source: Sleep Medicine 5 Original article, Umberto Bar-caro et al.: A general automatic method for the analysis of NREM sleep microstructure, p 567-576, 2004)
Figure 2.10: The proposed A-phase subtypes classification method which is combined with the k-NN classification method and A-phase classifier.
3.1
CAP detection analysis
3.1.1
Data preparation
Subject
In the first part of experiment, the experimental data were acquired in the BGA sleep center in Taichung, Taiwan. There are 188 records which are classified by apnea-hypopnea index (AHI). If the AHI is smaller than 5, the subject is classified as non obstructive sleep apnea syndrome (non-OSAS) subject. If the AHI is larger than 5, the subject is classified as OSAS subject. In the OSAS subjects, there are also classified as mild OSAS (5<AHI<15), moderate OSAS (15<AHI<30), and severe OSAS (AHI>30). These records contain 41 non-OSAS subjects, 51 mild OSAS subjects, 47 moderate OSAS subjects, and 49 severe OSAS subjects. In the second part of experiment, the experimental data were acquired from the sleep center of Tzu-Chi Hospital in Taichung, Taiwan. There are 2 records from 1 male and 1 female. The subjects information table is shown in Table 3.1.
Records
In the first part of experiment, the sleep data were collected by EM BLA Sandman system. In the second part of experiment, the sleep data were collected by EM BLA RemLogicT M system. These data include four EEG channels (C3/A2, C4/A1, O1/A2, and
al. in 2004. We used the previous results to compare with the our results. We analyzed CAP A-phase and A-phase subtypes to explain the proposed CAP detection algorithm advantage and disadvantage with previous method and ground truth. Furthermore, we compared the detection results in different parameters set.
3.1.2
Experimental results of OSAS subjects
In the first part of experiment, the data set include 188 subjects. In [11], it mentioned that the CAP rates of OSAS subjects are significantly higher than those of non-OSAS subjects and CAP analysis shows increased values of CAP rate in severe OSAS. Our ex-perimental results have same conclusions. The CAP rates of 188 OSAS patients obtained by the proposed method are higher than those of non-OSAS subjects, which is consistent to the literature. It is shown in Figure 3.1 and Figure 3.2.
3.1.3
Experimental results of Insomnia subjects
In the second part of experiment, the data set include 2 subjects. These two data set were scored by sleep Registered Polysomnographic Technologists and RemLogic system as our ground truth comparing with results from our method. For the CAP sequences analysis, we classified CAP phases into three classes: A-phase, B-phase, and non-CAP. For the CAP A-phase analysis, we classified CAP phases into two classes: A-phase and non A-phase.
Figure 3.1: The CAP rates of OSAS and non-OSAS subjects in different age groups.
Figure 3.2: The CAP rates of mild OSAS, moderate OSAS, severe OSAS and non-OSAS subjects in different age groups.
Figure 3.3: CAP rate of two subjects with A-phases of RemLogic result and CAP report. The correctness of context decision is needed to prove, so it is compared that the CAP detection result of the proposed method of A-phase from RemLogic system and the CAP report from RemLogic system.
CAP rate
Table 3.2 shows the u-shape evolution along the life span in human sleep [10]. Table 3.6 shows the results of 2 subjects. This table shows the CAP rate of the proposed method, the previous method proposed by Barcaro et al. in 2004, RemLogic system results in CAP report, and RPSGT manual scoring results. Compare with the U-shape, we can figure out that the last two results are too small to fit the general U-shape.
Figure 3.4: The top field contains hyponogram in first row and RemLogic detection result in second row. The bottom field contains hyponogram in first row, A-phases of RemLogic detection result, and its context decision result in the third row.
Figure 3.5: The top field contains hyponogram in first row and RemLogic detection result in second row. The bottom field contains hyponogram in first row, A-phases of RemLogic detection result, and its context decision result in the third row.
Figure 3.6: CAP rate analysis of two subject. CAP rate of two subject of the proposed method, the previous method proposed by Barcaro et al. in 2004, RemLogic system results in CAP report, and RPSGT manual scoring.
First, these data are classified as A-phases and non A-phases by A-phase detector. Sec-ond, these data are classified three types of CAP phase as A-phase, B-phase, and NCAP after context decision. The accuracy of the first result is 80.4% to 81.5% and 80.98% in average and the correctness of the proposed automated CAP detection algorithm is 64.6% to 66.9% and 65.8% in average. The values of Figure 3.7 are used to evaluate accuracy of A-phases classification of two subjects. These values contain that accuracy which means that predicted label is same as ground truth, PPV is defined by the ratio of TP and the sum of TP and FP, NPV is defined by the ratio of TN and the sum of TN and FN, Sensitivity is defined by the ratio of TN and the sum of TN and FP, and specificity is defined by the ratio of TP and the sum of TP and FN. These terms are shown as Table 3.3. The values of Figure 3.8 are used to evaluate correctness of CAP sequence classification of two subjects. The total correct detection C (correctness) is defined by the ratio of all true events detected and the sum of total events.
C = T A + T B + T N
T + T B + F + M + F A + F B + M A + M B (3.1) The CAPS specificity SPC is defined by the ratio of all detected true CAPS period and the
sum of reference CAPS. SPC =
T A + T B + F + M
total NCAP detected.
SEN C =
T N
T N + M A + M B (3.5) These terms are shown as Table 3.4. T, TB and TN mean the correct classification of A-phases, B-phases, and NCAP. F is misclassification of B by A in CAP. M is misclassifi-cation of A by B in CAP. In NCAP, FA is false positives A and FB is false positives B. In CAPS, MA is and false negatives A and MB is false negatives B.
Table 3.3: Relationships among terms. Definitions of True positive (TP), False positive (FP), True negative (TN) and False negative (FN)
Test outcome)
negative positive Condition(ground truth) negative True Negative (TN) False Positive (FP)
positive False Negative (FN) True Positive (TP)
Table 3.4: Relationships among terms. Definitions of TA,TB,TN,F,M,FA,FB,MA,MB
Test outcome) A-phase B-phase NCAP
Condition(ground truth)
A-phase TA M MA
B-phase F TB MB
Figure 3.7: It is used to evaluate accuracy of A-phases classification of two subjects. P means the proposed method result. B means the method proposed by Barcaro et al. in 2004. R means RemLogic system automatic scoring. T means the RPSGT visual scoring. The top figure is Subject1 result and the bottom figure is Subject2 result. Accuracy means that predicted label is same as ground truth, PPV is defined by the ratio of TP and the sum of TP and FP, NPV is defined by the ratio of TN and the sum of TN and FN, Sensitivity is defined by the ratio of TN and the sum of TN and FP, and specificity is defined by the ratio of TP and the sum of TP and FN.
Figure 3.8: It is used to evaluate correctness of CAP sequence classification of two subjects. P means the proposed method result. B means the method proposed by Barcaro et al. in 2004. R means RemLogic system automatic scoring. T means the RPSGT visual scoring. The top figure is Subject1 result and the bottom figure is Subject2 result. The definition of total correct detection C, the CAPS sensitivity SC, the CAPS sensitivity SC, the NCAP sensitivity SNC, and the NCAP sensitivity SNC are mentioned above.
by our system. In Figure 3.10, the first field is Subject1 and the following two fields are Subject2. It shows part of all night sleep. The top row shows automated detection result of A-phase, the fourth row and the fifth row represents the results of manual scoring and RemLogic system automates scoring which we assumed as the ground truth, the third row is the results of implement of previous method proposed by Barcaro et al. in 2004, and the second row is the results of automated scoring by our system. The bottom row shows EEG signal in C3-A2 channel. In Figure 3.10, it is found that the proposed method can detect A-phase in every moment which EEG signal satisfy the conditions, but the automated detection of RemLogic system and the manual scoring by RPSGT may loss some A-phase. On the other hand, there are some A-phases and non A-phases too long to fit the CAP scoring rule which is removed by the proposed method.
Figure 3.11 shows the variable length template method’s advantage of the proposed method, compared to Barcaro method. In Barcaro method, A-phase ends when all band descriptors are smaller than the length threshold. Candidate A-phase means that the average power in one of these bands is larger than background average power in the definition of A-phase. The proposed method can increase template length to cover the following features in a short period time to fit template. In the proposed method, A-phase contains the period in which all band descriptors are smaller than the length threshold but the average power in one of these bands is larger than background average power at some point in this period. The proposed method combines variable length template method and EXIST/LENGTH thresholds method. Compared to the Barcaro method, the proposed method is superior because of its usage of variable length template.
Figure 3.11: Compared to the Barcaro method, the proposed method is superior because of its usage of variable length template. The left column from top to bottom is the proposed method capsnogram, Barcaro method capsnogram, EEG signal of C3-A2 channel, and delta band descriptor. The right column from top to bottom is theta band descriptor, alpha band descriptor, sigma band descriptor, and beta band descriptor.
Reference Subject1 RemLogic Subject1 Registered PSG technologists Subject2 RemLogic Subject2 Registered PSG technologists A1 65.5% 77.9% 73.0% 64.8% A2 16.7% 41.5% 17.0% 22.6% A3 75.0% 68.3% 63.9% 54.3%
Show the accuracy of the proposed subtypes classified method which use RemLogic system scoring and RPSGT manual scoring as reference.
3.2
A-phase subtypes classification analysis
3.2.1
Materials
The experimental data were acquired from the sleep center of Tzu-Chi Hospital in Taichung, Taiwan. There are 2 records from 1 male and 1 female. The ground truth ta-ble is shown in Tata-ble 3.5.
3.2.2
Experimental results
In the classification of phases subtypes, Figure 3.12 shows the distribution of A-phase subtypes of RemLogic system scoring result. The following Table 3.6 presents the accuracy of the proposed subtypes classified method which uses RemLogic system scoring and RPSGT manual scoring as reference. The classified accuracy of subtypes is 65.5% to 77.9% in subtypes A1, 16.7% to 41.5% in subtypes A2, and 54.3% to 75% in subtypes A3.
Figure 3.12: The row dimension means times of all night and the column dimension means fractal dimension value. The blue line is fractal dimension by Higuchi’s method and the subtypes of A1, A2, and A3 are presented by red, green, and black point.
The variable length template is a flexible method to adaptive range of time. In Fig-ure 4.1, we plan to investigate the influence of A-phase detection with the variable length template or not. The experimental result without using template method is more similar with ground truth than use that. And in the Figure 4.4 and 4.5, the accuracy of A-phase detection and CAP sequence detection without template is higher than using template. But the results demonstrate that may not adjustment A-phase length if we do not use template. The A-phase length range is 2 second 6 second too short to correspond the previous results with 2 second 60 second.
Figure 4.2 and Figure 4.3 shows the distribution of average descriptor of A-phase and non A-phase. They are the proposed method without using template and the proposed method. The row shows the time dimension and the column shows descriptor mean value in each phase. Compare with the proposed method without using template and the proposed method, the distribution of A-phase and non A-phase of the proposed method converges to a constant respectively.
4.1.2
Threshold adjustment
In the previous methods, the exist threshold (equal to 1) and the length threshold (equal to 0) are used to distinguish A-phase from background signal. But it is different for each subject’s physiological state. In our experiment, we set exist threshold to 0.8 and length threshold to 0.3 to compare with previous studies set. This result of accuracy of A-phase detection and CAP detection is shown in Figure 4.4 and Figure 4.5.
Figure 4.1: The five rows are sleep stage, EEG signal, CAP detection result without tem-plate, RPSGT result, and RemLogic system result. The third row shows that the duration of A-phase is reduced to 2 second - 6 second.
4.1.3
Forward function
The forward function is a strategy to overcome that the template method only extends the length to the right. This function is turned on to extend the template to the left for 2 s. We also compare the accuracy for CAP detection in Figure 4.4 and Figure 4.5. The orig-inal method detects CAP without using the forward function. Compare with the accuracy with forward function, turning off this function is better. So this function may bring more unnecessary influence than benefit.
4.1.4
Band selection
In the previous studies, the delta band was the most frequency band used in CAP detec-tion. Some studies dropped sigma band for simplicity, due to the secondary or negligible role of this rhythm for CAP detection in normal subjects. In our experiment, we test dif-ferent band set in exist threshold and length threshold for CAP detection. Figure 4.4 and Figure 4.5 show the result of the accuracy for CAP detection.
Figure 4.2: The distribution of average descriptor of CAP phases on Subject1. The figure on the top is the proposed method and the figure at the bottom is the proposed method without using template
Figure 4.3: The distribution of average descriptor of CAP phases on Subject2. The figure on the top is the proposed method and the figure at the bottom is the proposed method without using template.
Figure 4.4: Show the Subject1 result which use the proposed result as test and the registered PSG technologists manual scoring as reference. The top figure is A-phase detection result and the bottom figure is CAP sequence detection result. These eight lines from top to down are the proposed method without template, exist threshold set to 1 and length threshold set to 0, the proposed method with forward function, the length band without using delta band, the exist band using delta and theta band, the exist band using delta, higher delta and, lower delta band, the exist band using delta, higher delta, lower delta, and theta band, and the proposed method.
Figure 4.5: Show the Subject2 result which use the proposed result as test and the registered PSG technologists manual scoring as reference. The top figure is A-phase detection result and the bottom figure is CAP sequence detection result. These eight lines from top to down are the proposed method without template, exist threshold set to 1 and length threshold set to 0, the proposed method with forward function, the length band without using delta band, the exist band using delta and theta band, the exist band using delta, higher delta, and lower delta band, the exist band using delta, higher delta, lower delta, and theta band, and the proposed method.
RemLogic A 653 921
4.1.5
Vertex sharp wave
We had developed a vertex sharp wave detection method to improve CAP detection. But it performed negative influence in the A-phase detection. In Table 4.1 and Table 4.2, the confusion matrix of A-phase detection result shows that the true positive in non A-phase is decreasing.
4.2
Hjorth parameter
While we used Hjorth parameter activity as feature rather than band power to perform CAP classification. Figure 4.7 shows the CAP rate of this result on the right column and the proposed method in the left column. Figure 4.8 shows accuracy, sensitivity, PPV, and NPV of CAP A-phase classification results. In the CAP rate, the results of Barcaro method are too high to fit u-shape. In the Figure 4.8, the accuracy of the method with Hjorth parameter activity as feature is lower than the accuracy of the proposed method, that is to say, the using power spectrum as feature is better than using Hjorth parameter activity.
Figure 4.6: The four rows top to down are C3-A2, A-phase detection result with vertex sharp wave, A-phase detection result without vertex sharp wave, and RemLogic system result. This figure shows that the vertex sharp wave detection method may cause some negative influencewith non A-phase true positive value.
Figure 4.7: Show the CAP rate of two subjects of the proposed method and the method with hjorth parameter activitiy as feature.
Figure 4.8: Show accuracy, sensitivity, PPV, and NPV of CAP A-phase classification results of two subjects of the proposed method and the method with hjorth parameter activitiy as feature. P means the proposed method result. R means RemLogic system automatic scoring. T means the registered PSG technologists manual scoring.
F Dl(t) = 1 61 X t=−30 g F Di(t) (4.2)
If the time point is A-phase and the difference between short average and long average is small enough, then it is A-phase. Others are non A-phases. Figure 4.9 shows the CAP rate of the proposed method with fractal dimension as constrain Figure 4.10 shows accuracy, sensitivity, PPV, and NPV of CAP A-phase classification results.
Figure 4.9: Show the CAP rate of the proposed method and he proposed method with fractal dimension as constrain.
Figure 4.10: Show accuracy, sensitivity, PPV, and NPV of CAP A-phase classification results of two subjects with the proposed method and the proposed method with fractal dimension as constrain. Pr means the proposed method result. R means RemLogic system automatic scoring. T means the registered PSG technologists manual scoring.
4.4
Subtypes
A-phase has three subtypes : A1, A2, and A3. We compare different classifiers ef-ficiency in CAP A-phase subtypes classifications. These classifiers contain LDA, k-NN, Navona method, and the proposed method. The results of the proposed method are more stable than others.
4.5
Problems of automated CAP detection
4.5.1
Reasons for bad classification
From the results of our experiment, the accuracy of CAP detection and subtypes clas-sification achieve 81% and 61% in average with 2 insomnia subjects. Our ground truth is scoring manually by RPSGT and RemLogic system. RPSGT scores visually based on EEG signal and sleep stages. RemLogic system scores automatically with the same data. Since we use only single EEG channel for scoring, the quality of the EEG signal is very
sub1 RPSGT
Figure 4.11: Shows the CAP subtypes classification results of Subject1 of two kinds of ground truth in four classify methods which are the proposed method, LDA classifier kNN classifier, and the Navona method.
sub2 RPSGT
Figure 4.12: Shows the CAP subtypes classification results of Subject2 of two kinds of ground truth in four classify methods which are the proposed method, LDA classifier kNN classifier, and the Navona method.
may affect scoring result. But it is hard to detect in a suitable way to reject them. Subjects recording
CAP analysis is a time-consuming effort of the visually scoring process. In Taiwan, there are few CAP professionals. It is a hard process to obtain a lot of CAP scoring results. Although RemLogic system is an automatic CAP detection system, it still has low accuracy problem. Our experimental analysis with 2 subjects is not enough to do statistic process and the 2 subjects are insomnia patients who may appear special situation to impact the accuracy of classification.
Limited information from Inter- scorer reliability
In the literature, inter-scorer agreement is another problem. The CAP detection result agreement between scorers is less than sixty percentages. The special wave detection in CAP such as K-complex is also less than sixty percentages. The low inter-scorer reliability may cause unstable CAP detection results in our study.