Research Article
The Combinational Polymorphisms of
ORAI1 Gene Are Associated with Preventive Models of
Breast Cancer in the Taiwanese
Fu Ou-Yang,
1,2,3,4Yu-Da Lin,
5Li-Yeh Chuang,
6Hsueh-Wei Chang,
2,7,8,9Cheng-Hong Yang,
5and Ming-Feng Hou
2,3,4,10,111Graduate Institute of Medicine, College of Medicine, Kaohsiung Medical University, Kaohsiung 80708, Taiwan
2Cancer Center, Kaohsiung Medical University Hospital, Kaohsiung Medical University, Kaohsiung 80708, Taiwan
3Institute of Clinical Medicine, Kaohsiung Medical University, Kaohsiung 80708, Taiwan
4Department of Surgery, Kaohsiung Municipal Ta-Tung Hospital, Kaohsiung, Taiwan
5Department of Electronic Engineering, National Kaohsiung University of Applied Sciences, Kaohsiung 80778, Taiwan
6Department of Chemical Engineering & Institute of Biotechnology and Chemical Engineering, I-Shou University,
Kaohsiung 84001, Taiwan
7Institute of Medical Science and Technology, National Sun Yat-sen University, Kaohsiung 80424, Taiwan
8Research Center of Environmental Medicine, Kaohsiung Medical University, Kaohsiung 80708, Taiwan
9Department of Biomedical Science and Environmental Biology, Kaohsiung Medical University, Kaohsiung 80708, Taiwan
10National Sun Yat-Sen University-Kaohsiung Medical University Joint Research Center, Kaohsiung 80424, Taiwan
11Department of Biological Science and Technology, National Chiao Tung University, Hsinchu 30010, Taiwan
Correspondence should be addressed to Hsueh-Wei Chang; [email protected], Cheng-Hong Yang; [email protected] and Ming-Feng Hou; [email protected]
Received 4 December 2014; Accepted 21 January 2015 Academic Editor: An Liu
Copyright © 2015 Fu Ou-Yang et al. This is an open access article distributed under the Creative Commons Attribution License, which permits unrestricted use, distribution, and reproduction in any medium, provided the original work is properly cited. The ORAI calcium release-activated calcium modulator 1 (ORAI1) has been proven to be an important gene for breast cancer progression and metastasis. However, the protective association model between the single nucleotide polymorphisms (SNPs) of
ORAI1 gene was not investigated. Based on a published data set of 345 female breast cancer patients and 290 female controls,
we used a particle swarm optimization (PSO) algorithm to identify the possible protective models of breast cancer association in terms of the SNPs of ORAI1 gene. Results showed that the PSO-generated models of 2-SNP (rs12320939-TT/rs12313273-CC), 3-SNP (rs12320939-TT/rs12313273-CC/rs712853-(TT/TC)), 4-SNP (rs12320939-TT/rs12313273-CC/rs7135617-(GG/GT)/rs712853-(TT/TC)), and 5-SNP (rs12320939-TT/rs12313273-CC/rs7135617-(GG/GT)/rs6486795-CC/rs712853-(TT/TC)) displayed low values of odds ratios (0.409–0.425) for breast cancer association. Taken together, these results suggested that our proposed PSO strategy is powerful to identify the combinational SNPs of rs12320939, rs12313273, rs7135617, rs6486795, and rs712853 of ORAI1 gene with a strongly protective association in breast cancer.
1. Introduction
Single nucleotide polymorphisms (SNPs) are the most com-mon variants of human genome [1]. Genome-wide asso-ciation studies (GWAS) have widely been used to detect the association models to diseases in terms of multiple SNPs
[2–7]. The SNP interaction was gradually identified in a lot of GWAS [8–10] and non-GWAS [11,12] literature.
The ORAI calcium release-activated calcium modula-tor 1 (ORAI1) [13] was reported to be involved in cancer progression and metastasis of several types of cancers [14–
17]. The cell- and animal-based studies found that inhibition
Volume 2015, Article ID 281263, 7 pages http://dx.doi.org/10.1155/2015/281263
of ORAI1 gene impeded the migration of breast cancer cells [18]. Several association studies of the SNPs of ORAI1 gene were also investigated in predicting the predisposition of diseases and cancers [19–22]. However, the SNP-SNP interaction-based association model between SNPs of ORAI1 gene and the protective association in breast cancer was less addressed.
For computational biologic challenge, the significant and potential association models are usually hidden in the large number of possible combinations between several genotypes of SNPs. Many methods had been developed to analyze the potential association models to GWAS using the traditional statistics, data mining, and machine learning techniques [23–
30]. Among them, the particle swarm optimization (PSO) method was used to explore the association models for several diseases and cancers [28]. The advantages of PSO are easy and rapid to apply the statistics analysis to identify the potential association models.
The objective of this study aims to use the PSO to investigate whether combinational SNPs of ORAI1 gene in data set [22] are protectively associated with breast cancer in the Taiwanese population.
2. Methods
2.1. Problem Description. The set 𝑋𝑖 = {𝑥𝑖1, 𝑥𝑖2, . . . , 𝑥𝑖𝐷/2,
𝑥𝑖𝐷/2+1, . . . , 𝑥𝑖𝐷}, including SNP combinations {𝑥𝑖1, 𝑥𝑖2, . . . , 𝑥𝑖𝐷/2} with their corresponding genotypes {𝑥𝑖𝐷/2+1, . . . , 𝑥𝑖𝐷}, is defined as possible solution in the detection of protective association model problem, and the set is named SNP bar-code in this study. The objective function (fitness function) 𝑓(𝑋𝑖) is defined as the difference between case group and control group. The objective of detecting the protective association model is a search for maximal SNP barcode𝑋∗ via the evaluation of objective function𝑓(𝑋) (𝑓 : 𝛿 ⊆ R𝐷 → R); that is, 𝑓(𝑋∗) > 𝑓(𝑋) for all 𝑋 ∈ 𝛿, where 𝛿 is a
nonempty large finite set serving as the search space, and 𝛿 = R𝐷.
2.2. PSO. In PSO, particle is regarded as a solution of any
problem [31]. The two experiences, (1) the particle’s own experience (pbest) and(2) the global knowledge (gbest), are the two important objectives for leading the particle moves toward better search region of the problem space. An optimal result can be searched by gbest when the PSO produce is repeated in much generation.
Algorithm 1 illustrates the PSO produce which has the
four operations, including particle initializations, particle evaluations, pbest and gbest updates, and particle position update. The first step initializes the particles reasonable val-ues. The second step computes the fitness values of particles. The third step updates the pbest of particle if the fitness value is better than the pbest. The fourth step updates the
gbest if a fitness value of particle is better than the gbest.
The fifth step updates the particle’s velocity and position. The steps 2 to 5 are repeated until the maximum generation is achieved. Next, these four operations are introduced in detail as follows.
01: begin
02: Particle initializations
03: for g = 1 to the number of generations 04: Particle evaluations using fitness function
05: pbest update
06: gbest update
07: Particle position update 08: next𝑔
09: end
Algorithm 1: Particle swarm optimization pseudocode.
2.3. Particle Initializations. A particle is defined as the SNP
barcode; that is,𝑋𝑖 = {𝑥𝑖1, 𝑥𝑖2, . . . , 𝑥𝑖𝐷/2, 𝑥𝑖𝐷/2+1, . . . , 𝑥𝑖𝐷}. The initial population (i.e., generation is 0) should cover this range as much as possible by randomizing individuals within the problem space constrained by the prescribed minimum and maximum bounds:𝑋𝑖,min= {𝑥𝑖,1,min, 𝑥𝑖,2,min, . . . , 𝑥𝑖,𝐷,min} and𝑋𝑖,max = {𝑥𝑖,1,max, 𝑥𝑖,2,max, . . . , 𝑥𝑖,𝐷,max}. The 𝑗th element of the𝑖th particle can initialize as
𝑥𝑖,𝑗,0 = 𝑥𝑖,𝑗,min+ rand𝑖,𝑗[0, 1] ⋅ (𝑥𝑖,𝑗,max− 𝑥𝑖,𝑗,min) ,
𝑥𝑗,max= { { { { { { { SNPmax, 𝑗 ≤ 𝐷 2 Genotypemax, 𝑗 > 𝐷 2, 𝑥𝑗,min= { { { { { { { SNPmin, 𝑗 ≤ 𝐷 2 Genotypemin, 𝑗 > 𝐷 2, Genotype= {1, recessive genotype
2, dominant/heterozygous genotype, (1)
where SNPmax and SNPmin are the maximum number of SNPs and the minimum number of SNPs, respectively. Genotypemin is set to 1 (i.e., the minor allele is regarded as the recessive genotype) and Genotypemaxis set to 2 (i.e., the major allele is regarded as the dominant genotype with the homologous major genotype or heterozygous genotype).
2.4. Particle Evaluations. The fitness function is defined by
the frequency difference value between breast cancer patients and controls, and the relevant equation can be written as
𝑓 (𝑋𝑖) = (𝑋𝑖controls∩ control)−(𝑋𝑖∩ breast patients)patients . (2)
The𝑋𝑖represents the𝑖th particle. The 𝑋𝑖∩ control is defined as the total number of intersections between the𝑖th particle and control group. The controls are defined as the total number of control group. The𝑋𝑖∩ breast patients is defined as the total number of intersections between the𝑖th particle and breast patient group. The patients are defined as the total number of breast patient group.
Table 1: Estimated risk of each individual SNP on the occurrence of breast cancer.
SNPs Genotype Breast cancer patients (%)
∗1 Controls (%)∗1 OR (95% CI)∗2 (𝑛 = 345) (𝑛 = 290) rs12320939 (1) TT 67 71 0.74 (0.51–1.09) (2) GG/GT 278 219 1 rs12313273 (1) CC 20 29 0.55 (0.31–1.00) (2) TT/TC 325 261 1 rs7135617 (1) TT 55 51 0.89 (0.59–1.35) (2) GG/GT 290 239 1 rs6486795 (1) CC 35 43 0.65 (0.40–1.04) (2) TT/TC 310 247 1 rs712853 (1) CC 33 28 0.99 (0.58–1.68) (2) TT/TC 312 262 1
∗1The genotype information of case and control was derived from our previous work [32] and it was reachable at
http://bioinfo.kmu.edu.tw/BRCA-ORAI1-5SNPs.xlsx.
∗2The genotype frequencies on the occurrence of breast cancer are not significant (𝑃 > 0.05).
OR = odds ratio.
2.5. pbest and gbest Updates. The pbest can record the particle
experience, and gbest can record the common experience of particles. For pbest update, if the current fitness value of particle is better than pbest, then both the position and fitness values of pbest are replaced by the current position and fitness values of this particle. For gbest update, if the fitness value of
pbest is better than that of gbest, then both the position and
fitness values of gbest are replaced by the current position and fitness values of pbest.
2.6. Particle Position Update. The particle position is updated
by the three different vectors, including the inertia weight 𝑤, pbest, and gbest. Equation(3)is the𝑤 updating function, and this function can iteratively reduce the value of𝑤 from 𝑤maxto𝑤min[33]. Equation(4)is used to update the particle velocity. Equation(5)is used to adjust the particle position. Consider
𝑤LDW = (𝑤max− 𝑤min) ×IterationIterationmax− Iteration𝑖 max + 𝑤min, (3) Vnew 𝑖𝑑 = 𝑤LDW× V old 𝑖𝑑 + 𝑐 × 𝑟1× (𝑝𝑏𝑒𝑠 𝑡𝑖𝑑− 𝑥old𝑖𝑑) + 𝑐 × 𝑟2× (𝑔𝑏𝑒𝑠 𝑡𝑑− 𝑥old𝑖𝑑) , (4) 𝑥new 𝑖𝑑 = 𝑥old𝑖𝑑 + Vnew𝑖𝑑 , (5)
where𝑤maxis maximum value of inertia weight𝑤 and 𝑤min is minimum value of inertia weight 𝑤. Iterationmax is the maximum generation. The𝑟1and𝑟2are the random functions within the range[0, 1]. The acceleration constants 𝑐1and𝑐2 are used to control the particle search direction (pbest or
gbest). VelocitiesVnew𝑖𝑑 andVold𝑖𝑑 are the new and old velocities, respectively. The𝑥old𝑖𝑑 and𝑥new𝑖𝑑 are the current and updated particle positions, respectively.
2.7. Parameter Settings. In this study, the PSO parameters
are chosen under the optimal setting [34]. For example,
the population size is 50, the maximum generation is 100, the 𝑤maxof the inertia weight𝑤 is 0.9, the 𝑤minis 0.4 [33],𝑉max is set to(𝑋max− 𝑋min), and 𝑉min is set to−(𝑋max − 𝑋min). Learning factors𝑐1and𝑐2are both set to 2 [35].
2.8. Data Set Collection. In this study, we selected the five ORAI1 related SNPs from the HapMap Han Chinese database,
including rs12320939, rs12313273, rs7135617, rs6486795, and rs712853, and the breast cancer data set with patients (𝑛 = 345) and controls (𝑛 = 290) were obtained from our previous study [22].
2.9. Statistical Analysis. The odds ratio (OR), 95% confidence
interval (CI), and𝑃 value were used to evaluate the detected association models. A𝑃 value < 0.05 indicates the occurrence of the association models significantly differing between the breast cancer patients and controls. The SPSS version 19.0 (SPSS Inc., Chicago, IL) was used to compute all statistical analysis.
3. Results
3.1. Evaluation of the Breast Cancer Risk of Individual SNP.
Table 1showed the breast cancer risks of five individual SNPs
in ORAI1 gene. Among them, we identified six genotypes of SNPs with the protective association against breast can-cer, including rs12320939-TT, rs12313273-CC, rs7135617-TT, rs6486795-CC, and rs712853-CC. However, the frequency differences of these genotypes for each individual SNP were nonsignificant between the breast cancer patients and con-trols.
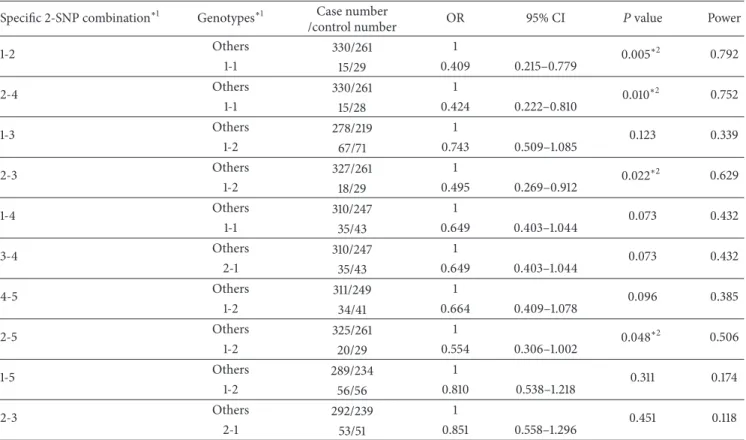
3.2. The Association Models of 2-SNP Combinations with Maximum Differences between Cases and Controls. Table 2
showed the top ten association models of 2-SNP com-binations from five SNPs listed in Table 1. Four associa-tion models showed significant difference between paired specific combination and others (𝑃 < 0.05), including SNPs
Table 2: The top ten best protective association models of 2-SNP combinations. Specific 2-SNP combination∗1 Genotypes∗1 Case number
/control number OR 95% CI 𝑃 value Power
1-2 Others 330/261 1 0.005∗2 0.792 1-1 15/29 0.409 0.215–0.779 2-4 Others 330/261 1 0.010∗2 0.752 1-1 15/28 0.424 0.222–0.810 1-3 Others 278/219 1 0.123 0.339 1-2 67/71 0.743 0.509–1.085 2-3 Others 327/261 1 0.022∗2 0.629 1-2 18/29 0.495 0.269–0.912 1-4 Others 310/247 1 0.073 0.432 1-1 35/43 0.649 0.403–1.044 3-4 Others 310/247 1 0.073 0.432 2-1 35/43 0.649 0.403–1.044 4-5 Others 311/249 1 0.096 0.385 1-2 34/41 0.664 0.409–1.078 2-5 Others 325/261 1 0.048∗2 0.506 1-2 20/29 0.554 0.306–1.002 1-5 Others 289/234 1 0.311 0.174 1-2 56/56 0.810 0.538–1.218 2-3 Others 292/239 1 0.451 0.118 2-1 53/51 0.851 0.558–1.296
∗1The information of the SNP and genotypes is provided inTable 1. ∗2The models have significance on the occurrence of breast cancer (𝑃 < 0.05).
OR = odds ratio.
Table 3: Estimated joint effects on models of 2- to 5-SNP combinations associated with breast cancer. Combined SNP number (specific SNP combination)∗1 SNP genotypes Case number
/control number OR 95% CI 𝑃 value Power
2-SNP Others 330/261 1 0.005∗2 0.792 (1-2) 1-1 15/29 0.409 0.215–0.779 3-SNP Others 330/261 1 0.005∗2 0.792 (1-2-5) 1-1-2 15/29 0.409 0.215–0.779 4-SNP Others 330/261 1 0.005∗2 0.792 (1-2-3-5) 1-1-2-2 15/29 0.409 0.215–0.779 5-SNP Others 330/262 1 0.008∗2 0.750 (1-2-3-4-5) 1-1-2-1-2 15/28 0.425 0.223–0.813
∗1The information of the SNP and genotypes is provided inTable 1. ∗2The models have significance on the occurrence of breast cancer (P< 0.05).
OR = odds ratio.
(1-2)-genotypes (1-1), SNPs (2-4)-genotypes (1-1), SNPs (3)-genotypes (1-2), and SNPs (5)-(3)-genotypes (1-2). In these 2-SNP association models, the 2-SNPs (1-2)-genotypes (1-1), that is, [rs12320939-TT]-[rs12313273-CC], had the maximum fre-quency difference (5.65%) between the breast cancer patients and controls and displayed the smallest OR value (<1) with a protective effect against breast cancer. Similarly, the SNPs (1-2)-genotypes (1-1) displayed the highest power value between these models of 2-SNP combinations.
3.3. The Association Models of 3- to 5-SNP Combinations with Maximum Differences between Cases and Controls. Using
similar computation like in Table 2, Table 3 showed the best association models of 3- to 5-SNP combinations with maximum difference between the breast cancer patients and controls. We found that three SNPs rs12320939, rs12313273, and rs712853 were strongly associated with protective effect against breast cancer when their genotypes were TT, CC, and TT/TC, respectively (OR = 0.409, 95% CI = 0.215–0.779,
𝑃 = 0.005). The 4-SNP combinations showed that rs7135617 was included to generate the protective association with breast cancer. The OR,𝑃 value, and power were the same for 3-, 4-, and 5-SNP combination models. For 5-SNP model, SNPs (1, 2, 3, 4, 5) showed a similar protective effect against breast cancer when their genotypes are TT, CC, GG/GT, CC, and TT/TC, respectively (OR = 0.425, 95% CI = 0.223–0.813, 𝑃 = 0.008).
4. Discussion
SNP interaction analyses can improve the performance of association studies in disease predisposition [26,36–41]. In this study, we investigated the protective factors for genetic variants of complex traits in breast cancer. We hypoth-esized that five important SNPs within the ORAI1 gene may reduce the genetic susceptibility to breast cancer. In the current study, a robust PSO algorithm combined with the statistical analysis was used to detect the relationship between protective association of breast cancer and ORAI1 SNPs. As expected, our proposed PSO algorithm has a good performance to identify the protective effects of ORAI1 SNPs against breast cancer in this study.
The statistical analyses were reported to have the difficulty to identify the complex multifactor association [42]. Accord-ingly, several studies proposed comprehensive approaches to identify the association model with disease related factors [27,
30,43,44]; these approaches have adequate power to explore the potential association models. The SNP combination generated by PSO can detect the association relationship in terms of selecting several important genotypes of SNPs. This algorithm can help us to understand the genetic basis of the complex diseases/traits.
Our previous studies had shown that ORAI1 is an asso-ciated gene to breast cancer with the nodal involvement, progesterone receptor status, and estrogen receptor status studies [22]. In our previous work [32], the specific combi-national SNPs of ORAI1 gene were reported to be associated with breast cancer risk. However, the protective association of breast cancer in terms of combinational SNPs of ORAI1 gene was not investigated in SNP-SNP interaction manner. In the current study, we found a strong protective association between specific combinational SNPs of ORAI1 gene in relation to breast cancer susceptibility.
We detected the possible 2-factor association models in terms of specific SNP combination. PSO analysis selected two SNPs (rs12320939 and rs12313273) in ORAI1 genes as the best protective association model against breast cancer when the genotypes of rs12320939 and rs12313273 are TT and CC, respectively. This model can not specify whether the model was a synergistic relationship or not, but it suggested that the combination of factors (rs12320939 with genotype TT and rs12313273 with genotype CC) had very low risk for breast cancer susceptibility.
Haplotype is defined by a group of heritable SNPs of linked genes on the same chromosome. Haplotype analysis can provide the performance between cases and controls for patterns of SNP combination involving all SNPs, for example, 5 SNPs in the case of the current study. However,
the SNP-SNP interactions for different SNPs involved are not considered in traditional haplotype analysis. In contrast, our proposed PSO-based SNP-SNP interaction was not limited to SNPs of the same chromosome although it is in the current study. Moreover, our proposal algorithm can identify the best SNP model with the maximum difference between cases and controls for different numbers of SNPs, for example, from 2 to 5 SNPs. Recently, haplotype analysis was also reported to combine with PSO [45,46]. Therefore, the computation of traditional haplotype analysis may be improved with the help of PSO.
5. Conclusions
We used the PSO strategy to detect the protective association models between five combinational SNPs of ORAI1 gene in the breast cancer. Among them, the two SNPs (rs12320939 and rs12313273) were found to be most essential components to protectively associate in breast cancer when their geno-types are TT and CC, respectively. PSO identified SNP model may enhance the detection of genetic variants to disease or cancer susceptibility. Therefore, our findings provided the important information regarding combinational patterns of SNPs located in the relevant genes.
Conflict of Interests
The authors declare that there is no conflict of interests regarding the publication of this paper.
Acknowledgments
This study was partly supported by the Ministry of Science and Technology (MOST 2320-B-037-008, MOST 103-2221-E-151-029-MY3, and MOST 102-2221-E-151-024-MY3), the Kaohsiung Medical University “Aim for the Top Univer-sities Grant, Grant no. KMUTP103A33,” the National Sun Yat-sen University-KMU Joint Research Project (no. NSYSU-KMU 104-p036), and the Health and Welfare Surcharge of Tobacco Products, the Ministry of Health and Welfare, Taiwan (MOHW104-TDU-B-212-124-003).
References
[1] L.-Y. Chuang, C.-H. Yang, K.-H. Tsui et al., “Restriction enzyme mining for SNPs in genomes,” Anticancer Research, vol. 28, no. 4A, pp. 2001–2007, 2008.
[2] J. Li, K. Humphreys, H. Darabi et al., “A genome-wide associ-ation scan on estrogen receptor-negative breast cancer,” Breast
Cancer Research, vol. 12, no. 6, article R93, 2010.
[3] P. Kraft and C. A. Haiman, “GWAS identifies a common breast cancer risk allele among BRCA1 carriers,” Nature Genetics, vol. 42, no. 10, pp. 819–820, 2010.
[4] G. Thomas, K. B. Jacobs, P. Kraft et al., “A multistage genome-wide association study in breast cancer identifies two new risk alleles at 1p11.2 and 14q24.1 (RAD51L1),” Nature Genetics, vol. 41, no. 5, pp. 579–584, 2009.
[5] A. Meindl, “Identification of novel susceptibility genes for breast cancer—genome-wide association studies or evaluation of candidate genes?” Breast Care, vol. 4, no. 2, pp. 93–99, 2009. [6] D. Fanale, V. Amodeo, L. R. Corsini, S. Rizzo, V. Bazan, and A.
Russo, “Breast cancer genome-wide association studies: there is strength in numbers,” Oncogene, vol. 31, no. 17, pp. 2121–2128, 2012.
[7] J.-C. Yu, C.-N. Hsiung, H.-M. Hsu et al., “Genetic variation in the genome-wide predicted estrogen response element-related sequences is associated with breast cancer development,” Breast
Cancer Research, vol. 13, no. 1, article R13, 2011.
[8] W.-H. Su, Y. Y. Shugart, K.-P. Chang, N.-M. Tsang, K.-P. Tse, and Y.-S. Chang, “How genome-wide SNP-SNP interactions relate to nasopharyngeal carcinoma susceptibility,” PLoS ONE, vol. 8, no. 12, Article ID e83034, 2013.
[9] N. Greliche, M. Germain, J.-C. Lambert et al., “A genome-wide search for common SNP x SNP interactions on the risk of venous thrombosis,” BMC Medical Genetics, vol. 14, no. 1, article 36, 2013.
[10] P. Li, M. Guo, C. Wang, X. Liu, and Q. Zou, “An overview of SNP interactions in genome-wide association studies,” Briefings
in Functional Genomics, 2014.
[11] L.-Y. Chuang, H.-W. Chang, M.-C. Lin, and C.-H. Yang, “Improved branch and bound algorithm for detecting SNP-SNP interactions in breast cancer,” Journal of Clinical Bioinformatics, vol. 3, no. 1, article 4, 2013.
[12] J.-B. Chen, L.-Y. Chuang, Y.-D. Lin et al., “Preventive SNP-SNP interactions in the mitochondrial displacement loop (D-loop) from chronic dialysis patients,” Mitochondrion, vol. 13, no. 6, pp. 698–704, 2013.
[13] M. Prakriya, S. Feske, Y. Gwack, S. Srikanth, A. Rao, and P. G. Hogan, “Orai1 is an essential pore subunit of the CRAC channel,” Nature, vol. 443, no. 7108, pp. 230–233, 2006. [14] F. M. Davis, A. A. Peters, D. M. Grice et al., “Non-stimulated,
agonist-stimulated and store-operated Ca2+ influx in MDA-MB-468 breast cancer cells and the effect of EGF-induced EMT on calcium entry,” PLoS ONE, vol. 7, no. 5, Article ID e36923, 2012.
[15] R. K. Motiani, M. C. Hyzinski-Garc´ıa, X. Zhang et al., “STIM1 and Orai1 mediate CRAC channel activity and are essential for human glioblastoma invasion,” Pflugers Archiv European
Journal of Physiology, vol. 465, no. 9, pp. 1249–1260, 2013.
[16] A. Chantˆome, M. Potier-Cartereau, L. Clarysse et al., “Pivotal role of the lipid raft SK3-orai1 complex in human cancer cell migration and bone metastases,” Cancer Research, vol. 73, no. 15, pp. 4852–4861, 2013.
[17] G. R. Monteith, “Prostate cancer cells alter the nature of their calcium influx to promote growth and acquire apoptotic resistance,” Cancer Cell, vol. 26, no. 1, pp. 1–2, 2014.
[18] S. Yang, J. J. Zhang, and X.-Y. Huang, “Orai1 and STIM1 are critical for breast tumor cell migration and metastasis,” Cancer
Cell, vol. 15, no. 2, pp. 124–134, 2009.
[19] J. C.-C. Wei, J.-H. Yen, S.-H. H. Juo et al., “Association of ORAI1 haplotypes with the risk of HLA-B27 positive ankylosing spondylitis,” PLoS ONE, vol. 6, no. 6, Article ID e20426, 2011. [20] Y.-H. Chou, S.-H. H. Juo, Y.-C. Chiu et al., “A polymorphism
of the ORAI1 gene is associated with the risk and recurrence of calcium nephrolithiasis,” Journal of Urology, vol. 185, no. 5, pp. 1742–1746, 2011.
[21] W.-C. Chang, C.-H. Lee, T. Hirota et al., “ORAI1 genetic polymorphisms associated with the susceptibility of atopic
dermatitis in Japanese and Taiwanese populations,” PLoS ONE, vol. 7, no. 1, Article ID e29387, 2012.
[22] W.-C. Chang, P. Y. Woon, Y.-W. Hsu, S. Yang, Y.-C. Chiu, and M. F. Hou, “The association between single-nucleotide polymorphisms of ORAI1 gene and breast cancer in a Taiwanese population,” The Scientific World Journal, vol. 2012, Article ID 916587, 6 pages, 2012.
[23] J. H. Moore, F. W. Asselbergs, and S. M. Williams, “Bioin-formatics challenges for genome-wide association studies,”
Bioinformatics, vol. 26, no. 4, pp. 445–455, 2010.
[24] P. Yang, J. W. K. Ho, Y. H. Yang, and B. B. Zhou, “Gene-gene interaction filtering with ensemble of filters,” BMC
Bioinformat-ics, vol. 12, no. 1, article S10, 2011.
[25] L.-Y. Chuang, Y.-D. Lin, H.-W. Chang, and C.-H. Yang, “An improved PSO algorithm for generating protective SNP bar-codes in breast cancer,” PLoS ONE, vol. 7, no. 5, Article ID e37018, 2012.
[26] C.-H. Yang, L.-Y. Chuang, Y.-H. Cheng et al., “Single nucleotide polymorphism barcoding to evaluate oral cancer risk using odds ratio-based genetic algorithms,” Kaohsiung Journal of
Medical Sciences, vol. 28, no. 7, pp. 362–368, 2012.
[27] J.-Y. Tang, L.-Y. Chuang, E. Hsi, Y.-D. Lin, C.-H. Yang, and H.-W. Chang, “Identifying the association rules between clinicopathologic factors and higher survival performance in operation-centric oral cancer patients using the apriori algo-rithm,” BioMed Research International, vol. 2013, Article ID 359634, 7 pages, 2013.
[28] S.-J. Wu, L.-Y. Chuang, Y.-D. Lin et al., “Particle swarm optimization algorithm for analyzing SNP-SNP interaction of renin-angiotensin system genes against hypertension,”
Molecu-lar Biology Reports, vol. 40, no. 7, pp. 4227–4233, 2013.
[29] C.-H. Yang, Y.-D. Lin, L.-Y. Chuang, and H.-W. Chang, “Eval-uation of breast cancer susceptibility using improved genetic algorithms to generate genotype SNP barcodes,” IEEE/ACM
Transactions on Computational Biology and Bioinformatics, vol.
10, no. 2, pp. 361–371, 2013.
[30] C.-H. Yang, Y.-D. Lin, L.-Y. Chuang, J.-B. Chen, and H.-W. Chang, “MDR-ER: balancing functions for adjusting the ratio in risk classes and classification errors for imbalanced cases and controls using multifactor-dimensionality reduction,” PLoS
ONE, vol. 8, no. 11, Article ID e79387, 2013.
[31] J. Kennedy, “Particle swarm optimization,” in Encyclopedia of
Machine Learning, pp. 760–766, Springer, Berlin, Germany,
2010.
[32] W.-C. Chang, Y.-Y. Fang, H.-W. Chang et al., “Identifying asso-ciation model for single-nucleotide polymorphisms of ORAI1 gene for breast cancer,” Cancer Cell International, vol. 14, no. 1, article 29, 2014.
[33] Y. Shi and R. C. Eberhart, “Empirical study of particle swarm optimization,” in Proceedings of the Congress on Evolutionary
Computation (CEC ’99), pp. 1945–1950, IEEE Press, Piscataway,
NJ, USA, July 1999.
[34] J. Kennedy and R. Eberhart, “Particle swarm optimization,” in Proceedings of the IEEE International Conference on Neural
Networks, pp. 1942–1948, Perth, Australia, December 1995.
[35] A. Ratnaweera, S. K. Halgamuge, and H. C. Watson, “Self-organizing hierarchical particle swarm optimizer with time-varying acceleration coefficients,” IEEE Transactions on
Evolu-tionary Computation, vol. 8, no. 3, pp. 240–255, 2004.
[36] J. H. Moore, “The ubiquitous nature of epistasis in determining susceptibility to common human diseases,” Human Heredity, vol. 56, no. 1–3, pp. 73–82, 2003.
[37] C.-Y. Yen, S.-Y. Liu, C.-H. Chen et al., “Combinational poly-morphisms of four DNA repair genes XRCC1, XRCC2, XRCC3, and XRCC4 and their association with oral cancer in Taiwan,”
Journal of Oral Pathology and Medicine, vol. 37, no. 5, pp. 271–
277, 2008.
[38] C.-H. Yang, Y.-D. Lin, L.-Y. Chuang, and H.-W. Chang, “Double-bottom chaotic map particle swarm optimization based on chi-square test to determine gene-gene interactions,”
BioMed Research International, vol. 2014, Article ID 172049, 10
pages, 2014.
[39] C.-H. Yang, L.-Y. Chuang, Y.-J. Chen, H.-F. Tseng, and H.-W. Chang, “Computational analysis of simulated SNP interactions between 26 growth factor-related genes in a breast cancer association study,” OMICS: A Journal of Integrative Biology, vol. 15, no. 6, pp. 399–407, 2011.
[40] C.-H. Yang, H.-W. Chang, Y.-H. Cheng, and L.-Y. Chuang, “Novel generating protective single nucleotide polymorphism barcode for breast cancer using particle swarm optimization,”
Cancer Epidemiology, vol. 33, no. 2, pp. 147–154, 2009.
[41] G.-T. Lin, H.-F. Tseng, C.-H. Yang et al., “Combinational polymorphisms of seven CXCL12-related genes are protective against breast cancer in Taiwan,” OMICS: A Journal of
Integra-tive Biology, vol. 13, no. 2, pp. 165–172, 2009.
[42] J. H. Moore and S. M. Williams, “New strategies for identifying gene-gene interactions in hypertension,” Annals of Medicine, vol. 34, no. 2, pp. 88–95, 2002.
[43] R. L. Collins, T. Hu, C. Wejse, G. Sirugo, S. M. Williams, and J. H. Moore, “Multifactor dimensionality reduction reveals a three-locus epistatic interaction associated with susceptibility to pulmonary tuberculosis,” BioData Mining, vol. 6, no. 1, article 4, 2013.
[44] D.-Y. Oh, M.-H. Jin, Y.-S. Lee et al., “Identification of stearoyl-CoA desaturase (SCD) gene interactions in korean native cattle based on the multifactor-dimensionality reduction method,”
Asian-Australasian Journal of Animal Sciences, vol. 26, no. 9, pp.
1218–1228, 2013.
[45] B. Wei, Q. Peng, X. Chen, and J. Zhao, “Haplotype inference using a novel binary particle swarm optimization algorithm,”
Applied Soft Computing Journal, vol. 21, pp. 415–422, 2014.
[46] J. Wu, J. Wang, and J. Chen, “A practical algorithm based on particle swarm optimization for haplotype reconstruction,”
Applied Mathematics and Computation, vol. 208, no. 2, pp. 363–
Submit your manuscripts at
http://www.hindawi.com
Hindawi Publishing Corporation
http://www.hindawi.com Volume 2014
Anatomy
Research International
Peptides
Hindawi Publishing Corporation
http://www.hindawi.com Volume 2014
Hindawi Publishing Corporation http://www.hindawi.com
International Journal of
Volume 2014
Zoology
Hindawi Publishing Corporation
http://www.hindawi.com Volume 2014 Molecular Biology International
Genomics
International Journal of Hindawi Publishing Corporation
http://www.hindawi.com Volume 2014
The Scientific
World Journal
Hindawi Publishing Corporationhttp://www.hindawi.com Volume 2014
Hindawi Publishing Corporation
http://www.hindawi.com Volume 2014
Bioinformatics
Advances inMarine Biology
Journal ofHindawi Publishing Corporation
http://www.hindawi.com Volume 2014
Hindawi Publishing Corporation
http://www.hindawi.com Volume 2014
Signal Transduction
Journal ofHindawi Publishing Corporation
http://www.hindawi.com Volume 2014
BioMed
Research International
Evolutionary Biology International Journal of
Hindawi Publishing Corporation
http://www.hindawi.com Volume 2014
Hindawi Publishing Corporation
http://www.hindawi.com Volume 2014 Biochemistry Research International
Archaea
Hindawi Publishing Corporation
http://www.hindawi.com Volume 2014
Hindawi Publishing Corporation
http://www.hindawi.com Volume 2014 Genetics
Research International
Hindawi Publishing Corporation
http://www.hindawi.com Volume 2014
Advances in
Virology
Hindawi Publishing Corporation http://www.hindawi.com
Nucleic Acids
Journal ofVolume 2014
Stem Cells
International
Hindawi Publishing Corporation
http://www.hindawi.com Volume 2014
Hindawi Publishing Corporation
http://www.hindawi.com Volume 2014
Enzyme
Research
Hindawi Publishing Corporation
http://www.hindawi.com Volume 2014
International Journal of