國立交通大學
科技管理研究所
博
士
論
文
都會區寬頻通訊網路技術與趨勢之評估
Characterization of Emerging Technologies in Metropolitan
Access Networks and Local Loops
博 士 生:鄭炤仁
都會區寬頻通訊網路技術與趨勢之評估
Characterization of Emerging Technologies in Metropolitan Access
Networks and Local Loops
博 士 生:鄭炤仁 Student:Joe Zen Cheng
指導教授:虞孝成教授 Advisor:Dr. Hsiao-Cheng Yu
國 立 交 通 大 學
科技管理研究所
博士 論 文
A Dissertation Submitted to Institute of Management of Technology
College of Management National Chiao Tung University In Partial Fulfillment of the Requirements
For the Degree of Doctor of Philosophy
In
Management of Technology October, 2004
Hsinchu, Taiwan, Republic of China
都會區寬頻通訊網路技術與趨勢之評估
博士生:鄭炤仁
指導教授:虞孝成教授
國立交通大學科技管理研究所
摘要
電信自由化、網際網路
IP 應用的成長,以及無線行動通訊的普及,使
電信產業在過去幾年中產生大幅成長。電信製造業者由於網路建設的需求
不斷地增加,其營運收入也跟著呈現出大幅成長。由電信業營運商及製造
商在
2000 年底前的股票市值,可以明顯的看出電信產業的繁榮景象。然
而,在
2000 年底電信產業突然不景氣,使資本支出明顯的減少,促使電
信產業的產業結構產生劇烈的改變與重組。本研究分析影響電信產業商業
活動之助力與阻力,並探討電信及網際網路
dot-com 產業泡沫化過程的教
訓,進一步討論未來電信產業存在的主要商機。
在電信產業不景氣的時期,全球網際網路的數據使用量仍然持續的成
長,尤其是大量企業用戶開始使用乙太網路 (100M/s、1/10 Gb/s),使企業
內部的數據話務量極速的成長。不僅如此,中小企業及一般住戶使用
ADSL 及銅纜數據機的普及率不斷提高,更是促進數據業務成長的主要動
力。
目前都會區網路主要是使用
SONET/SDH 的設備來「集中」傳送數據
資料。但是由於
SONET/SDH 在傳輸數據時,會限制頻寬及使用的彈性,
因此限制了都會網路的發展,所以需要尋找新的都會區網路接續解決方案
來滿足目前的需求。由於乙太網路的技術簡單、成本低、容易聯通網路、
容易處理
IP 數據、與服務提供快速的優點,再加上新發展的乙太網路
Gigabit 介面可以擴增至大區域(WAN)的通訊功能,因此使得 Gigabit 乙太
網路成為滿足都會區寬頻需求最可能的解決方案。
本研究探討
Gigabit 乙太網路的進展、分析 Gigabit 乙太網路使用於都
會網路的優缺點,並探討技術演進對電信業者的影響。本研究使用模糊多
評準決策(Fuzzy MCDM)方法來評估何種解決方案最合適於都會區寬頻通
訊的需求。研究結果顯示
SONET/SDH 其多目標之效用值較 Gigabit 乙太
網路為高。
電信自由化使電信產業在長途、國際及行動通信業務上產生越來越多
的競爭,但是在區域迴路(Local Loop)的部分卻一直缺乏競爭,這種不健全
的產業競爭現象,促使各國在制訂電信法規時,著重於研究如何鼓勵區域
迴路的競爭,本研究分析不同的新接續技術及政府政策。研究分析結果發
現,光纖能提供足夠的頻寬、使用
WLAN 及 WiMAX 可以滿足移動寬
頻;而政策法規的規範上則傾向於建議無法與現有的電信商競爭的新電信
業者可以進行整合,與現有的區域迴路業者進行合理的競爭。
關鍵字:電信、自由化、網際網路、乙太網路、光纖、都會區網路、區
域迴路、模糊多評準決策
Characterization
of Emerging Technologies in
Metropolitan Access Networks and Local Loops
Ph. D. Student: Joe Zen Cheng
Advisor: Dr. Hsiao-cheng Yu
Institute of Management of Technology
College of Management
National Chiao Tung University
Abstract
Telecommunications deregulation, the exponential increase in Internet IP applications, and the popularity of mobile services have created tremendous growth in the telecommunications service industry in the past few years. With unprecedented demands on network infrastructure, telecommunications equipment manufacturers also enjoyed sales and revenue growth until the economic downturn toward the end of the year 2000. The prosperity of telecommunications service providers and equipment manufacturers were reflected notably on their respective stock performances. However, the abrupt slowdown, particularly in capital spending on networking equipment, has resulted in mass corporate restructuring and workforce realignment in the telecommunications industry. In this study, we have analyzed the “business drivers and draggers” that caused the telecommunications boom and downturn. In this context, we review lessons learned from the dot-com implosion and the downturn in the global telecommunications industry. We also discuss the telecom industry’s latest developments in preparation for the next wave of business opportunities.
Despite the telecom industry downturn, global Internet traffic growth continues to create bandwidth demand in the telecommunications network. As 100 Mb/s Ethernet and 1/10 Gigabit Ethernet LANs are widely installed in enterprises, Intranet bandwidth has grown quickly. With active adoption of ADSL and cable modems, broadband accesses in the SOHO
and residential markets, more data traffic is generated in these markets as well. Presently, most telecom carriers use SONET/SDH equipment to “aggregate” data traffic in the MAN network (Metropolitan Area Network) before accessing the Internet backbone network. Because of the intrinsic limitations of SONET/SDH equipment in transporting data traffic, especially in terms of bandwidth scalability and provisioning efficiency, there is a need to find a broadband access solution that can overcome the drawbacks of SONET/SDH. Because the inherent simplicity of the technology, Ethernet offers cost-effectiveness, ease of networking, a packet-based IP friendly protocol, and rapid provisioning advantages while competing with other networking technologies. These advantages, coupled with the newly developed Gigabit WAN capability have positioned Gigabit Ethernet as a compelling technology to break the bandwidth bottleneck in the MAN environment. We review the enhancement of Gigabit Ethernet technology and discuss the pros and cons of using Gigabit Ethernet technology in the MAN network. We also address the implications of this technology evolution on telecom carriers. Fuzzy Multi-Criteria Decision Making methodology was used to evaluate Gigabit Ethernet and SONET/SDH MAN access strategies. The survey results show that the SONET/SDH MAN access strategy received a higher utility score in satisfying the multi-objectives than the Gigabit Ethernet access strategy.
Finally, although global telecom deregulation has sparked competition for long distance, international, and cellular service, there remains a lack of competition in the local loop environment. This may be of particular concern in the Internet broadband service era due to the potential aggregation of service providers. In order to foster local loop competition, special government policy attention and regulation is required. We analyzed various emerging access technologies and policy approaches. Based on the analysis, fiber offers the best bandwidth capacity while WLAN and WiMAX provide good mobile broadband access capability for end users. From a policy perspective, if a majority of the CLECs (Competitive
Local Exchange Carriers) are unable to effectively compete with incumbent carriers, then a CLEC consolidation - leading to a well-controlled monopoly - could be a solid option for future local loop networks.
Keywords: Telecommunications, Deregulation, Internet, Ethernet, SONET/SDH, LAN, MAN, local loop, Fuzzy MCDM (Multi-Criteria Decision Making)
誌謝
首先感謝虞孝成教授對本人在博士班求學間的悉心指導。 其次感謝所上曾國雄 教授、徐作聖教授、洪志洋教授、袁建中教授、劉尚志教授在課業上的指導,以及博 士論文口試委員徐作聖教授、洪志洋教授、唐震寰教授、朱詣旨教授、林博文教授、 及鄭興教授的指導。 同時也謝謝學弟妹們在論文編輯上的支持與協助。 鄭炤仁 謹職 民國九十三年十月 于國立交通大學科技管理研究所Contents
摘要...i Abstract ...iii 誌謝...vi Contents...vii List of Tables...x 1. Introduction ...11.1 Background and Motivation ...2
1.2 Purposes of Research...3
1.3 Literature Discussion...4
1.4 Approaches and Methodology...6
1.4.1 Literature Review ... 6
1.4.2 Scenario Analysis ... 6
1.4.3 Fuzzy Multi-Criteria Decision Making (MCDM)... 7
1.5 Scope and Limitation...8
1.6 Research Procedure and Flowchart ...8
1.7 Dissertation Organization...9
1.8 Glossary...9
1.8.1 Acronyms ... 9
1.8.2 Terms ... 11
2. Telecom Industry Review and Analysis...14
2.1 Growth in The Telecommunications Industry...14
2.1.1 Driver: the global telecommunications deregulation... 14
2.1.2. Driver: E-commerce ... 15
2.1.3 Driver : high-speed Internet access... 17
2.1.4 Driver : IP packet technology ... 18
2.1.5 Driver : mobile communications services ... 19
2.1.6 Driver: promise of new digital economy ... 19
2.1.7 Driver: acquisition strategies... 20
2.1.8 Driver: telecom equipment vendor financing... 21
2.2 Gloom in The Telecommunications Industry...22
2.2.1 Dragger: 3G license auction ... 23
2.2.2 Dragger: uncertainty about 3G rollout and profitability... 25
2.2.3 Dragger: network overbuild and brutal price competition ... 26
2.2.4 Dragger: heavy debt among telecom startups and dot.coms ... 26
2.2.5 Dragger: bad loans by telecom vendors... 27
2.2.6 Dragger: second-hand equipment ... 27
2.2.7 Dragger: B2C and B2B investment cuts ... 28
2.2.8 Dragger: write-offs of acquisitions ... 28
2.3 Telecommunications Industry’s Latest Developments and Possible Next Steps...29
2.3.1 Adopting supply chain management... 30
2.3.2 Generating new revenue with SMS and MMS ... 30
2.3.3 Emerging wireless-LAN technology ... 31
2.3.4 3G Business models for wireless services ... 32
2.4 Summary...33
3. MAN Access Network ...35
3.3.1 Simplified network architecture ... 42
3.3.2 Eliminate protocol conversion ... 42
3.3.3 Asynchronous network vs. Synchronous network... 43
3.3.4 Ethernet equipment cost advantage... 43
3.3.5 Global end-to-end LAN connection... 44
3.3.6 High speed ASP and SSP access ... 45
3.4 Ethernet Challenges in Network Operations and Management...45
3.4.1 Can Gigabit Ethernet provide the equivalent QoS (quality of service) that is currently provided by SONET/SDH and ATM? ... 46
3.4.2 Can Gigabit Ethernet provide the network performance monitoring capability that is currently provided by SONET/SDH and ATM? ... 46
3.4.3 Can Gigabit Ethernet provide network protection switching and fault isolation capabilities that are currently provided by SONET/SDH and ATM? ... 47
3.4.4 How can Gigabit Ethernet scale up in large carrier network?... 48
3.5 Summary...48
4. Using a Fuzzy Multi-Criteria Decision Making Approach To Evaluate MAN Access Technologies...50
4.1 Ethernet Technology: from LAN to MAN and WAN...52
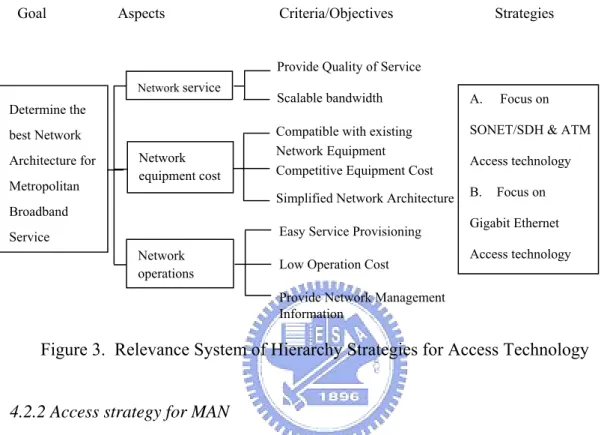
4.2 Building a Hierarchy Model for Evaluating Different MAN Access Strategies...53
4.2.1 Building a hierarchy strategy model ... 53
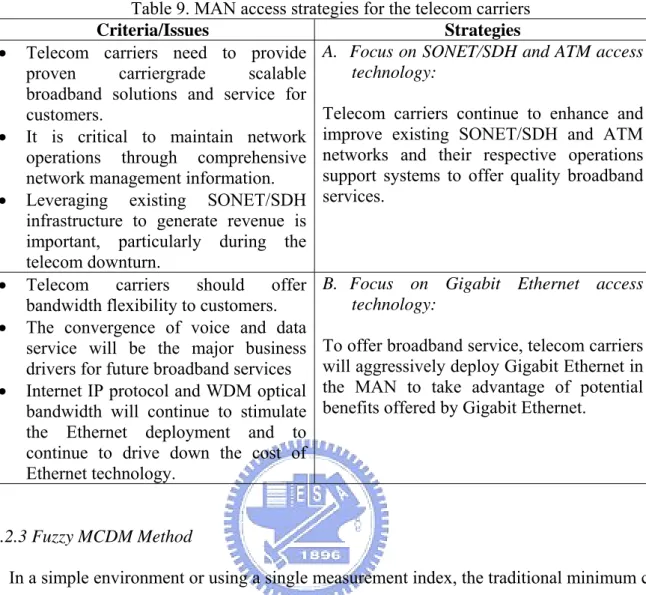
4.2.2 Access strategy for MAN ... 54
4.2.3 Fuzzy MCDM Method ... 55
4.2.4 The process of evaluating the hierarchy strategies ... 56
4.3 Empirical Study and Discussions ...58
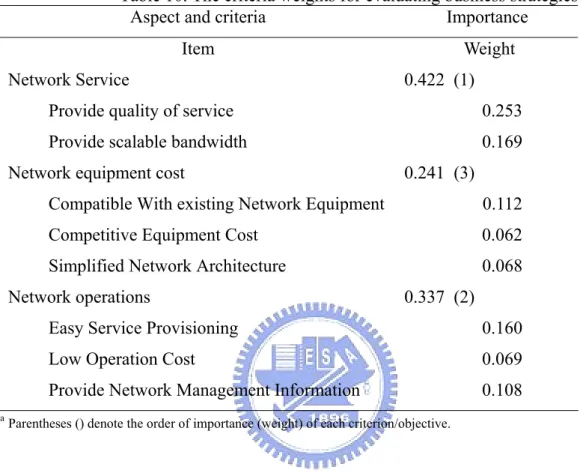
4.3.1 Evaluating the criteria/objectives weights ... 58
4.3.2 Estimating the performance matrix ... 59
4.3.3 Ranking the business strategies... 60
4.3.4 Discussions ... 61
4.4 Summary...63
5. Local Loop Access and Technologies ...65
5.1 Local Loop Access: Technology Perspectives ...66
5.1.1 Wireline local loop ... 67
5.1.2 Wireless local loop ... 71
5.1.3 Fixed wireless broadband ... 71
5.1.4 WLAN ... 72
5.1.5 WiMAX ... 73
5.2 Local Loop Competition: Business Perspectives ...76
5.3 An Infrastructure-Based Competition Model ...76
5.4 Service-Based Competition Model...78
5.5 Mix of Infrastructure and Service-Based Competition Model ...81
Advantages ...82
5.6 Review of Local Loop Competition Status ...82
5.6.1 Review of overall European Union (EU) status ... 83
5.6.2 Review of UK status... 83
5.6.3 Review of US status ... 84
5.6.4 Review of Asian countries status ... 84
5.7 Potential Approaches to Promote Local Loop Competition...85
5.7.1 Present mode of competition: role of regulator ... 85
5.7.2 Organization divestiture: a monopolized local loop network ... 88
5.8 Summary...90
6. Conclusions and Suggestions ...92
6.1 Conclusions ...92
6.2 Suggestions...95
References ...97
List of Tables
Table 1. Equipment Needed by Telecom carriers ...15
Table 2. Equipment Needed by E-commerce Companies...17
Table 3. Equipment Needed for High Speed Internet Access ...18
Table 4. Equipment Needed by Mobile Service Operators and Subscribers...19
Table 5. Summary of Business Drivers for Telecom Boom...22
Table 6. 3G License Costs...24
Table 7. Summary of Business Draggers Undermining the Telecom Boom ...29
Table 9. MAN access strategies for the telecom carriers ...55
Table 10. The criteria weights for evaluating business strategies ...59
Table 11. The subjective cognition results of evaluators towards the five levels of linguistic variables...60
Table 12. The evaluation results of MAN access strategies...60
Table 13. Asia incumbent IDD carriers and local market share...66
Table 14. 802.11 and 802.16 Technical Comparison...74
Table 15 Summary of the Emerging Local Loop Technologies ...75
Table 16. Asia Local Loop Unbundling Status ...81
Table 17. Advantages and disadvantages/issues for different local loop competition models 82 Table 18. Global Local Loop Competition Status...85
Table 19. Local Loop Unbundling Pricing Methodologies...87
List of Figures
Figure 1. Research Procedure and Flowchart...9 Figure 2. Dollar Per Gigabit of Bandwidth in 2004, by Dell’Oro Group ...45 Figure 3. Relevance System of Hierarchy Strategies for Access Technology ...54 Figure 4. The membership function of the five levels of linguistic variables (hypothetical example) ...57
1. Introduction
Global telecom deregulation broke up telecom monopolies, and new players emerged in the marketplace. Ever-advancing technological innovations in computing and telecommunications have made Internet and WWW (World Wide Web) services available worldwide. Consequently, demand for telecom infrastructure equipment skyrocketed, and the telecommunications and IT (Information Industry) industries have grown remarkably in the past few years. The performance of major stock markets reflected this growth. In March 2000, the Nasdaq Index reached an all time high of 5048 compared to 2000 five years earlier. Most telecom companies’ market capitalization reached an all time high at the same time. Through mergers and acquisitions, major telecom equipment suppliers such as Cisco, Lucent and Nortel, expanded their product portfolios in global markets. The Telecom Industry was perceived as the engine that would carry the global digital economy (Cheng et al., 2003).
With such a rosy outlook, the abrupt economic slowdown toward the end of 2000 caught everyone off guard. The telecom industry, once seen as unstoppable, suffered severe sales and revenue downturns. Many telecom giants, such as Lucent and Nortel, underwent numerous corporate restructurings and layoffs. By mid-2002, major carriers such as Qwest, Global Crossing, and WorldCom disclosed disastrous losses and eventually filed for bankruptcy. This shattered telecom manufacturers’ hope of recovery in the near future. Wishing to understand the forces at work in this phenomenon, we gathered information reported in the business and management community and interviewed experts in the telecommunications industry. We have summarized factors that greatly contributed to the boom and gloom of the telecom industry, and offered the findings as lessons for other industries. Furthermore, we discuss the current developing telecommunications trends and issues that could greatly impact the future telecommunication industry.
Among these telecommunications issues, we identified the LAN (local Area Network) and SONET/SDH (Synchronous Optical Network/Synchronous Digital Hierarchy) technologies and telecommunications network local loop for further study because of the disruptive nature of LAN technologies in the MAN (Metropolitan Access Network) environment (Cheng, et al., 2003), and the critical nature of the local loop network in the telecommunications competition. Evolution of LAN technology and comparison between the Gigabit Ethernet and SONET/SDH technologies were analyzed. Finally, we also analyze emerging access technologies and potential alternatives to resolve the local loop network bottleneck issue in order to promote the local loop competition.
1.1 Background and Motivation
Global Internet traffic growth continues to create bandwidth demand in the telecommunications network. As 100 Mb/s Ethernet and Gigabit Ethernet LANs are widely installed in enterprises, the Intranet bandwidth grows quickly. With active adoption of ADSL and cable modem broadband accesses in the SOHO and residential markets, more data traffic is generated in these markets as well. Presently, most telecom carriers use SONET/SDH equipment to “aggregate” data traffic in the MAN network before accessing the Internet backbone network. Because of the intrinsic limitations of SONET/SDH equipment in transporting data traffic, especially in terms of bandwidth scalability and provisioning efficiency, there is a need to find a broadband access solution that can overcome the drawbacks of SONET/SDH. Because the inherent simplicity of the technology, Ethernet offers cost-effectiveness, ease of networking, packet-based IP friendly protocol, and rapid provisioning advantages while competing with other networking technologies. These advantages, coupled with the newly developed Gigabit WAN capability have positioned Gigabit Ethernet as a compelling technology to break the bandwidth bottleneck in the MAN environment. We review the evolution of Gigabit Ethernet technology and discuss the pros
and cons of using Gigabit Ethernet technology in the MAN network. We also address the implications of this technology evolution on telecom carriers (Cheng, et al. 2003).
Very little literature currently exists about the models/methodologies that can be used to select the appropriate technology in the telecom carrier environment. Only expert opinions and technology assessments are available. This study is therefore motivated to demonstrate the effectiveness of using a Fuzzy-MCDM to evaluate technology selection mechanisms.
Furthermore, global telecom deregulation has sparked innovation while revolutionizing the telecom industry. Although competition for long distance, international, and cellular service is fierce, there remains a lack of competition in the local loop environment. This may be of particular concern in the Internet broadband service era due to the potential aggregation of service providers. In order to foster local loop competition, special government policy attention and regulation is required. Therefore, this study is motivated to study the policy impact on the local loop competition. The pros and cons of different policy approaches are discussed. In particular, how will the wireless LAN technology be utilized in the local loop competition is also discussed.
1.2 Purposes of Research
Telecommunications deregulation, the exponential increase in Internet IP applications, and the popularity of mobile services have created tremendous growth in the telecommunications service industry in the past few years. With unprecedented demands on network infrastructure, telecommunications equipment manufacturers have also enjoyed sales and revenue growth until the economic downturn toward the end of the year 2000. The prosperity of telecommunications service providers and equipment manufacturers reflected notably on their respective stock performance. However, the recent abrupt slowdown, particularly in capital spending on networking equipment, has resulted in mass corporate restructuring and workforce realignment in the telecommunications industry (Cheng et al.,
2003). In light of changes in the telecommunications industry landscape, it is important to understand the drivers that caused the telecommunications boom and downturn. In addition, we need to study emerging technologies for broadband services and to analyze the current telecommunications bottleneck issue in order to adequately manage the future telecommunications industry trend and technologies. Based on the above description, we, therefore identify four main purposes in this research:
1. First, this research examines the “business drivers and draggers” that have caused the telecommunications boom and downturn. In addition, we review lessons learned from the popping of the Internet bubble, and the downturn in the global telecommunications industry.
2. Second, this research analyzes LAN technology evolution and its potential in the MAN environment. A comparison of Gigabit Ethernet and existing SONET/SDH technology from the carrier’s perspective is conducted to understand its application in the MAN environment.
3. Third, this research employs a Fuzzy-MCDM to demonstrate the effectiveness of the method in selecting technology alternatives in telecom carrier networks.
4. Four, this research analyzes the local loop bottleneck competition issue, particularly from the policy’s perspective. We present several alternatives that could stimulate the competition in the local loop network. We also analyze the management issues of emerging access technologies. In particular, the impact of wireless LAN technology in the local loop competition is also discussed.
1.3 Literature Discussion
Understanding the boom and downturn of the telecommunications industry should include considerations from technical, government regulations, services and business perspectives. Technical considerations include the evolution of Internet IP and wireless technologies.
Government regulations considerations include telecommunications deregulation and spectrum licensing. Service considerations include broadband multimedia and Internet services. Business considerations include business models, mergers and acquisitions and vendor financing issues. Elstrom (2001) identified factors that caused the meltdown of the telecommunications industry. From a historical perspective, Arthur (2002) discussed whether the information revolution is terminated or not, and offered insights on prominent future telecommunications trend.
Clavenna, Jander and Reardon (2001) discussed the pros and cons of the deploying Gigabit Ethernet technology in the MAN network. Seifert discussed the evolution of LAN technology. The proliferation of LAN technology in the SOHO and enterprise environment, together with the standardization of Gigabit Ethernet interfaces stimulates new WAN applications for Ethernet technology. From a technical perspective, Gigabit Ethernet has offered several distinctive advantages against the existing SONET/SDH technology. However, from the carrier’s perspective, there are other qualitative parameters (such as, operations efficiency) that need to be considered while selecting the best transport technology for the MAN network.
Finally, although telecom deregulation has fostered competition in the interoffice core network, there remains a lack of competition in the local loop (so called the last mile) between incumbent carriers and CLECs. Michalis (2001) discussed the evolution of local access competition and the role of regulation in the EU (European Union) local loop competition. Gabelmann (2001) conducted research on loop unbundling issues in the European telecommunications market. Christodoulou and Vlahos (2001) published their research results on introducing “sunset clauses” in a “mix” of infrastructure and service competition models to promote local loop competition. Economides (1998) analyzed the US Telecommunications
Act of 1996 and its impact. These papers highlight the critical nature of policy and regulations in the local loop competition.
1.4 Approaches and Methodology
1.4.1 Literature Review
In order to capture the key issues of this study, we went through related literature to understand how scholars dealt with similar studies and projects. We learned from their valuable experience and useful results to avoid pitfalls that may have been made in the past. The processes of literature review are as follows: generalize a conclusion from a collection of literatures, abstract from the conclusion, and criticize and modify the conclusion. The types of literature are as follows: primary literature, secondary literature, and bibliographic instruments. From the literature review, we identified the drivers and draggers for the telecom industry boom and doom.
1.4.2 Scenario Analysis
In this paper, we analyzed the pros and cons in deploying Gigabit Ethernet technology in the MAN network. In addition, we analyzed two MAN network technology deployment scenarios, namely SONET/SDH and Gigabit Ethernet technologies. Several criteria were selected to address the qualitative issues in selecting the MAN network technology. Based on the scenario discussions, we summarized the issues and concerns in the carrier network.
For local loop competition, several scenarios were analyzed on how to promote and stimulate competition in the last mile. Under various assumptions, technology feasibility, policy setting, and cross-industry competition scenarios were discussed in detail. The summary of the scenario analysis serves as a good reference for a government agency in setting future local loop competition policy. Masini and Vasquez (2000) classified the scenario analysis into four types: (1) extrapolative and normative scenarios; (2) probable and desirable scenarios; (3) first- and second-generation scenarios; (4) trend, optimistic,
pessimistic, and contrasting scenarios. In this paper, trend, pessimistic and middle ground local loop competition trends are taken as the basis of this study.
1.4.3 Fuzzy Multi-Criteria Decision Making (MCDM)
Analytic Hierarchy Process (AHP), developed more than 20 years ago while Dr. Thomas Saaty was a professor at the Wharton School of Business, continues to be the most highly regarded and widely used decision-making theory (Satty 1977, 1980). AHP has been widely applied to deal with resource distribution and proposal selection (Satty, 1980). When adopting AHP methods in carrying out research analysis, many different aspects must be taken into consideration. There are numerous evaluation indexes; moreover, their structures are hierarchical (Kerzner, 1989). Many scholars and experts have adopted the AHP method to deal with evaluation problems of relative importance (weighting) (Satty, 1980; Zahedi, 1986). The AHP method also helps in describing how much effect the high-level factors of the hierarchy have on lower-level factors in order to provide a more complete depiction of the structural and functional aspects of the whole system. As compared with a direct evaluation of the whole system, AHP provided more advantages. It is more effective, stable, and yields more flexibility (Perez, 1995). Local scholars such as Hwang, Hsin-ginn, and Chang, Jen-hsiung (2001) used the AHP method to set the weight of relative importance in performance evaluation. Wang, Nai-Hung (2000) also used the AHP method to analyze public preference of hospital types in his research where he conferred the selection factors of the general public. Wang, Mei-Hsiang and Hsu, His-Nan (2000) used the AHP method to conduct an integral analysis of a complex evaluation standard in the hope of assisting the managerial base in strategic decision making.
Many scholars use the AHP method to deal with strategy selection problems. A fuzzy notion was introduced into the AHP method (Bellman, et al., 1970; Buckley, 1985). Instead of asking the survey respondents to select a specific utility score, this notion allows a range of
utility scores; this was used to study the marketing strategies of the information service industry (Tang, et al., 1999). Therefore, we use the Fuzzy AHP method to select multi-criteria MAN technologies.
1.5 Scope and Limitation
The scope of this research has the following limitations:
• In the telecom industry boom and gloom analysis, no analysis model was established to systematically identify the business drivers and draggers for the telecom industry. The divers and draggers were identified primarily based on journal review and expert in-depth interview.
• In the MAN network, although there are many competing technologies, we focused only on the comparison and trade-off between Ethernet technology and SONET/SDH.
• In the Fuzzy MCDM analysis, 12 of the 14 surveys were filled out by Chunghwa Telecom researchers and managers. CCL telecom development manager filled out the other two surveys. Therefore, the result of the Fuzzy MCDM analysis primarily reflected the incumbent carrier position and concerns. For new telecom carriers, using the same survey could result in different analysis outcomes as described in section 4.3.4.
• In the local loop network, we conducted only qualitative trade-off analysis among various access technologies.
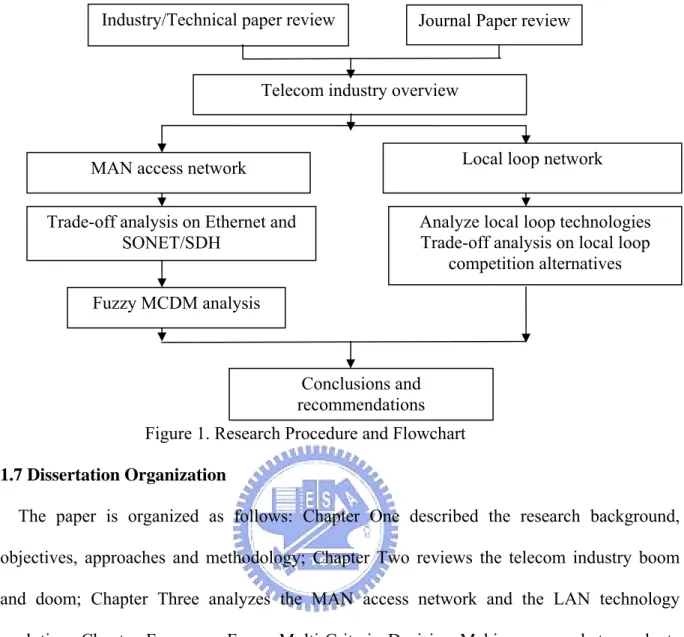
Figure 1. Research Procedure and Flowchart
1.7 Dissertation Organization
The paper is organized as follows: Chapter One described the research background, objectives, approaches and methodology; Chapter Two reviews the telecom industry boom and doom; Chapter Three analyzes the MAN access network and the LAN technology evolution; Chapter Four uses Fuzzy Multi-Criteria Decision Making approach to evaluate alternative MAN access strategies; Chapter Five discusses and analyzes the emerging access technologies and alternatives to stimulate local loop competition, and Chapter Six provides conclusions and suggestions.
1.8 Glossary
1.8.1 Acronyms
AAL 5: ATM Adaptation Layer 5 ADM: Add-Drop Multiplex
ADSL: Asynchronous Digital Subscriber Line xDSL: x Digital Subscriber Line
Industry/Technical paper review Journal Paper review
MAN access network
Trade-off analysis on Ethernet and SONET/SDH
Telecom industry overview
Fuzzy MCDM analysis
Conclusions and recommendations
Local loop network
Analyze local loop technologies Trade-off analysis on local loop
AHP: Analytic Hierarchy Process ASP: Application Service Provider ATM: Asynchronous Transfer Mode ATM VP Ring: ATM Virtual Path Ring ATM PVC: ATM Permanent Virtual Circuit BNP: Best Non-fuzzy Performance
CLEC: Competitive Local Exchange Carrier COA: Center of Area
CSMA/CD: Carrier Sense Multiple Access with Collision Detection DCS: Digital Cross-Connect System
DS (DS0, DS1, DS3): Digital Signal (DS0, DS1, DS3) DWDM: Dense Wavelength Division Multiplexing GR-253: Generic Requirement-253
IEEE: Institute of Electrical and Electronic Engineers IP: Internet Protocol
LAN: Local Area Network
LRAIC: Long-Run Average Incremental Cost MAN: Metropolitan Area Network
MCDM: Multiple Criteria Decision-Making MOM: Mean of Maximal
OSS: Operations Support System
PATTERN: Planning Assistance through Technical Evaluation of Relevance Number PLL: Phase Locked Loop
QoS: Quality of Service
SOHO: Small Office, Home Office
SONET/SDH: Synchronous Optical Network/Synchronous Digital Hierarchy SONET/SDH MSPP: SONET/SDH Multi-Service Provision Platform SONET OC-192: SONET Optical Carrier -192
SSP: Storage Service Provider TDM: Time Division Multiplexing VLAN: Virtual Local Area Network WAN: Wide Area Network
WiMAX: World Interoperability for Microwave Access 1.8.2 Terms
AAL 5:
ATM Adaptation Layer 5 – An ATM protocol layer for transporting different service data units
ADM:
Add-Drop Multiplex – A multiplexer capable of extracting or inserting lower-rate signals from a higher-rate multiplexed signals without the completely demultiplexing the signal. ADSL:
Asynchronous Digital Subscriber Line - Asymmetric Digital Subscriber Line (ADSL), a modem technology, converts existing twisted-pair telephone lines into access paths for multimedia and high-speed data communications.
xDSL:
x Digital Subscriber Line – various DSL technologies (e.g., HSDL, VDSL) ATM:
Asynchronous Transfer Mode – A cell-based, fast-packet technology that provides a protocol for transmitting voice and data over high-speed networks.
ATM VP Ring:
ATM Virtual Path Ring – Using ATM virtual ring architecture to improve the reliability of voice and data communications and the efficiency of bandwidth utilization.
ATM PVC:
ATM Permanent Virtual Circuit – A Permanent Virtual Circuit will establish a fixed path for ATM traffic transmission until the circuit is taken down.
Carrier Sense Multiple Access with Collision Detection – A channel access mechanism wherein devices wishing to transmit first check the channel for a carrier. If no carrier is sensed for some period of time, devices can transmit. If two devices transmit simultaneously, a collision occurs and is detected by all colliding devices, which subsequently delays their retransmissions for some random length of time.
DCS:
Digital Cross-Connect System – A transmission system that provides cross-connect functions for tributaries between input and output signals.
DS (DS0, DS1, DS3):
Digital Signal (DS0, DS1, DS3) – A digital signal hierarchy for different signal transmission speed.
DWDM:
Dense Wavelength Division Multiplexing - An optical technology used to increase bandwidth over existing fiber optic backbones. DWDM works by combining and transmitting multiple signals simultaneously at different wavelengths on the same fiber.
GR-253:
Generic Requirement-253 – A requirement that specifies the SONET requirements. LAN:
Local Area Network - A local area network (LAN) is a group of computers and associated devices that share a common communications line or wireless link and typically share the resources of a single processor or server within a small geographic area (for example, within an office building).
MAN:
Metropolitan Area Network – A data communication network covering the geographic area of a city (generally, larger than a LAN but smaller than a WAN)
OSS:
Operations Support System – Systems that provide operations support for telecom service providers.
PATTERN:
Planning Assistance through Technical Evaluation of Relevance Number PLL:
Phase Locked Loop – A method to extract timing from the incoming signal. RPR:
Resilient Protection Ring – A term that refers to the specific efforts of the IEEE 802.17 working group to generate a resilient packet ring protocol for Wide and Metro Area Networks. SONET/SDH:
Synchronous Optical Network/Synchronous Digital Hierarchy - SONET and SDH are a set of related standards for synchronous data transmission over fiber optic networks. SONET is the
(ANSI). SDH is the international version of the standard published by the International Telecommunications Union (ITU).
SONET OC-192:
SONET Optical Carrier –192 – Defined standard for the SONET optical data rate transmitting at 9.953 Gb/s.
TDM:
Time Division Multiplexing – A form of transmission in which different flows are combined on the basis of time slots.
VLAN:
Virtual Local Area Network - Virtual LANs (VLANs) can be viewed as a group of devices on different physical LAN segments which can communicate with each other as if they were all on the same physical LAN segment
WAN:
Wide Area Network - A wide area network (WAN) is a geographically dispersed telecommunications network. The term distinguishes a broader telecommunication structure from a local area network (LAN).
2. Telecom Industry Review and Analysis
The telecom industry has long been perceived as stable and growing. In the US, Bell Systems has provided consumers with stable POTS (Plain Old Telephone Service) for over a century. Until the emergence of the Internet, voice had been the predominant service. As packet-switched data traffic converged with circuit-switched voice traffic, new network architecture and requirements evolved, and the demand for next generation network infrastructure surged. Additionally, the abundance of capital feeding the vision of 3G multimedia mobile service markets further accelerated the growth of the telecom industry (Cheng, et al., 2003). Through journal review and in-depth expert interviews, major business drivers and draggers were identified for the boom and gloom of the telecom industry. The selection of these drivers and draggers were primarily based on their significant impact on the overall telecom industry market capitalization.
2.1 Growth in The Telecommunications Industry
Major business drivers for this phenomenal growth have included global telecommunications deregulation, e-commerce, high-speed Internet access, IP packet technology, mobile communications services, the new digital economy, acquisition strategy, and vendor equipment financing.
2.1.1 Driver: the global telecommunications deregulation
Telecommunications deregulation has opened up the local, long-distance, international, cable and cellular telephone markets in many countries. The breakup of telecom monopolies has enabled competitive carriers to offer telecom services and has forced incumbent monopolies to upgrade their networks, improving overall telecommunication services. New carriers, such as Qwest Communications and Level 3 Communications of the U.S., deployed optical fiber core networks to offer end-to-end broadband services to US enterprise customers.
continents. Following international standards, new wireless service providers can offer seamless wireless roaming service to mass-market customers. For example, since wireless service was deregulated in Taiwan, six new cellular service providers began competing with incumbent Chunghwa Telecom, the previous Taiwan telecom monopoly. Telecom deregulation permitted cable operators to offer voice service in their cable network which pressured the incumbent telephony operators to upgrade their twisted copper pair network infrastructure to offer xDSL broadband access services. Telecom deregulation has eliminated many telecom business limitations and has created an open competitive environment for telecom equipment vendors and service operators around the world.
Since many new carriers have had to start from scratch, the need for new telecom infrastructure equipment was tremendous, particularly for fiber optic and IP data networking equipment. Additionally, the incumbent operators also generated a huge demand for network upgrades and enhancements. As a result, growth in the telecom equipment market was extraordinary, adding even more fuel to the worldwide economic boom, particularly in the telecom industry. (Table 1). In this driver, government played a pivotal role in generating new telecom business demand.
Table 1. Equipment Needed by Telecom carriers
Carriers Needs
New Telecom Carriers Deploy new telecom infrastructure
Incumbent Carriers
Upgrade and enhance existing network infrastructure in anticipation of a surge in Internet traffic and competition in service quality
2.1.2. Driver: E-commerce
The proliferation of the Internet and the WWW, as well as the development of B2B (Business to Business) and B2C (Business to Consumer) E-commerce has enabled enterprises
and consumers worldwide to conduct business through communication via telecom networks. For example, Amazon.com sells books and other merchandise via the Internet. Dell Computer employs B2C to allow customers to order computers on-line, while it uses the Internet to establish supply chain management systems with its suppliers to minimize inventory and speed up delivery.
In addition, there are e-marketplaces for suppliers and buyers to trade electronically over the network (Business Online 2000). Closely related to B2B and B2C is the ASP (Application Service Provider) model which delivers software application services to users via the network (Business Online, 2000). For example, many small-sized IC design houses are not able to afford expensive IC-design software tools. An ASP model allows IC design houses to use the tool via the network on a monthly subscription fee basis, which can avoid the costly up front capital investment and on-going software maintenance and upgrade expenses.
Lastly, to ensure reliable Internet enabled E-commerce service, IDC (Internet Data Center) and web hosting companies (such as Exodus) specialize in providing around-the-clock backend computer processing and storage services (Business Online, 2000). Some of them have even allied with telecom carriers to secure the necessary bandwidth to minimize transmission delay for their customers.
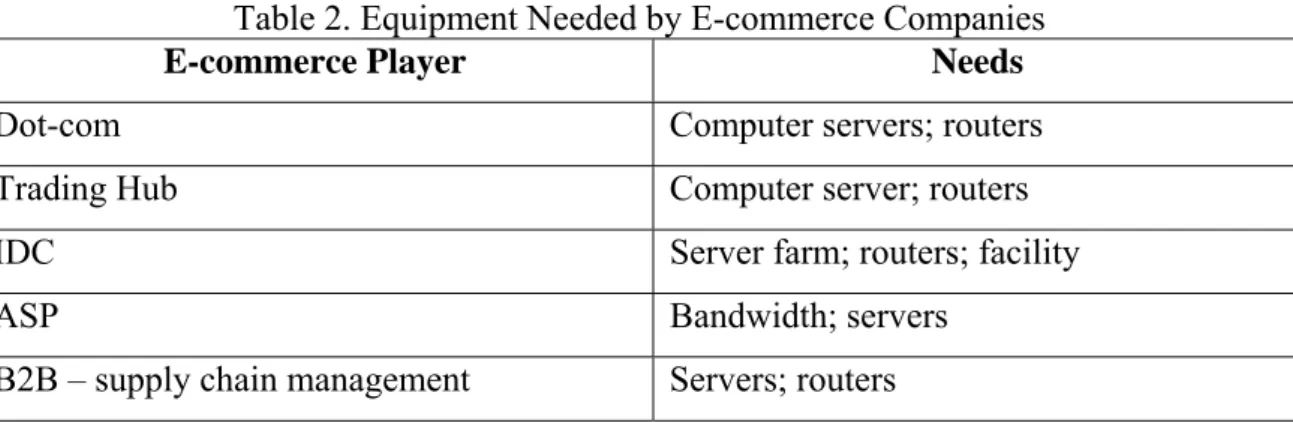
These new E-commerce business models have moved many business activities from the traditional physical world to cyberspace, where they have created huge demand for information technology and telecom networking equipment, such as bridges, routers, and servers (Table 2). Essentially, business and end user E-commerce needs stimulated telecom growth.
Table 2. Equipment Needed by E-commerce Companies
E-commerce Player Needs
Dot-com Computer servers; routers
Trading Hub Computer server; routers
IDC Server farm; routers; facility
ASP Bandwidth; servers
B2B – supply chain management Servers; routers
2.1.3 Driver : high-speed Internet access
The explosion of Internet traffic was beyond anyone’s imagination (Beranek, 2000). Regardless of measurement criteria, its growth was remarkable on all fronts – the number of hosts, the number of users, the amount of traffic, the number of links, the bandwidth of individual links, or the growth of ISPs (Internet Service Providers).
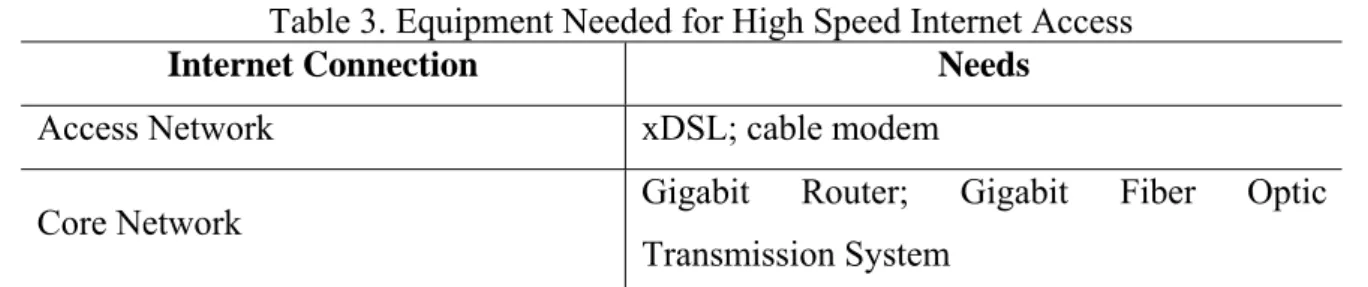
Web surfing, e-mail, on-line banking, on-line trading, music on demand, and distance learning all rely on the last-mile high speed Internet access link between telecom carrier office and customer premises. As these web-based activities become more enriched with video, audio, and graphics, customers are no longer satisfied with the traditional modem dial-up access, and instead broadband access becomes essential. To meet customer demand, ISPs and cable operators use xDSL and cable modem technologies to offer high speed Internet access. In the core network, Gigabit routers and Gigabit Fiber Optic Transmission Systems have been deployed to make ready for broadband Internet services. These broadband access and core network upgrades have again created huge demand for telecommunications equipment (Table 3).
Table 3. Equipment Needed for High Speed Internet Access
Internet Connection Needs
Access Network xDSL; cable modem
Core Network Gigabit Router; Gigabit Fiber Optic
Transmission System
2.1.4 Driver : IP packet technology
As Internet and WWW applications grow worldwide, data traffic is expected to exceed voice traffic in the PSTN (Public Switched Telephone Network). To meet this demand, the traditional PSTN is pressured to evolve. Circuit switching, the foundation of the PSTN is being supplanted by packet switching, a technology more suitable for transporting data. Routers and Call Agents, so called “soft switches”-- such as Sonus soft switch -- are based on IP technology and are being developed and deployed to replace traditional circuit switches. In addition to these, a whole spectrum of IP-based equipment and functionalities will need to be developed and integrated into the new network. The evolution of IP technology has pushed development of IP-based telecom equipment (Cheng, et al., 2003).
Furthermore, to achieve the full operational efficiency of IP networks, the vision of an “All IP” network has been promoted by the industry. “IP over DWDM” and “Wireless IP” have been hot R&D topics in the NGN (Next Generation Network) IP deployment. Since the service features, operations, and management of an IP network are fundamentally different from that of the existing PSTN network, this IP network evolution will indeed require huge capital spending by telecom service providers. Big R&D investment among telecom manufacturers to develop the new IP technologies and equipment, ranging from IP CPE gateway, IP core network, and IP network management systems, etc., have already begun. The emergence of IP packet technology has created an expensive new technology push (supply side driver) in the telecom industry.
2.1.5 Driver : mobile communications services
The convenience of wireless communications generated tremendous global user demand. In particularly, GSM (Global System for Mobil Communications) has had unprecedented success in the worldwide wireless communications market. By 2000, two out of three Europeans had a mobile phone. Asian GSM market penetration is also proceeding at breath-taking pace. For example, cell phone market penetration rate in Taiwan has reached over 100%. Seamless roaming ability is one of the key features for GSM’s success in the worldwide wireless market, and to lure consumers into becoming mobile service subscribers, wireless service operators subsidize mobile handsets. While wireless operators are busy expanding their wireless networks, mobile handset manufacturers also enjoyed revenue expansion (Table 4). Today, mobile communications have become the fastest growing and most lucrative market for telecom service providers and manufacturers (Cheng, et al., 2003).
Table 4. Equipment Needed by Mobile Service Operators and Subscribers
Mobile Operators/Subscribers Needs
Mobile Core Network Operators Base Station, Mobile Switching Center
Mobile Service Subscribers Mobile Handsets
2.1.6 Driver: promise of new digital economy
The perceived potential of E-commerce via the Internet created an optimistic vision of the so-called “New Economy” which was going to revolutionize the traditional brick-and-mortar “Old Economy”. Underpinning the “New Economy Internet Era” was the assumption and perception of a new economic business model - “Fast coverage of network facilities and dominance of customer base take precedence over short-term revenue or profitability.” It was assumed that profitability would come naturally after market share was secured. To attract customers, Websites rushed to offer free services and content, generating tremendous Internet traffic throughout the world. New Economy proponents thought that Internet traffic would go
wherever bandwidth was available, and that delays in network expansion would only result in customer dissatisfaction with service throughput and response time, an increase in customer churn rate, loss of revenue, and eventual business decay. The New Economy became a race to expand investment into service development as well as network equipment and facilities deployment.
The stock market and the venture capitalists concurred and supported such visions and strategies. The combined results were an abundant supply of capital generously invested to the Telecom Service Providers, E-Commerce Providers, Information Content Providers, Internet Services Providers, etc., and led to an unprecedented expansion in the telecom industry from 1995 to 2000 (Cheng, et al., 2003).
2.1.7 Driver: acquisition strategies
As Internet service providers continue to demand faster broadband Internet technologies and solutions to compete in the market of digital economy, telecom equipment suppliers remain under pressure to shorten the development cycle to come up with new versions of products and systems. Many suppliers acquire small, innovative technology companies to gain access to new technologies and product ideas for IP, optical, broadband, and wireless, etc. For example, Cisco acquired more than 40 companies in the past few years to beef up its networking product offering.
Since the stock prices of Cisco and most other telecom manufacturers had high valuations over the past few years, they were able to leverage their high stock prices to acquire target startup companies. For example, Cisco paid a premium price of $7 billion for optical equipment maker Cerent and $5.7 billion in stock for ArrowPoint Communications. Overall, Cisco’s acquisitions have contributed to 40% of Cisco’s $25 billion in revenue in 2000 (Shinak, 2001).
Imitating Cisco’s successful acquisition model, many other telecom suppliers employed the same strategy to broaden their product offerings. Often, bidding on acquisition targets created tremendous market values for startups, which may not have even had a customer or a commercial product. These high acquisition prices on telecom startups not only changed the traditional rules of “market valuation”, but also changed the rules of “wealth creation”. Consequently, the impact of these high market valuations of telecom startups attracted more venture capitalists investing in this sector. When investors perceived an increase in their market competitiveness, the acquirers’ market valuation also increased. The stock market’s positive feedback on acquisition contributed to the temporary prosperity of the telecom industry.
2.1.8 Driver: telecom equipment vendor financing
Building up telecom infrastructure requires huge capital investments. However, it takes time to sign up fee-paying subscribers and to build up revenue streams from telecom services. To obtain the necessary capital for network deployment becomes a critical issue, particularly for new telecom service startups. Naturally, telecom service providers sought financial assistance from telecom equipment vendors. The financial assistance could range from investing money in the company, accepting startup company stock in exchange for equipment, or making loans with flexible payments towards the purchase price of the equipment. In a promising telecom market where service operators looked at promising future and equipment manufacturers enjoyed tremendous revenue growth, “vendor financing” was a common practice among telecom equipment suppliers. In a highly competitive telecom equipment market, “vendor financing” was also essential for major telecom equipment manufacturers to win contracts from telecom service providers. With this easy source of capital, new startups as well as incumbent telecom service providers further accelerated their network buildups to expand their market size and to compete for market share. This buildup, in turn, fueled the
demand for telecom equipment and resulted in revenue growth for telecom equipment vendors (Rosenbush, et al., 2001).
Table 5 summarizes the business drivers that brought about the explosion of growth in the telecommunications industry.
Table 5. Summary of Business Drivers for Telecom Boom
Business Drivers Results
Telecommunications Deregulation
New CLECs, ILECs, cable and mobile wireless carriers; demand in new network infrastructures and network upgrades
E-Commerce Demand in IT and networking products
High Speed Internet Access Demand in high speed Internet access and core equipment
Packet Technology Demand in IP NGN products
High Growth of Mobile Communications Global demand of mobile equipment
New Digital Economy
Market shares are top priority and bandwidth drives demand; continuous infrastructure investment
Acquisition Strategy High market valuation; abundant capital
for start ups
Vendor Financing Available capital for faster network
buildups; more capital spending
2.2 Gloom in The Telecommunications Industry
Many factors contributed to the slowdown of the global economy, which started the third quarter of 2000. However, the telecom industry has certainly been one of the major contributors to this economic downturn. In this section, we look at the history of the telecom industry to see what “business draggers” have slowed down the telecommunications industry.
Over the years, too much capital was invested in the telecom industry, which resulted in too many companies producing too many products. The telecom network was overbuilt, and
narrow or even negative profit margins dampened capital spending among telecom service providers. Decreased spending further created a downward spiral effect on the telecommunications industry for both service providers and manufacturers (Cheng, et al., 2003).
In this section, we summarize various business draggers, including the 3G license auction, uncertainty of 3G profitability, network over-build and brutal price competition, the heavy debt of telecom startups and dot-coms, bad loans of telecom vendors, second-hand equipment, B2C and B2B investment spending cuts by corporate America, and write-offs on acquisitions which all contributed to the downturn of the telecommunications industry.
2.2.1 Dragger: 3G license auction
From 1994 until now, the U.S. government has received spectrum bids totaling more than $41 billion. Envisioning the potential fiscal income to the government, and inspired by the success of GSM, a few European telecom regulators chose to award their 3G licenses based on the auction mechanism. In 1997, the British government hired game theorist Ken Binmore, a London University economics professor, to help design a 3G auction. In April 2000, five licenses sold for an incredible $35.4 billion, shocking everyone. It left even the free spending mobile industry breathless (Foroohar, 2001).
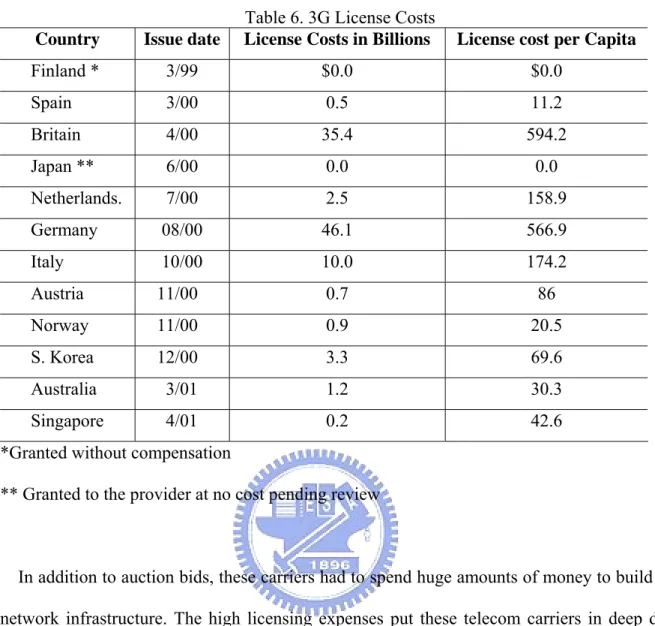
The impact of the UK spectrum auction quickly spread to other European countries. In August 2000, the total take for the German auction was a record $46.1 billion. In 2000, carriers across Europe paid $110 Euro billion for 3G licenses. (See Table 6) Inevitably, this prohibitive amount of money had to come from global financial markets.
Table 6. 3G License Costs
Country Issue date License Costs in Billions License cost per Capita
Finland * 3/99 $0.0 $0.0 Spain 3/00 0.5 11.2 Britain 4/00 35.4 594.2 Japan ** 6/00 0.0 0.0 Netherlands. 7/00 2.5 158.9 Germany 08/00 46.1 566.9 Italy 10/00 10.0 174.2 Austria 11/00 0.7 86 Norway 11/00 0.9 20.5 S. Korea 12/00 3.3 69.6 Australia 3/01 1.2 30.3 Singapore 4/01 0.2 42.6
*Granted without compensation
** Granted to the provider at no cost pending review
In addition to auction bids, these carriers had to spend huge amounts of money to build 3G network infrastructure. The high licensing expenses put these telecom carriers in deep debt even before they started to build their 3G networks, let alone generate any revenue. Coupled with the fact of dropping average revenue per GSM user and the uncertainty of 3G launch dates and consumers’ acceptance of 3G services, bankers and financial analysts became concerned about the future financial soundness of European mobile service operators. Fearing the lack of payback capability of these mobile operators, banks hesitated to lend to these telecom carriers. Stock market analysts realized that mobile operators could no longer sustain high enough profitability to justify their high valuation. Alarmed investors began profit-taking actions by selling mobile service stocks. As a result, stock prices of financial institutions that had financed or invested heavily in the telecom industry also plunged. Doubt about mobile
rippled across different industry sectors on different continents (Foroohar, 2001). In retrospect, it appears that the financial burden created by European 3G licensing auctions triggered the global economic slowdown.
2.2.2 Dragger: uncertainty about 3G rollout and profitability
In anticipation of a continued fall in average revenue per user, second generation wireless service operators looked to 3G broadband services as the next promising opportunity for business growth. Wireless equipment manufacturers competed to invest heavily in the R&D of 3G system equipment and handsets. Spending by most of the major wireless equipment manufacturers on 3G products and system development curved upward steeply (Foroohar, 2001). As 3G equipment manufacturers continued to promote and encourage 3G capabilities and full-color video wireless handsets, wireless service providers, investors, and consumers became excited and anxious for the arrival of 3G.
However, in auctioning 3G licenses, the U.K. and Germany in April and August of 2000 required the licensees to pay prohibitive auction bids. Wireless carriers and investors became seriously concerned about the availability date for 3G network systems and the potential profitability of 3G services. They found that 3G standards had not been finalized, a few interfaces had not been defined, and the technologies of 3G system equipment and handsets would not be mature until the end of 2002 or 2003. Japan had to postpone its initial 3G service launch from May till October of 2001. Since experimental 3G systems were based on an unstable 3G standard, their service offerings could be only a subset of full-blown 3G services. Besides disappointment over the delay of 3G availability, there exists competition from 2.5G substituting technologies, i.e., GPRS and EDGE, which can offer similar wireless data services. These concerns about 3G have created a negative impact on the stock market performance of the mobile service industry.
2.2.3 Dragger: network overbuild and brutal price competition
As a result of telecommunications deregulation in the U.S. and some European countries, many new telecom service operators were established, causing an excessive over-build of telecom networks in almost all telecom markets. According to Solomon Brothers (Hu, 2001), worldwide telecom carriers spent over $35 billion to build up to 100 million miles of fiber optical network in 1999 and 2000. The utilization of such broadband optical networks, however, only reached 5%. As technological enhancements in optical communications advanced, new generations of telecom equipment e.g. DWDMs, and routers etc., with larger capacity, faster speed, and lower per unit costs kept coming on the market, pushing telecom operators to purchase them just to stay competitive. This excessive capacity inevitably resulted in price competition, and prices for long distance data transport fell 20% to 50% annually (Foroohar, 2001).
By 2000, most telecom service providers had expanded their capital investment and operating expenses, substantially exceeding the growth rate of their service revenues. Additionally, the price war further eroded service operators’ future prospect of profitability (Henry, 2001). When bandwidth became excessive and demand lagged behind never-ending investment requirements, investors began questioning the validity of the business model of the telecom service industry.
2.2.4 Dragger: heavy debt among telecom startups and dot.coms
In the past few years, global telecom service operators, particularly in the U.S. and Europe, had access to abundant capital through financial institutions, stock markets, and vendor financing for their network buildups and expansions. Consequently, they accumulated heavy debt. Total carrier debt reached 91% of sales compared with only 29% in 1997 (Henry, 2001). As the capital market felt the rising risk of these heavy debts, it balked at its over-optimistic investment practices and instead focused on the bottom line of the telecom start-ups and
Internet related companies. Investors looked for profit, not subscriber numbers or market share. The resulting downward spiral effect on startups and Internet dot-coms was tremendous. Some analysts estimated that U.S. and European telecom carriers might have $700 billion in debt and more than $100 billion in junk bonds that will either end up in default or be restructured (Elstrom, et al., 2001). The impact of the heavy debt of telecom carriers became a major contributor to the tumble of global stock markets in the 3rd quarter of 2000. 2.2.5 Dragger: bad loans by telecom vendors
As more telecom start up companies experienced bankruptcies and failures, defaulted loans provided by telecom manufacturers caused serious financial damage. For example, the five leading North American equipment makers alone had $4.8 billion worth of vendor financing on their books. Nortel Networks had $1.6 billion; Cisco had $475 million; and Lucent Technologies Inc. had $1.3 billion. As telecom service providers failed, vendor-financed bad loans dragged the telecom manufacturing industry down (Rosenbush, et al., 2001).
2.2.6 Dragger: second-hand equipment
With the abrupt slow-down of the telecom service industry, telecom equipment purchases came to a virtual standstill. These purchase cuts created excessive inventory problems for networking equipment suppliers and computer server manufacturers. Compounding these inventory problems, the bankrupt dot-com companies flooded the second-hand equipment market with many used or “near new” routers, servers, and other networking gear which they sold for only one-tenth of the original price. The supply of second-hand equipment worsened the sales of new telecom equipment. For example, Cisco Systems’ inventory ballooned a further 29% in the second quarter of 2001 to $2.53 billion after a massive 59% increase in the first (Miller, et al., 2001). Due to their mutual dependence, the telecom equipment industry collapsed following the telecom service industry in this economic slow-down.
2.2.7 Dragger: B2C and B2B investment cuts
Global stock investors not only scrutinized the profitability of telecom service and equipment industries, but also began using the evaluation criteria of the “old economy” to scrutinize the financial health of all Internet related companies and investment activities of the “new economy”. Consequently, not only investments in dot-com companies, but also spending on B2C and B2B hardware and software quickly fell. Most US corporations reported spending only one-third of their original projections in 2001 (Miller, et al., 2001).
The impact of these cutbacks in capital spending on telecom and information technology equipment started a downward spiral for the telecommunications industry and across all related downstream industries.
2.2.8 Dragger: write-offs of acquisitions
Acquisition had been one of the most effective strategies that telecom manufacturers employed to expand their business portfolios; however, many of those acquisitions were done under the assumption of sustained market growth. Some were worth very little after the economic slowdown. From January 2000 to February 2001, Nortel spent $17.1 billion on acquisitions. Then, in June 2001, Nortel announced a $12.3 billion write-off, which was primarily associated with those acquisitions as “impaired assets”. Cisco also took $289 million in write-offs for impaired assets. Although Cisco took a relatively small write-off compared to Nortel, there were still huge potential write-offs for Cisco as well as other telecom manufacturers in light of their past acquisition investments. As the economy slowed down, these “impaired assets” further deepened the financial crisis in the telecom manufacturering industry (Lashinsky, 2001).
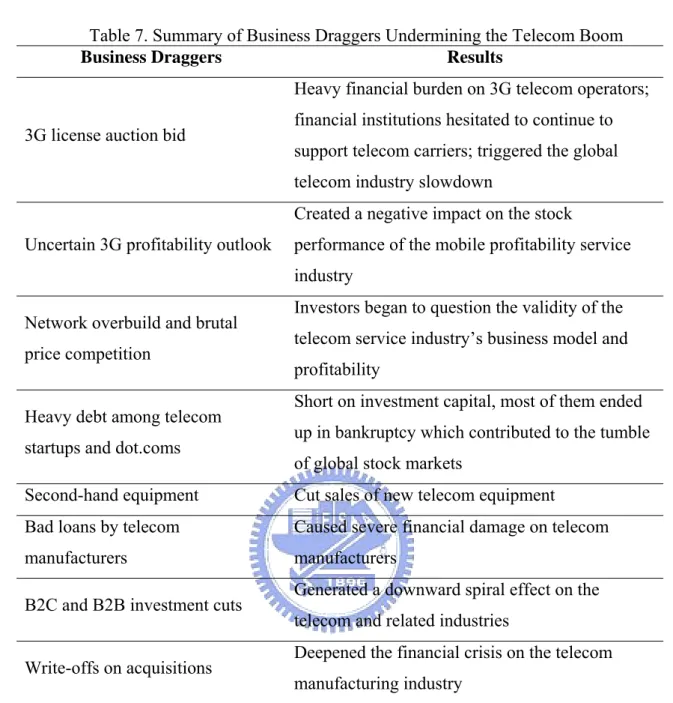
Table 7 summarizes the business draggers that undermined the telecommunications industry boom.
Table 7. Summary of Business Draggers Undermining the Telecom Boom
Business Draggers Results
3G license auction bid
Heavy financial burden on 3G telecom operators; financial institutions hesitated to continue to support telecom carriers; triggered the global telecom industry slowdown
Uncertain 3G profitability outlook
Created a negative impact on the stock
performance of the mobile profitability service industry
Network overbuild and brutal price competition
Investors began to question the validity of the telecom service industry’s business model and profitability
Heavy debt among telecom startups and dot.coms
Short on investment capital, most of them ended up in bankruptcy which contributed to the tumble of global stock markets
Second-hand equipment Cut sales of new telecom equipment Bad loans by telecom
manufacturers
Caused severe financial damage on telecom manufacturers
B2C and B2B investment cuts Generated a downward spiral effect on the telecom and related industries
Write-offs on acquisitions Deepened the financial crisis on the telecom manufacturing industry
2.3 Telecommunications Industry’s Latest Developments and Possible Next Steps
After the telecommunications bubble burst in late 2000, the overall industry was damaged severely. The giant telecom carriers and manufacturers underwent large scale downsizing and were forced to reverse their financial forecasts and growth prospects. Many companies folded. Further, questionable accounting practices and bankruptcies dampened investors’ confidence in the telecommunications industry. For telecom service operators, lack of capital meant delays in network enhancement and new service development. The impact on telecom equipment manufacturers will likely be huge write-offs in accounts receivable and shrinkage
of future revenues. Hence, more telecommunications consolidations may be forthcoming. The short-term outlook for the telecommunications industry will be bleak until existing losses are recovered. Is, however, the information revolution dead? Will the telecommunications economy thrive again? If so, when? In this section, we will examine the internal innovation and external forces and trends that may push the telecommunications industry back on track in the future.
2.3.1 Adopting supply chain management
The strategy for a growing economy is investment for expansion. However, for a shrinking economy, the strategy has to be cost cutting and improving efficiency. Focusing on core competency and outsourcing non-core functions has become a global trend across industries. Dell Computer’s success strategy in the PC industry is a role model for the telecommunications industry. In this horizontal integration business model, overall operational efficiency is gained through supply chain management across all levels of suppliers. Sharing information with upstream suppliers on market trends as well as products ordered by end customers on a near real-time basis can increase production planning efficiency, reduce inventories, and speed up product delivery by upstream suppliers as well as downstream telecommunications equipment vendors. Pursuing Supply Chain Management can push costs down, drive up demand, and improve the telecommunication industry’s financial performance. In the current over-supplied telecom market, more outsourcing and partnership formation will occur in the industry, and supply chain management systems will be the key enabler for such horizontal integration.
2.3.2 Generating new revenue with SMS and MMS
In light of the uncertain 3G perspectives and many wireless carriers’ difficult financial situations, it might take several years before 3G wireless platforms can be established to deliver on promised multimedia services. Meanwhile, wireless carriers are looking for killer
applications to generate new revenue based on the existing 2.5G GPRS data platform. Currently, SMS (Short Message Service), a text-based messaging service, has become quite popular among cellular phone users. Greetings, jokes, stock quotes, weather/flight information, and bank statements are among the many kinds of SMS services offered by wireless carriers. An enhancement to SMS is MMS (Multimedia Message Service), which allows subscribers to transmit pictures, music or video clips, as well as file transfers among mobile phone subscribers. Fortunately, such enhanced multimedia service can be offered based on the existing 2G wireless network infrastructure. It means no huge network investment is necessary to generate potentially substantial revenues for wireless carriers. Moreover, once subscribers become familiar with and accustomed to the MMS services, they will demand faster transmission speed and wider bandwidth. By that time, broadband 3G technologies will be driven by market needs rather than a new technology looking for opportunity. The promising interactive Multimedia Message Service not only can help generate additional revenues, but can also prepare a smooth path for evolution to third- generation wireless communication (Cheng, et al., 2003).
2.3.3 Emerging wireless-LAN technology
While 3G promises to offer broadband wireless Internet access data services in the future, IEEE 802.11 wireless LAN technology is becoming increasingly available in the enterprise and public hot spots (e.g. airports, restaurants, hotels, and other public places). In addition, with the growing penetration of ADSL/cable modems into the residential market, there is a growing need to connect multiple PCs and peripherals in homes. As installation becomes easier and prices fall, wireless LAN will work well as a home network. The popularity and quick proliferation of wireless LAN can be attributed to the following factors: