Theory and Applications of Sum-Frequency Generations
C. K. Lin,
a,bL. Yang,
a,c,* M. Hayashi,
d,* C. Y. Zhu,
aY. Fujimura,
a,bY. R. Shen
eand S. H. Lin
a,b,*
a
Department of Applied Chemistry, Institute of Molecular Science and Center for Interdisciplinary Molecular Science, National Chiao-Tung University, Hsinchu 30050, Taiwan
b
Institute of Atomic and Molecular Sciences, Academia Sinica, Taipei, Taiwan c
Institute of Theoretical and Simulation Chemistry, Academy of Fundamental and Interdisciplinary Science, Harbin Institute of Technology, Harbin 150080, PR China
d
Center for Condensed Matter Sciences, National Taiwan University, Taipei, Taiwan e
Department of Physics, University of California, Berkeley, California, USA
(Received: Aug. 9, 2013; Accepted: Aug. 13, 2013; Published Online: Oct. 7, 2013; DOI: 10.1002/jccs.201300416)
The SFG technique has become popular since the pioneering work conducted by Shen’s group in late 1980s. Combined the advantages of other surface-detecting techniques, the SFG technique could identify both chemical species and orientations adsorbed on surfaces or inserted between surfaces. In view of the recent tremendous experimental activities of SFG in surface chemistry, biochemistry and material sci-ences, quantum chemical calculations of SFG spectra to analyze the experimental SFG spectra are badly needed. In this paper we presented the theoretical expressions of various SFG techniques and showed how to employ the quantum chemical calculations to simulate the corresponding SFG spectra.
Keywords: Spectroscopy; Nonlinear optical processes; Susceptibility method.
Special Issue for the 60th Anniversary of Journal of the Chinese Chemical Society
* Corresponding author. Tel: +886-3-5712121#56591; Fax: +886-3-5723764;
Email: [email protected], [email protected], [email protected]
Prof. S. H. Lin is currently a professor at the Department of Applied Chemistry, National
Chiao Tung University. He is also an academician of the Academia Sinica, Taiwan. Prof. Lin received his Bachelor’s Degree in 1958 and Master’s Degree in 1960 in Chemistry from National Taiwan University. He obtained Ph.D. from University of Utah in 1964. He was an Assistant Professor (1965-1968), Associate Professor (1968-1972), and was pro-moted to professorship 1972~1995 in Department of Chemistry, Arizona State University. He was the Director of Institute of Atomic and Molecular Sciences, Academia Sinica (1993-2007). He has contributed research efforts in the fields of physical chemistry, photochemistry, and theoretical chemistry. He has received several awards including Al-exander von Humboldt Foundation, U.S. Senior Scientist Award (1979-1980, 1986, 1993), Kai-Ying Tsing Distinguished Lecturer (1993), Eminent Scientist of RIKEN (1995), and Taiwanese American Foundation Prize (1995).
INTRODUCTION
The SFG technique has become available on analyz-ing surface species since the works conducted by Shen’s group in late 1987.1,2With an optical parametric amplifier tuned around 2800 to 3100 cm-1with a frequency-doubled Nd:YAG laser, they have successfully recorded IR-Vis SFG spectra of methanol and pentadecanoic acid (PDA) adsorbed on glass and on water surface. By tuning the IR frequency, different vibrational resonances were obtained, and with various combinations of incident beam polariza-tions (s and/or p), different C-H stretching modes were re-vealed. They have further analyzed C-H vibration signals of PDA at different adsorption densities, finding the long alkane chains nearly oriented straightly along the normal to the water surface in the liquid-condensed phase at high density.2
Following these pioneering works, numerous appli-cations of vibrational SFG spectroscopy to surface chemis-try, biochemistry and material sciences emerged. One ma-jor category of experiments focused on the orientations of functional groups of organic polymers adsorbed on solid surfaces.3-9Aliphatic and aromatic C-H stretching modes from different chemical species could be distinguished by resonance frequencies, and their orientations could be de-duced from signal intensities recorded under different com-binations of incident/output beam polarizations. The re-sults showed some substrate-dependence of the adsorbate orientation. For example, the phenyl groups in polystyrene have an average tilt angle of ~20oat the polystyrene-air in-terface when the polymer is adsorbed on sapphire, and ~57o on oxidized silicon substrate.5,6It should be noted that there exist several types of vibrational SFG and electronic SFG. In addition to VSFG, Tahara and coworkers have re-cently made heterodyne-detected electronic sum-frequency generation (ESFG) applicable.10-12In their experiments, two visible/near-infrared beams were guided to the sample where the sum frequency was tuned resonant with an elec-tronic state. By this means the orientation distribution of surfactant-like molecules floating on water surface could be resolved and, furthermore, the pH value of water surface was claimed.13-15It should be noticed that, however, a solid theoretical framework to interpret these important experi-mental results is still in demand. The SFG technique could identify both chemical species and orientations at the same time, which combines the advantages of other surface-de-tecting techniques such as Raman scattering, atomic force microscopy, and X-ray spectroscopy.
In view of the above-mentioned rapid developments of SFG spectroscopies, in this paper we shall present the theoretical expressions of various SFG techniques and show how to employ the quantum chemical calculations to analyze and simulate the corresponding SFG spectra. We shall also give a brief review of SFG experiments in chem-istry, biology and surface science.
THEORY — SUSCEPTIBILITY METHOD
To treat nonlinear optical processes, the susceptibility method is commonly used. The central problem in the sus-ceptibility method is to calculate the polarizationP whichr
is an ensemble average of dipole momentrm, i.e.
r r r
P=Tr(rm$ )=Tr(mr$ ) (2-1) where$r denotes the density matrix of the system. The diag-onal and off-diagdiag-onal elements of$r describe the population and phase (or coherence) of the system, respectively. No-tice that the equation of motion for the density matrixr t$( ) of the system is given by the stochastic Liouville equation16
(2-2) where iL$ '0 = iL$0 + $G, and $L0and $' ( )L t denote the Liouville
operators corresponding to the zeroth-order Hamiltonian and Hamiltonian for the interaction $V between the system
and radiation field, respectively. $G denotes the damping op-erator describing the relaxation and dephasing of the sys-tem. To evaluateP, it is necessary to solve Eq. (2-2). Forr
this purpose, for the weak field case the perturbation method is often used. This can be carried out by regarding $'L in Eq. (2-2) as a perturbation and solving Eq. (2-2) di-rectly.
For SFG, we have to evaluate the second-order polar-ization $P( )2 ( )t given by17
(2-3) In the dipole approximation, one can write $( )V t as
(2-4) and
( )
t E( )
e l( )
t V it i i i i i i i w a a w a m-åå
× -= 2 ˆ r r(2-5) whererm represents the dipole operator, aitakes the value 1
or –1 and li(t) denotes the laser pulse-shape function with
pulse duration Ti. The summation over i in Eq. (2-4)
de-scribes the situation that in SFG two lasers are involved. Equation (2-3) is general and can be applied to study difference-frequency and sum-frequency generations. For SFG, for convenience, Eq. (2-3) can be written as
(2-6) where
(2-7) and, for example, s$i $ ' r$
iL t i
e i
= 0 , Ds( ' )lk º ( $ )s
i ll-( $ )si k k' '
representing the initial distributions of the system. In other words, in SFG the coefficient of exp[-itp(w1+w2)] or
exp[itp(w1+w2)] should be needed. Here in the double
sum-mations over i and j, the i = j terms are to be excluded. One can consider an energy level diagram for SFG as shown in Fig. 1. In Fig. 1, g, m and k denote the initial, in-termediate and final state manifolds, andw1andw2
repre-sent the frequencies of the two lasers used in SFG experi-ments.
According to the definition of the second-order
non-linear susceptibilitycabg( ) w w
( )
2
1+ 2 for SFG,
(2-8) wherea, b and g denote the space-fixed coordinates X, Y and/or Z, it is found (2-9) where (2-10) cabg( ) w w ( ) 2 1+ 2 2 andcabg w w ( ) ( ) 2
1+ 2 3 can be obtained from
cabg( ) w w
( )
2
1+ 2 1 by performing the exchanges k« andm
k« , respectively. The expressions for cg abg( )2 (w1+w2)2
andcabg( )2 (w1+w2)3are negligible and will not be produced
here. Note that in Eq. (2-10),G'mg= Gmg+1/ T ,1 G¢¢mg= Gmg
+1/ T , and2 Gkg
' = G
kg+1/ T1+1/ T .2
From Eq. (2-10) we can see why the SFG is a sur-face-sensitive experiment. It shows thatcabg( )2 (w1+w2) var-ies with transition moments in the product form of m a mgk( ) mg( )b mkm( ) etc. which in turn varies with Carte-g sian coordinates as x3, x2y, xyz etc and the spatial averages of these Cartesian cubic products vanish. This indicates that the signal ofcabg( )2 (w1+w2)in the bulk of liquids is zero. Similarly from Eq. (2-10) we can see that a molecular system with the inversion symmetry is SFG forbidden.
Fig. 1. Energy level diagram for off-resonance–off-resonance SFG.
Taking the termm a mgk( ) km( )g mmg( ) as an example, if theb
state g inm agk( ) is of “gerade” symmetry, the k should be
“un-gerade”. Similarly the state m in mkm( ) would beg
“gerade”. It follows thatmmg( ) would vanish because ofb the “gerade” to “gerade” transition inmmg( ) .b
As discussed in previous papers, there are four cases of SFG.17-23They are resonance–off-resonance, nance–resonance, resonance–resonance, and off-reso-nance–off-resonance cases. It should be noted that Eq. (2-10) plays the role of the master equation forcabg( )2 (w1+w2) which can be used to derive the various kinds of SFG spectroscopies.
VIBRATIONAL SUM-FREQUENCY GENERATION A. Resonance–Off-Resonance Case
In this case (shown in Fig. 2), from Eq. (2-10) we ob-tain the dominating terms
(3-1) For vibrational SFG, we have to make the following changes due to the use of the Born-Oppenheimer approximation,
g ® , mgv ® ', kgv ® , i.e., in terms of vibronic states.ku
The ground state and excited states are expressed as Ygv =F Qg gvandYku =F Qk ku, respectively. Here,F Fg( k)
denotes the ground (k-th electronic excited) BO wavefunc-tion, andQ Qgv( ku) denotes the vibrational wavefunction in
the ground (k-th electronic excited) state. It follows that
(3-2) Using the Placzek approximation,24wku gv, -w -w1 2 @wkg-w -w1 2, wku gv, + w1+w2 @ wkg + w1+w2 and Qku Qku u
å
æ è ç ö ø ÷ =1, we obtain (3-3) or (3-4) wherea aggg( )denotes the polarizability of the g electronicstate,
(3-5) Botha aggg( ) andm bgg( ) should be expanded in terms of normal coordinates Ql,
(3-6) and
(3-7) Substituting Eqs. (3-6) and (3-7) into Eq. (3-4) yields
(3-8) where
(3-9) This indicates that for this vibrational SFG to be non-zero, we should have
(3-10) and
(3-11) That is, the Qlmode should be both IR and Raman active.
In early IR-Vis/UV SFG experiments only c( )2 2
Fig. 2. Energy level diagram for resonance–off-reso-nance SFG.
could be obtained from SFG signal intensities. Neither Re[c(2)] nor Im[c(2)
] could be measured directly; they were fitted fromc( )2 2
profiles and might yield significantly dif-ferent interpretation.25In 1990 Superfine et al. tried to de-termine the “absolute phase” of second-order susceptibility by investigating the relative sign of dipole moment deriva-tive and polarizability derivaderiva-tive with respect to the vibra-tional normal mode.26,27This technique became mature in the 2000s and was applied to the water interface geome-try.25,28
To take into account the phase effect on SFG, we shall rewritecabg( ) w w ( ) 2 1+ 2 as follows (3-12) where (3-13) and (3-14) Notice thatcabg( )2 (w1+w2)R andcabg w w
( )
( )
2
1+ 2 I satisfy the
Kramers-Kroning relation.
In the following we shall use an example to show how to calculate the vibrational SFG spectra by using the quan-tum chemical calculations. Graphene is a novel material due to its unique geometric structure and hence related properties such as electric potential, conductivity, etc. It raises interest as well in the adsorption behavior of this sub-strate, e.g. the orientations of organic polymers adsorbed on the graphene surface, and people have initiated SFG ex-periments to study this topic.29From the theoretical point of view, we have carried out a preliminary SFG simulation of styrene–graphene adsorption system.30
In our approach, the first step was to construct molec-ular models of ethylbenzene, styrene monomer, and poly-merized styrene oligomers (up to 4 units) adsorbed on a (fi-nite-sized) graphene sheet. It was followed by geometric optimization of styrene molecules by DFT computations and it showed the phenyl groups tended to “stand” rather than “lay down” on the graphene surface. With calculated dipole derivatives and polarizability derivatives the
vibra-tional SFG spectra of phenyl and alkyl CH stretching modes were simulated with different polarization combina-tions. These results, some of which are demonstrated in Figs. 3 and 4, have provided the first theoretical prediction to the graphene-based adsorption system and are waiting for experimental investigation.
B. Double-Resonance Case I
In this case (see Fig. 5), from Eq. (2-10) we find
(3-15)
Fig. 3. Optimized structures and stabilization energies (in kcal/mol) of ethylbenzene–graphene and styrene oligomer–graphene systems calculated by B3LYP/6-31G(d). Adopted from Ref. 30.
Fig. 4. Simulated SFG spectra of ethylbenzene– and styrene-oligomer–graphene systems. The cor-responding conformers are shown in Fig. 3. Adopted from Ref. 30.
In the adiabatic approximation, Eq. (3-15) can be written as
(3-16) or
(3-17) This implies that this type of SFG consists of the IR and resonance Raman scattering,
(3-18) or in the Condon approximation,
(3-19) wherem should be expanded in terms of normal coordi-nates Ql, takingm agk( ) as an example,
(3-20) The experiment for doubly resonant IR-Vis SFG has been developed by Shen et al19,20and applied to Rhodamin 6G on silica surfaces. This SFG is basically a two-dimen-sional surface spectroscopy. Given awVis(orlVis), the
in-tensity of SFG spectra versuswIRis shown in Fig. 6 and
given awIR(orlIR) the intensity of SFG spectra versuswVis
(orlVis) is shown in Fig. 7. The theoretically calculated
SFG spectra are also shown for comparison. For conve-nience, the absorption spectra of Rhodamin 6G is shown in Fig. 8.
C. Double-Resonance Case II
In this case (see Fig. 9), from Eq. (2-10) we find that Eq. (3-15) can be used with the adiabatic approximation
g ® ,mgv ®mu, k®mu¢ to obtain
(3-21) It should be noted that this vibrational SFG can pro-vide us the vibrational information of the excited electronic
m state, if we fixw1and varyw2. On the other hand, if we
fixw2and varyw1, we can also get the vibrational
informa-tion of the m excited electronic state through the vibronic spectra of the m state.
ELECTRONIC SUM-FREQUENCY GENERATION A. Resonance–Off-Resonance Case
In this case (see Fig. 10), from Eq. (2-10) we obtain
(4-1)
Fig. 5. Energy level diagram for double resonance SFG.
Fig. 6. Double resonant SFG spectra for Rhodmin 6G with a fixedwVis(orlVis).
For electronic SFG, we have to make the following changes due to the use of the Born-Oppenheimer approximation,
g ® , mgv ®mu, k®kw
where gv, mu and kw denote the vibronic states. It follows that
(4-2) By using the Placzek approximation24and the closure
rela-tion kw kw w
å
=1, we obtain, (4-3) or (4-4) where (4-5) Notice that (4-6) where the real part is(4-7) and the imaginary part is
Fig. 7. Double resonant SFG spectra for Rhodmin 6G with a fixedwIR(orlIR).
Fig. 8. Absorption spectra of Rhodmin 6G.
Fig. 10. Energy level diagram for resonance–off-reso-nance electronic SFG.
Fig. 9. Energy level diagram for double resonance SFG.
(4-8) Eq. (4-8) indicates that the imaginary part ofcabg( )2 (w1+w2) is closely related to the electronic absorption spectra.
In the Condon approximation we obtain
(4-9) and
(4-10) Notice that
(4-11) The g« transition intensity in electronic SFG ism
determined by the electronic matrix elementmmg( )bagm(ag)
rather than rmmg
2
in the ordinary absorption spectra.
B. Off-Resonance–Resonance Case
We next consider the off-resonance–resonance case (shown in Fig. 11). From Eq. (2-10) we find
(4-12) In terms of vibronic states, we find (with the Placzek ap-proximationwmu gv, »wmg) (4-13) or (4-14) where (4-15) In the Condon approximation we find that
(4-16) (4-17) and (4-18) cabg w w ( ) ( ) 2
1+ 2 I shows that it is closely related to the
ab-sorption spectra for the electronic transition g® with thek
sum frequencyw1+ .w2
In addition to VSFG, Tahara and co-workers have re-cently made heterodyne-detected electronic sum-frequency generation (ESFG) applicable.10-12In their experiments, two visible/near-infrared beams, one was 795 nm and the other was tunable between 540 nm and 1.2 mm, were guided to the sample where the sum frequency was tuned resonant with an electronic state. By this means they have resolved the orientation of surfactant-like molecules float-ing on water surface.13Following that they have studied the pH spectrometry of an air/cationic surfactant/water inter-face by the same technique, obtaining an insight to the acid-base equilibrium,14and furthermore, to the pH value of water surface, where the value is lower than the bulk by 1.7.15It turns out that electronic SFG is helpful to solve this
Fig. 11. Energy level diagram for off-resonance–reso-nance electronic SFG.
long-debated issue; however, it should be noticed that a solid theoretical framework to interpret these excellent ex-perimental results is still in demand.
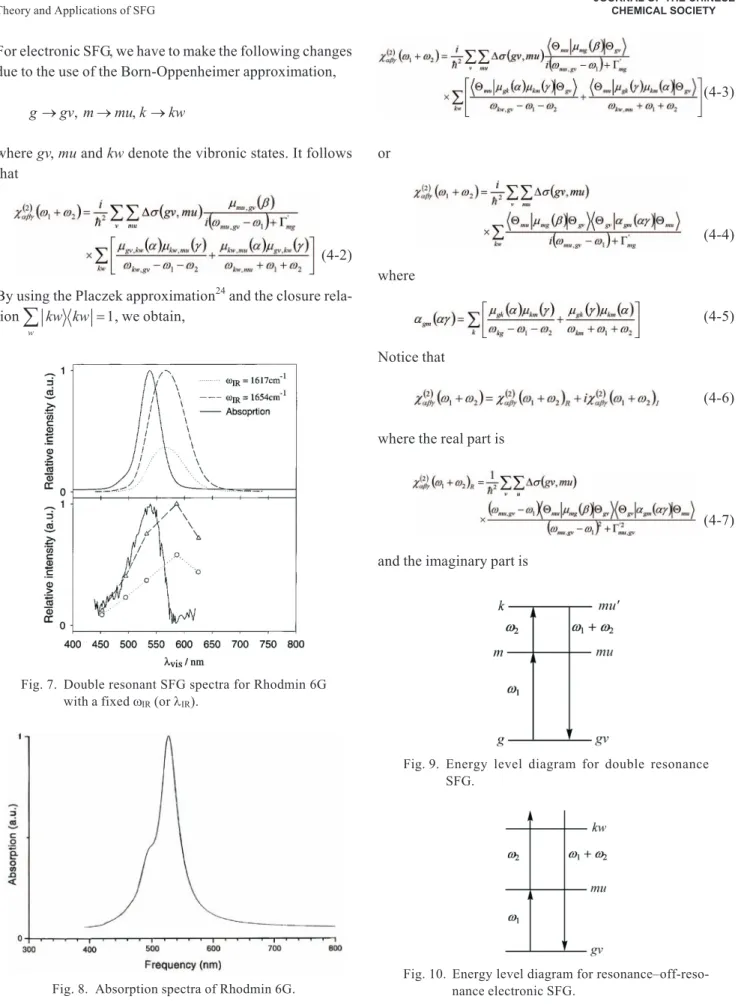
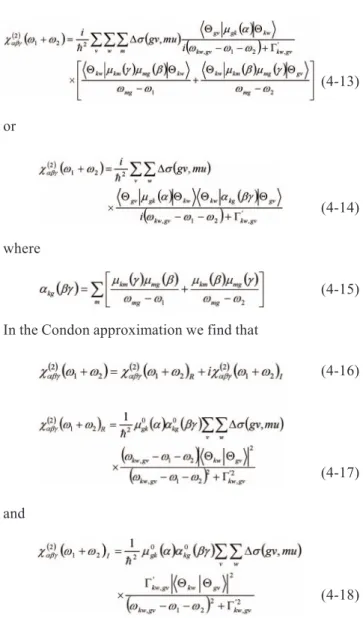
We have chosen 4-methyl-7-hydroxycoumarin (MHC), a pH-indicator surfactant molecule analogous to which Tahara’s group used in their experiments,15to provide a theoretical support to ESFG spectroscopy. A loose optimi-zation showed that the MHC molecule tends to float on the water surface (simulated by a cluster of ~50 water mole-cules) with its oxygen atoms immersed into water while methyl group pointing outward (Fig. 12). Under the off-resonance–resonance scheme, the dominant transition oc-curred from the ground state (11A¢) to the first excited state
(2 1A¢). The corresponding transition dipole moments,
two-photon matrix elements, and Franck-Condon integrals were calculated according to Eqs. (4-16) to (4-18) and the SFG spectrum was then simulated (Fig. 13). This prelimi-nary result is the first theoretical ESFG spectrum to our knowledge, and it may be further improved by including
more detailed factors like non-Condon contributions, more definite orientation distributions, and explicit solvent ef-fects.
C. Double Resonance Case
Next we consider the double resonance case (see Fig. 14). From Eq. (2-10) we obtain
(4-19)
or
(4-20)
In the Condon approximation,
(4-21) Notice that (4-22) where (4-23) and
Fig. 12. MHC anion floating on the surface of a small water cluster, where red and dark gray spheres represent oxygen and carbon atoms, respec-tively.
Fig. 13. Simulated electronic SFG spectrum of MHC with the sps polarization.
Fig. 14. Energy level diagram for double resonance electronic SFG.
(4-24)
ORIENTATION AND EULER ANGLE TRANSFORM
Till now we focused on the second-order susceptibil-ity,c( )2
, of a molecular system embedded in a heat bath. To correlate these molecular properties to experimental observables, one has to include information of molecular orientation distribution as well as beam angles defined un-der laboratory frames. Given the molecular coordinates,
xyz, laboratory frames, XYZ, and the rotation angles,fqy,
in the z-y-z convention (Fig. 15), the Euler rotation matrix between the two coordinate systems is31angles (fqy) be-tween the two coordinate systems.
(5-1) Now we consider the projection of molecular second-order susceptibility onto the laboratory frame. With an orienta-tion average over a group of molecules, the projecorienta-tion is
(5-2) where I, J and K indicate laboratory frames X, Y and/or Z, l,
m and n refer to molecular coordinates x, y and/or z, N is the
density of molecules at the interface, and ××× is the
orienta-tion average.cIJK
( )2
has 27 elements but most of them vanish supposing the molecules have an azimuthally isotropic dis-tribution on the XY plane. For example, a molecule of the
C2vpoint group has only seven elements survived and some
of them being mutually dependent after the orientation av-erage:32
(5-3) Next we take beam angles into account. Givenq1and q2the incident beam angles andqSFGthe output beam angle
with respect to the surface/interface normal, the effective susceptibilities at different combination of beam polariza-tions (s or p) are32
(5-4) (5-5)
(5-6) where the sequence of beam polarization noted here is wSFG,w2andw1. In above equations L’s refer to Fresnel
fac-tors which are functions of refractive indices and wave-lengths.32,33
DISCUSSIONS
A. Applications to Water Interface
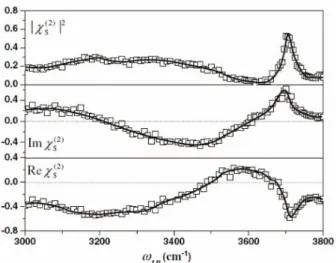
Faraday was the first to propose that there could exist on ice a thin film of liquid water even below the bulk melt-ing temperature.34,35The PPP-SFG vibrational spectra in the OH stretch region for the ice/vapor interface of the hex-agonal ice structure exhibit two peaks: the strong peak at ~3200 cm–1 that is originated from OH groups hydro-gen-bonded to the neighbors and the narrow peak at 3700 cm–1is assigned to the dangling OH bonds at the surface.36 For the study of surface melting, the orientation informa-tion of the dangling OH bonds should provide a clue as to how the peak varies with temperature below the bulk melt-ing temperature. If the ice surface would remain crystal-line, the peak position and strength would not change ap-preciably with temperature. A quantitative analysis of the
Fig. 15. Cartesian coordinates of laboratory frames (XYZ) and molecular axes (xyz) and rotation angles (fqy) between the two coordinate sys-tems.
peak at 3700 cm-1shows that the orientational order param-eter of the dangling OH bonds decreases from 1 (for perfect ordering) around 203 K to 0.3 at 273 K.36For water/vapor interface (above 273 K), the orientational order parameter of the dangling OH bonds suggests more ordered orienta-tion compared to quasi-liquid on ice. The SFG-VS spec-trum of OH stretch region of the neat water/vapor interface was reported (see Fig. 16).37This spectrum has been repro-duced by other groups.38-44The characteristics of the spec-trum are (1) a sharp peak at 3700 cm-1that can be assigned to the dangling OH bonds jutting into the vapor, (2) a very broad band for the hydrogen-bonded OH that can be com-posed of two sub-bands around 3400 cm-1 and 3200 cm-1.37,45Comparing these band frequencies to IR absorp-tion bands of bulk ice and liquid samples, it was concluded that OHs in the topmost layer DAA, DDA, and DDAA (Fig. 17, where D and A represent hydrogen donor and hydrogen acceptor, respectively, in the hydrogen-bonding network) molecules loosely donor-bonded to molecules below con-tributed to the “liquid-like” negative band, while OHs of tetrahedrally bonded DDAA molecules in lower layers contributed to the “ice-like” positive band through their
do-nor-bonding to upper DAA and DDA molecules. This sup-ported the idea that the surface layer of water is relatively disordered, while the lower layers have some ordered (to a certain extent) ice-like structure.46,47Many groups have proposed various interpretations of the origin of sub-bands.39-44,48-54Thus there has been a great deal of confu-sion. There have been many theoretical approaches at-tempting to solve the issue; however it is still difficult to correlate the spectral features with the interfacial struc-ture.55,56Another possible reason for the confusion is due to the fact that SFG vibrational spectra were obtained by the intensity proportional to the absolute square of the sur-face nonlinear susceptibility. The sursur-face nonlinear suscep-tibility is a complex number and the spectrum of its imagi-nary part is analogous to the imagiimagi-nary part of the dielectric function, in other words, that to the absorption or emission spectrum. The phase-sensitive SFG-VS technique devel-oped by Shen’s group allows direct observation of the imaginary part of surface nonlinear susceptibility (see Fig. 16).28,57
Du et al. was the first to report the fitting result of the measured intensity yielding two negative discrete reso-nances at 3200 and 3450 cm-1. These two peaks were la-beled as “ice-like” (3450 cm-1) and “liquid-like” (3200 cm-1) bands because of their similarities to the IR and Raman spectral features of bulk ice and water.37,45
The Richmond group first used two negative and one positive resonance bands for fitting in the bonded-OH re-gion, in addition to one positive and one negative weak shoulder on the two sides of the dangling OH peak.52Later, based on isotopic water mixtures results, they fit the bonded-OH part of the H2O/vapor spectrum by three
nega-tive resonance bands at 3200, 3310, and 3420 cm-1, the first two of which were assigned to the donor-bonded OH of the tetrahedral coordination molecules.
Based on the IR and Raman spectral analysis, the Allen group fit the SFG-VS intensity spectrum by three negative resonances bands (3250, 3450 and 3550 cm-1).40,54 Furthermore, they added a positive peak at 3748 cm-1, which was suggested to be due to two coordination mole-cules. Wang and co-workers fit the bonded-OH spectrum by three negative resonance bands (3250, 3450, and 3550 cm-1) and different interpretation was made for these three bands.39,53
Bonn’s group found that the intensity spectrum of the D2O/vapor interface can be the same as that of H2O/vapor
interface via a frequency rescaling.43They fit the
bonded-Fig. 16. Phase-sensitive vibrational SFG spectra of water surface in the OH stretching region. Adopted from Ref. 46.
Fig. 17. Configurations of water molecules catego-rized by hydrogen donating/accepting in the hydrogen-bonding network.
OD spectrum by two negative resonance bands centered at 2400 and 2515 cm-1. The former corresponds to 3200 cm-1 “ice-like” band and the latter to 3400 cm-1“liquid-like” band in the H2O case. Attribution was made as the
symmet-ric stretch OH mode and its Fermi resonance. Later they fit the intensity spectrum in the bonded-OH region by a differ-ent set of bands (one positive band at 2320 cm-1and two negative bands at 2415 and 2540 cm-1). The assignment of the two negative bands was also made in the same way as the previous case.
In short, the fitting spectra of the imaginary part of the second order susceptibility do not show any positive band in the bonded-OH region. However, Shen’s group has reported the OH stretch region of the phase-sensitive SFG-VS spectrum of H2O/vapor and found that the
spec-trum of the imaginary part of the phase-sensitive SFG-VS consists of roughly three bands: a positive peak at around 3700 cm-1, a negative band from ~ 3200 to 3600 cm-1, and a positive band below 3200 cm-1.28,57-59This direct observa-tion result is quite different from those previously reported based on the fitting approaches.
Theoretical calculations on water interfacial struc-tures using MD simulation have been reported over years. There are two types of such simulations: (1) the orientation and geometry of a water molecule in the ensemble are sim-ulated under a given force-field and the coupling matrix el-ements and normal modes are mapped to those calculated quantum chemistry methods for a given orientation and ge-ometry. In this case, the spectral features can be correlated to the normal modes of a molecule in a certain orientation and geometry. The effects of the intermolecular interaction between the coupling matrix elements are taken into ac-count via constructing the total polarization (or susceptibil-ity) with an electrostatic interaction model,56(2) a correla-tion funccorrela-tion of the total dipole moment and total polariza-bility tensor is generated via MD simulation as a function of the trajectory and the half-Fourier transformation is used to obtain frequency domain spectra.55The latter has been popular because of the simplicity of the computational pro-cedure and it allows performing more applications. How-ever, the latter approach does not use any normal modes thus it is quite difficult to correlate the spectral features to the orientation and geometry of a molecule in the ensemble. With MD simulation approach, strikingly a positive or negative sign of the bands appearing in the resulting spectra depends quite heavily on the type of the force-field used. There seem to be two different mechanisms for the
positive band below 3200 cm-1. All MD based simulations calculate the total dipole moment and the total perishability tensor that involve the contribution from all the molecules in the ensemble. Thus when the correlation function is con-structed, self-correlation (site correlation) term and inter-ference term appear. The interinter-ference term is attributed to the positive band55,56while without mentioning these two terms, the different group uses many-body force-field to show a positive band below 3200 cm-1.60
Quite recently, quantum MD simulation has been per-formed on SFG-VS spectra of water/vapor surface,61which calculates a potential energy surface quantum mechani-cally using on-the-fly algorithms. Thus this approach es-sentially takes into account the many-body effect. Interest-ingly, only the site-correlation term can produce a positive band below 3200 cm-1. However, due to a time-correlation approach, quantum MD simulation also cannot provide a correlation between the orientation and geometry of the molecule and the spectral features. Understanding of the water/vapor interfacial structure should remain as chal-lenging as to the theorists. It is also important to discuss how the spectrum relates to the interfacial water species.
We would like to treat this problem with a quantum chemical approach based on DAA, DDA, and DDAA con-figurations. By randomizing orientations and distances of the surrounding three or four molecules, the explicit, aver-aged dipole and polarizability derivatives of the center wa-ter molecule at each configuration could be calculated. The overall simulated SFG spectrum could reproduce detailed features quite well, and the arrangement of report is in the process.62
B. Applications to Dye-Sensitized Solar Cells
SFG has also been used to elucidate dye-TiO2
struc-ture of dye-sensitized solar cells (DSSCs) at the inter-face.63-69Combined both the dye-adsorption geometry in-formation from SFG spectroscopy and the electron transfer dynamics information from ultrafast transient absorption spectroscopy, experimental scientists are able to obtain the detailed information of the correlation between the sen-sitizer adsorption geometry, electron injection/recombina-tion dynamics, and solar cell performance. For example, to determine whether the electron transfer rates are strongly dependent on spacer and sensitization conditions at molec-ular level, Ye and coworkers69have first applied SFG to the study of the adsorption geometries of the Zn-porphyrin (ZnP) derivatives on the TiO2surface and found that the
“through-space” rather than “through the molecular spacer” and the sensitization solvent may affect adsorption geometry and adsorption ordering through co-adsorption and modify the electron transfer dynamics and consequently solar cell effi-ciency.
C. Applications to Biosciences
Since 1996, Vogel demonstrated that the applications of optical harmonic generation and infrared-visible sum frequency generation (SFG) in the biosciences could yield surface specific information concerning, such as molecular adsorption and orientation, surface charges, interfacial hy-drogen bond networks, surface chirality, and membrane potentials under in situ conditions and with high surface sensitivity.70 SFG studies on biological interfaces have grown tremendously in recent years.71-92For example, us-ing this technique with the combination of the C-H and C=O stretching signals, Chen’s group have successfully determined the interfacial structures of membrane-bounded peptides and proteins such as magainin 2, melittin, alamethicin, and G-protein.75-80Yan’s group have characterized the sec-ondary structures ofa-helix, b-sheet, and random-coil at interfaces.81,82with 3300 cm-1N-H stretching signal in the SFG spectra, Ye and coworkers have used SFG to study the interfacial protein and peptide absorption.85-91With the ad-vantage of in situ detection, SFG can be used to character-ize low concentrations of different biomolecules such as lipids, peptides and proteins at various interfaces.93,94
SFG has been developed as a unique tool to study protein adsorption, which is an important process that oc-curs on biomedical device surfaces and to investigate ef-fects of protein solution pH and protein interfacial cover-age on protein interfacial structures.95-98Chen and cowork-ers have also applied SFG to study isotope labeled proteins for their adsorption for the first time.99Accompanied by the developing of the polarization mapping, SFG has also been used to study adsorption behavior of peptides, serving as a model for complicated interfacial proteins and poly-mers.86,87,89,100,101SFG has been proven to be powerful in monitoring the interaction of biomolecules and other small molecules with lipid membranes in situ.76-78,80,81,93,94,102-106 For example, SFG has been applied to investigate the mo-lecular behavior of a novel membrane-active antimicrobial arylamide oligomer 1,102and peptides such as melittin,76 alamethicin,80pexiganan (MSI-78),93cell penetrating pep-tide,94magainin 2,103MSI594,104tachyplesin I,105and amy-loid polypeptide81,106 in model cell membranes. Recent studies on the peptide alamethicin indicated that when an
a-helix connects to a 310-helix, the 310-helix itself and that
connecting to ana-helix may contribute two peaks cen-tered at 1635 cm-1and 1670 cm-1.78,80It is also possible to use SFG to analyze the interaction of large molecules such as proteins with lipids.77DNA has also been extensively studied by using SFG. These studies have shown that SFG can provide important structural information of DNA strands at different biological surfaces or interfaces in
situ.107-113Wurpel et al. investigated the DNA interaction with different lipids including 1,2-dipalmitoyl-3-trimethyl-ammonium propane (DPTAP), diC14-amidine and a zwit-terionic lipid 1,2-dipalmitoyl-sn-glycero-3-phosphocho-line (DPPC) in the presence and absence of calcium ion.108 Asanuma and coworkers recently investigated the impact of monovalent and divalent metal cations on 20-mer sin-gle-stranded DNA (ssDNA) and double-stranded DNA (dsDNA) covalently bound to silicon (111) surface using SFG.109Howell et al. chemically immobilized ssDNA on gold substrate via the thiol groups and studied the air–solid, phosphate buffer saline solution (PBS)–solid, and D2O–
solid interfaces.110Other SFG studies of DNA,111,112 in-cluding on platinum substrates have also been reported.113
Furthermore, recently time dependent SFG has been applied to study molecular kinetics and dynamics on vari-ous biomolecules such as peptides and lipids at interfaces. For example, SFG was applied in in situ studies of peptide and protein immobilization on surfaces,114-116protein ad-sorption such as fibrinogen to different polymers,685,117and to monitor the kinetics of flip-flop process.118-123The ki-netic studies of flip-flop showed that lipid flip-flop can be affected by chemical structural modifications of lipids119 and transmembrane peptides such as gramicidin A,120 WALP23 and melittin,121membrane lateral pressure,122as well as cholesterol.123SFG has also been used to study the time-dependent interactions between peptide and a DPPG bilayer such as melittin124and tachyplesin I.125These re-searches show time-dependent SFG is an ideal technique to study many biological interactions involving peptides/pro-teins and membrane lipid bilayers.
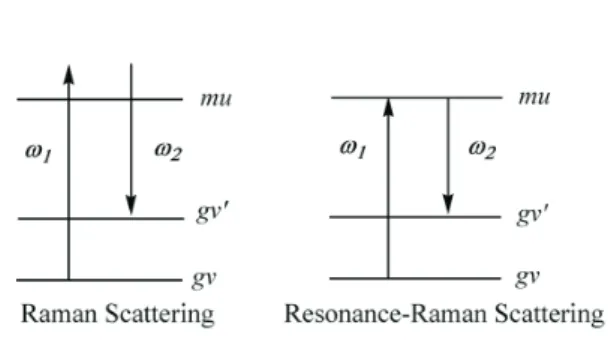
In concluding this paper, we can see that in view of the recent tremendous experimental activities of SFG, quantum chemical calculations of SFG spectra to analyze the experimental SFG spectra are badly needed. Finally, we shall discuss whether it is possible to use SFG as a sur-face-sensitive technique like SERS (surface-enhanced Raman Scattering). In SERS, it is believed to exist two en-hancements, physical one which is due to the electric field
enhancement resulting from the geometry of the nano-par-ticle causing the enhancement of the Raman scattering, and chemical one which is due to the creation of charge-transfer bands resulting from the interaction between surface-plasmon and excited electronic states of adsorbed mole-cules. These charge-transfer bands transform the original Raman spectra into the resonance Raman spectra (see Fig. 18). The similar situation exists for the surface-enhanced SFG. This can be seen from Figs. 2 and 5.
ACKNOWLEGEMENT
The authors wish to thank the National Science Coun-cil of Taiwan and National Chiao-Tung University for sup-porting this project.
REFERENCES
1. Hunt, J. H.; Guyot-Sionnest, P.; Shen, Y. R. Chem. Phys.
Lett. 1987, 133, 189.
2. Guyot-Sionnest, P.; Hunt, J. H.; Shen, Y. R. Phys. Rev.
Lett. 1987, 59, 1597.
3. Chen, Z.; Gracias, D. H.; Somorjai, G. A. Appl. Phys. B
1999, 68, 549.
4. Gracias, D. H.; Chen, Z.; Shen, Y. R.; Somorjai, G. A.
Acc. Chem. Res. 1999, 32, 930.
5. Briggman, K. A.; Stephenson, J. C.; Wallace, W. E.; Richter, L. J. J. Phys. Chem. B 2001, 105, 2785.
6. Gautam, K. S.; Schwab, A. D.; Dhinojwala, A.; Zhang, D.; Dougal, S. M.; Yeganeh, M. S. Phys. Rev. Lett. 2000,
85, 3854.
7. Chen, Z.; Ward, R.; Tian, Y.; Eppler, A. S.; Shen, Y. R.; Somorjai, G. A. J. Am. Chem. Soc. 2000, 122, 10615.
8. Chen, Z.; Ward, R.; Tian, Y.; Eppler, A. S.; Shen, Y. R.; Somorjai, G. A. J. Phys. Chem. B 1999, 103, 2935.
9. Wei, X.; Hong, S.-C.; Lvovsky, A. I.; Held, H.; Shen, Y. R. J. Phys. Chem. B 2000, 104, 3349.
10. Yamaguchi, S.; Tahara, T. J. Phys. Chem. B 2004, 108, 19079.
11. Yamaguchi, S.; Tahara, T. J. Chem. Phys. 2008, 129,
101102.
12. Mondal, S. K.; Yamaguchi, S.; Tahara, T. J. Phys. Chem.
C 2011, 115, 3083.
13. Watanabe, H.; Yamaguchi, S.; Sen, S.; Morita, A.; Tahara, T. J. Chem. Phys. 2010, 132, 144701.
14. Yamaguchi, S.; Bhattacharyya, K.; Tahara, T. J. Phys.
Chem. C 2011, 115, 4168.
15. Yamaguchi, S.; Kundu, A.; Sen, P.; Tahara, T. J. Chem.
Phys. 2012, 137, 151101.
16. Lin, S. H.; Alden, R.; Islampour, R.; Ma, H.; Villaeys, A. A. Density Matrix Method and Femtosecond
Pro-cesses; World Scientific: Singapore, 1991; p 6.
17. Hayashi, M.; Lin, S. H. In Advances in Multi-photon
Processes and Spectroscopy; Lin, S. H.; Villaeys, A. A.;
Fujimura, Y., Eds; World Scientific: Singapore, 2004; Vol. 16, pp 307-422.
18. Hayashi, M.; Lin, S. H.; Shen, Y. R. J. Phys. Chem. A
2004, 108, 8058.
19. Hayashi, M.; Lin, S. H.; Raschke, M. B.; Shen, Y. R. J.
Phys. Chem. A 2002, 106, 2271.
20. Raschke, M. B.; Hayashi, M.; Lin, S. H.; Shen, Y. R.
Chem. Phys. Lett. 2002, 359, 367.
21. Lin, S. H.; Hayashi, M.; Islampour, B.; Yu, J.; Yang, D. Y.; Wu, G. Y. C. Physica B 1996, 222, 191.
22. Liu, W.-K.; Hayashi, M.; Lin, J.-C.; Chang, H.-C.; Lin, S. H. J. Chem. Phys. 1997, 106, 5920.
23. Hayashi, M.; Shiu, Y.-J.; Liang, K. K.; Lin, S. H.; Shen, Y. R. J. Phys. Chem. A 2007, 111, 9062.
24. Heitler, W. The Quantum Theory of Radiation; Oxford University Press: London, 1953.
25. Shen, Y. R.; Ostroverkhov, V. Chem. Rev. 2006, 106,
1140.
26. Superfine, R.; Huang, J. Y.; Shen, Y. R. Chem. Phys.
Lett. 1990, 172, 303.
27. Superfine, R.; Huang, J. Y.; Shen, Y. R. Opt. Lett. 1990,
15, 1276.
28. Ostroverkhov, V.; Waychunas, G. A.; Shen, Y. R. Phys.
Rev. Lett. 2005, 94, 046102.
29. Tian, C.-S. et al. to be published, 2013.
30. Lin, C.-K.; Shih, C.-C.; Niu, Y. L.; Tsai, M.-Y.; Shiu, Y.-J.; Zhu, C. Y.; Hayashi, M.; Lin, S. H. J. Phys. Chem.
C 2013, 117, 1754.
31. Moad, J.; Simpson, G. J. J. Phys. Chem. B 2004, 108,
3548.
32. Wei, X.; Miranda, P. B.; Zhang, C.; Shen, Y. R. Phys.
Rev. B 2002, 66, 085401.
33. Zhuang, X.; Miranda, P. B.; Kim, D.; Shen, Y. R. Phys.
Rev. B 1999, 59, 12632.
34. Faraday, M. Athenaeum 1850, 1181, 640; Philos. Mag.
1859, 17, 162; Proc. Roy. Soc. London 1860, 10, 440.
35. Fletcher, N. H. Philos. Mag. 1968, 18, 1287.
36. Wei, X.; Miranda, P. B.; Zhang, C.; Shen, Y. R. Phys.
Rev. B 2002, 66, 085401.
Fig. 18. Energy level diagram for Raman scattering and Resonance-Raman scattering.
37. Du, Q.; Superfine, R.; Freysz, E.; Shen, Y. R. Phys. Rev.
Lett. 1993, 70, 2313.
38. Baldelli, S.; Schnitzer, C.; Shultz, M. J.; Campbell, D. J.
J. Phys. Chem. B 1997, 101, 10435.
39. Gan, W.; Wu, D.; Zhang, Z.; Feng, R. R.; Wang, H. F. J.
Chem. Phys. 2006, 124, 114705.
40. Liu, D. F.; Ma, G.; Levering, L. M.; Allen, H. C. J. Phys.
Chem. B 2004, 108, 2252.
41. Scatena, L. F.; Brown, M. G.; Richmond, G. L. Science
2001, 292, 908.
42. Wei, X.; Shen, Y. R. Phys. Rev. Lett. 2001, 86, 4799. 43. Sovago, M.; Campen, R. K.; Wurpel, G. W. H.; Muller,
M.; Bakker, H. J.; Bonn, M. Phys. Rev. Lett. 2008, 100, 173901.
44. Nihonyanagi, S.; Ishiyama, T.; Lee, T.-K.; Yamaguchi, S.; Bonn, M.; Morita, A.; Tahara, T. J. Am. Chem. Soc.
2011, 133, 16875.
45. Du, Q.; Freysz, E.; Shen, Y. R. Science 1994, 264, 826. 46. Ji, N.; Ostroverkhov, V.; Tian, C. S.; Shen, Y. R. Phys.
Rev. Lett. 2008, 100, 096102.
47. Tian, C.-S.; Shen, Y. R. J. Am. Chem. Soc. 2009, 131,
2790.
48. Shultz, M. J.; Baldelli, S.; Schnitzer, C.; Simonelli, D. J.
Phys. Chem. B 2002, 106, 5313.
49. Raymond, E. A.; Tarbuck, T. L.; Richmond, G. L. J.
Phys. Chem. B 2002, 106, 2817.
50. Raymond, E. A.; Tarbuck, T. L.; Brown, M. G.; Rich-mond, G. L. J. Phys. Chem. B 2003, 107, 546.
51. Allen, H. C.; Raymond, E. A.; Richmond, G. L. J. Phys.
Chem. A 2001, 105, 1649.
52. Brown, M. G.; Raymond, E. A.; Allen, H. C.; Scatena, L. F.; Richmond, G. L. J. Phys. Chem. A 2000, 104, 10220.
53. Gan, W.; Wu, D.; Zhang, Z.; Guo, Y.; Wang, H. F. Chin.
J. Chem. Phys. 2006, 19, 20.
54. Levering, L. M.; Sierra-Hernandez, M. R.; Allen, H. C.
J. Phys. Chem. C 2007, 111, 8814.
55. Morita, A.; Ishiyama, T. Phys. Chem. Chem. Phys.
2008, 10, 5801.
56. Morita, A.; Hynes, J. T. Chem. Phys. 2000, 258, 371. 57. Ji, N.; Ostroverkhov, V.; Chen, C. Y.; Shen, Y. R. J. Am.
Chem. Soc. 2007, 129. 10056.
58. Tian, C. S.; Ji, N.; Waychunas, G. A.; Shen, Y. R. J. Am.
Chem. Soc. 2008, 130, 13033.
59. Tian, C. S.; Shen, Y. R. Phys. Rev. Lett. 2008, 101,
139401.
60. Pieniazek, P. A.; Tainter, C. J.; Skinner, J. L. J. Am.
Chem. Soc. 2011, 133, 10360.
61. Sulpizi, M.; Salanne, M.; Sprik, M.; Gaigeot, M.-P. J.
Phys. Chem. Lett. 2013, 4, 83.
62. Hayashi, M. et al., to be published, 2013.
63. Wang, C.; Groenzin, H.; Shultz, M. J. J. Phys. Chem. B
2004, 108, 265.
64. Wang, C.; Groenzin, H.; Shultz, M. J. J. Am. Chem. Soc.
2005, 127, 9736.
65. Uosaki, K.; Yano, T.; Nihonyanagi, S. J. Phys. Chem. B
2004, 108, 19086.
66. Aliaga, C.; Baldelli, S.; Sum, A. J. Phys. Chem. C 2008,
112, 3064.
67. Miyamae, T.; Nozoye, H. J. Photochem. Photobiol.
2001, 145, 93.
68. Kataoka, S.; Gurau, M. C.; Albertorio, F.; Holden, M.; Lim, S.-M.; Yang, R.; Cremer, P. Langmuir 2004, 20, 1662.
69. Ye, S.; Kathiravan, A.; Hayashi, H.; Tong, Y.; Infahsaeng, Y.; Chabera, P.; Pascher, T.; Yartsev, A. P.; Isoda, S.; Imahori, H.; and Sundström, V. J. Phys. Chem. C 2013,
117, 6066.
70. Vogel, V. Curr. Opin. Colloid Interface Sci. 1996, 1,
257.
71. Castellana, E. T.; Cremer, P. S. Surf. Sci. Rep. 2006, 61,
429.
72. Lambert, A. G.; Davies, P. B.; Neivandt, D. J. Appl.
Spectrosc. Rev. 2005, 40, 103.
73. Gopalakrishnan, S.; Liu, D. F.; Allen, H. C.; Kuo, M.; Shultz, M. J. Chem. Rev. 2006, 106, 1155.
74. Wang, H. F.; Gan, W.; Lu, R.; Rao, Y.; Wu, B. H. Int.
Rev. Phys. Chem. 2005, 24, 191.
75. Ye, S. J.; Nguyen, K. T.; Le Clair, S.; Chen, Z. J. Struct.
Biol. 2009, 168, 61.
76. Chen, X.; Wang, J.; Boughton, A. P.; Kristalyn, C. B.; Chen, Z. J. Am. Chem. Soc. 2007, 129, 1420.
77. Nguyen, K. T.; Le Clair, S.; Ye, S. J.; Chen, Z. J. Phys.
Chem. B 2009, 113, 12169.
78. Ye, S. J.; Nguyen, K. T.; Chen, Z. J. Phys. Chem. B
2010, 114, 3334.
79. Chen, X.; Boughton, A. P.; Tesmer, J. J. G.; Chen, Z. J.
Am. Chem. Soc. 2007, 129, 12658.
80. Ye, S. J.; Li, H. C.; Wei, F.; Jasensky, J.; Boughton, A. P.; Yang, P.; Chen, Z. J. Am. Chem. Soc. 2012, 134, 6237.
81. Fu, L.; Ma, G.; Yan, E. C. Y. J. Am. Chem. Soc. 2010,
132, 5405.
82. Fu, L.; Liu, J.; Yan, E. C. Y. J. Am. Chem. Soc. 2011,
133, 8094.
83. Perry, J. M.; Moad, A. J.; Begue, N. J.; Wampler, R. D.; Simpson, G. J. J. Phys. Chem. B 2005, 109, 20009.
84. Liu, C.; Monson, C. F.; Yang, T.; Pace, H.; Cremer, P. S.
Anal. Chem. 2011, 83, 7876.
85. Clarke, M. L.; Wang, J.; Chen, Z. J. Phys. Chem. B
2005, 109, 22027.
86. Phillips, D. C.; York, R. L.; Mermut, O.; McCrea, K. R.; Ward, R. S.; Somorjai, G. A. J. Phys. Chem. C 2007, 111, 255.
Ward, R. S.; Somorjai, G. A. J. Phys. Chem. C 2007, 111, 8866.
88. Jung, S.-Y.; Lim, S.-M.; Albertorio, F.; Kim, G.; Gurau, M. C.; Yang, R. D.; Holden, M. A.; Cremer, P. S. J. Am.
Chem. Soc. 2003, 125, 12782.
89. Mermut, O.; Phillips, D. C.; York, R. L.; McCrea, K. R.; Ward, R. S.; Somorjai, G. A. J. Am. Chem. Soc. 2006,
128, 3598.
90. Weidner, T.; Breen, N. F.; Drobny, G. P.; Castner, D. G. J.
Phy. Chem. B 2009, 113, 15423.
91. Li, H.; Ye, S.; Wei, F.; Ma, S.; Luo, Y. Langmuir 2012,
28, 16979.
92. Wang, J.; Mark, A.; Chen, X.; Schmaier, A. H.; Waite, J. H.; and Chen, Z. J. Am. Chem. Soc. 2003, 125, 9914.
93. Yang, P.; Ramamoorthy, A.; Chen, Z. Langmuir 2011,
27, 7760.
94. Ding, B.; Chen, Z. J. Phys. Chem. B 2012, 116, 2545.
95. Wang, J.; Buck, S. M.; Mark, A.; Chen, Z. J. Am. Chem.
Soc. 2002, 124, 13302.
96. Wang, J.; Buck, S. M.; Chen, Z. J. Phys. Chem. B 2002,
106, 11666.
97. Wang, J.; Paszti, Z.; Mark, A.; Chen, Z. J. Phys. Chem.
B 2004, 108, 3625.
98. Wang, J.; Buck, S. M.; Chen, Z. Analyst 2003, 128, 773.
99. Wang, J.; Clarke, M. L.; Zhang, Y.; Chen, X.; Chen, Z.
Langmuir 2003, 19, 7862.
100. Wang, J.; Clarke, M. L.; Chen, Z. Anal. Chem. 2004, 76,
2159.
101. York, R. L.; Holinga, G. J.; Somorjai, G. A. Langmuir
2009, 25, 9369.
102. Chen, X.; Tang, H.; Mark, A.; Wang, J.; Tew, G. N.; Chen, Z. J. Am. Chem. Soc. 2006, 128, 2711.
103. Nguyen, K. T.; Le Clair, S. V.; Ye, S.; Chen, Z. J. Phys.
Chem. B 2009, 113, 12358.
104. Chen, X.; Wang, J.; Sniadecki, J. J.; Mark, A.; Chen, Z.
Langmuir 2005, 21, 2662.
105. Nguyen, K. T.; King, J. T.; Chen, Z. J. Phys. Chem. B
2010, 114, 8291.
106. Xiao, D.; Fu, L.; Liu, J.; Batista, V. S.; Yan, E. C. Y. J.
Mol. Biol. 2011, 421, 537.
107. Wurpel, G. W. H.; Sovago, M.; Bonn, M. J. Am. Chem.
Soc. 2007, 129, 8420.
108. Campen, R. K.; Ngo, T. T. M.; Sovago, M.; Ruysschaert, J. M.; Bonn, M. J. Am. Chem. Soc. 2010, 132, 8037.
109. Asanuma, H.; Noguchi, H.; Uosaki, K.; Yu, H. Z. J. Am.
Chem. Soc. 2008, 130, 8016.
110. Howell, C.; Schmidt, R.; Kurz, V.; Koelsch, P.
Bio-interphases 2008, 3, FC47.
111. Stokes, G. Y.; Gibbs-Davis, J. M.; Boman, F. C.; Stepp, B. R.; Condie, A. G.; Nguyen, S. B. T.; Geiger, F. M. J.
Am. Chem. Soc. 2007, 129, 7492.
112. Walter, S. R.; Geiger, F. M. J. Phys. Chem. Lett. 2009, 1, 9.
113. Sartenaer, Y.; Tourillon, G.; Dreesen, L.; Lis, D.; Mani, A. A.; Thiry, P. A.; Peremans, A. Biosens. Bioelectron.
2007, 22, 2179.
114. Baugh, L.; Weidner, T.; Baio, J.; Nguyen, P. C. T.; Gam-ble, L. J.; Stayton, P. S.; Castner, D. G. Langmuir 2010,
26, 16434.
115. Ye, S.; Nguyen, K. T.; Boughton, A. P.; Mello, C. M.; Chen, Z. Langmuir 2009, 26, 6471.
116. Han, X.; Soblosky, L.; Slutsky, M.; Mello, C. M.; Chen, Z. Langmuir 2011, 27, 7042.
117. Wang, J.; Chen, X.; Clarke, M. L.; Chen, Z. J. Phys.
Chem. B 2006, 110, 5017.
118. Liu, J.; Conboy, J. C. J. Am. Chem. Soc. 2004, 126,
8376.
119. Liu, J.; Conboy, J. C. Biophys. J. 2005, 89, 2522. 120. Anglin, T. C.; Liu, J.; Conboy, J. C. Biophys. J. 2007,
92, L01.
121. Anglin, T. C.; Brown, K. L.; Conboy, J. C. J. Struct.
Biol. 2009, 168, 37.
122. Anglin, T. C.; Conboy, J. C. Biophys. J. 2008, 95, 186. 123. Liu, J.; Brown, K. L.; Conboy, J. Faraday Discuss.
2013, 161, 45.
124. Chen, X.; Wang, J.; Kristalyn, C. B.; Chen, Z. Biophys.
J. 2007, 93, 866.
125. Chen, X.; Chen, Z. Biochim. Biophys. Acta Biomembr.