中國出口結構變化對中國與歐盟經濟關係的影響 - 政大學術集成
120
0
0
全文
(2) 國立政治大學亞太研究英語碩士學位學程 International Master’s Program in Asia-Pacific Studies College of Social Sciences National Chengchi University 碩士論文 Master’s Thesis. 政 治 大. 立 中國出口結構變化對中國與歐盟經濟關係的影響. ‧ 國. 學. The Impact of the Change in China’s Export Structure on the EU-China Economic Relations. ‧. n. er. io. sit. y. Nat. Student: Marlène Dorsy a l Advisor: Alex Chiang v ni. Ch. engchi U. 中華民國 103 年 06 月 June 2014. i.
(3) 中國出口結構變化對中國與歐盟經濟關係的影響 The Impact of the Change in China’s Export Structure on the EU-China Economic Relations 研究生:杜若琳 指導教授:姜家雄. Student: Marlène Dorsy Advisor: Alex Chiang. 國立政治大學 亞太研究英語碩士學位學程. 立. 治 政碩士論文 大. ‧ 國. 學 ‧. A Thesis. er. io. al. Studies. sit. y. Nat. Submitted to International Master’s Program in Asia-Pacific. n. v i n C h Chengchi University National engchi U. In partial fulfillment of the Requirement For the degree of Master in China Studies. 中華民國 103 年 06 月 June 2014. ii.
(4) ACKNOWLEDGMENT. I would like to thank my advisor, Professor Alex Chiang, for trusting in me, giving me his support and advises. I would also like to thank the other committee members, Professors Wen-yang Chang and Eric Chiou, for their enthusiasm, encouragement and advises. My friends and classmates also offered me precious support. I would like to thank Retno Widyastuti for her inexhaustible motivation and encouragements during. 政 治 大. these two years, Jérôme Hernád with whom I shared these stressful last few months. 立. and Emilien Lee who helped me with the translation of the abstract.. ‧ 國. 學. Finally, I would like to thank my family who supported me during my studies,. ‧. as well as my friends, Pauline Planchais and Claire Theude, who encouraged me from. n. al. er. io. sit. y. Nat. the other side of the world.. Ch. engchi. iii. i n U. v.
(5) Abstract. The economic relations between China and Europe have increased dramatically, especially since the 2000’s. Although trade started slowly, the European Union has become China’s number one trading partner, ahead of Japan and the US, since 2004 and China is now the EU’s second largest trading partner after the US. This status of “partnership” is based on a great complementarity between the two sides, which enabled them to expand their trade continuously.. 政 治 大. However, in the recent years, China’s export structure has started to. 立. evolve and become increasingly technology-intensive. Indeed, its export. 學. ‧ 國. structure is becoming quite similar to that of Europe, exporting traditionally Western EU products, such as capital goods and. ‧. transportation equipment.. Nat. sit. y. While some focused on the competition China represents for Europe,. er. io. entering Europe’s traditional export markets, this paper analyzes the. n. impact of the change on the EU-China a in China’s export structure v economic relations.. i l C n hengchi U. To do so, I first used a linear regression model to analyze the impact of the change in China’s export structure on the EU-China economic relations and then performed a qualitative analysis, as well as, literature review to understand how these changes affect disputes and cooperation between the EU and China. I found that the change in China’s export structure did not have any direct bad impact on the EU-China economic relations. However, it led to protectionism and disputes which were in part responsible for the deterioration of the EU-China economic relations. Keywords: China, EU, export structure, economic relations iv.
(6) 摘要. 自 2000 年開始,中國和歐洲之間的經濟關係有顯著提升。在這期間 儘管貿易緩慢地發展,對於中國來說,歐盟從 2004 年起取代了美國 和日本的領先成為中國第一大的貿易夥伴,而中國對於歐洲來說目 前是僅次於美國的第二大貿易對象。而夥伴關係的是基於兩方之間 的貿易互補性,進而不斷地持續擴大。. 政 治 大 證明中國的出口結構和歐洲已有相當程度的類似,例如一些資本貨 立 然而最近幾年,中國的出口結構已朝向技術密集的層面發展,事實. ‧ 國. 學. 物和運輸設備。儘管部分的研究是針對歐洲和中國的貿易競爭性, 此篇文章針對了歐洲和中國之間因出口結構改變所造成的影響。. ‧. 為了分析出口結構所帶來的影響,首先透過線性回歸模型分析。再. Nat. sit. y. 配合定性分析和文獻的輔助了解這些變化是如何影響到兩方之間的. er. io. 經濟合作和糾紛。. al. n. v i n 經過分析發現,中國出口結構的變化並不會對兩方的經濟貿易關係 Ch engchi U 有任何直接的不良影響,但卻導致了保護主義的開始、引發了部分 爭端,進而影響到兩方之間的經濟關係惡化。. 關鍵字:中國、歐盟、出口結構、經濟關係. v.
(7) TABLE OF CONTENTS 1. Introduction ........................................................................... 1 1.1 Background ..................................................................................................................... 1 1.2 Motivations and Objectives ............................................................................................. 2 1.3 Research Question............................................................................................................ 3 1.4 Methodology .................................................................................................................... 4 1.5 Chapters and Framework ................................................................................................. 6. 2. Literature Review ................................................................... 7 2.1 Trade Theories ................................................................................................................. 7. 政 治 大 2.4 Disputes between the 立EU and China.............................................................................. 16. 2.2 Trade and Investments between the EU and China ......................................................... 8 2.3 Economic Cooperation between the EU and China ....................................................... 12. ‧ 國. 學. 2.5 Other factors affecting the EU-China Economic Relations ........................................... 19. 3. Impact on Trade and Investments...................................... 21. ‧. 3.1 Impact on Trade ............................................................................................................. 21. 3.1.1 Impact on Chinese Exports to the EU.......................................................... 21. sit. y. Nat. 3.1.2 Impact on Chinese Imports from the EU ..................................................... 25 3.1.3 Complementarity between the EU’s and China’s exports ........................... 29. io. er. 3.1.3.1 General trade structure ..................................................................................... 30. al. n. v i n C U inedible, and related materials 3.1.3.3 Complementarity inhSector e n 2:gCrude c h imaterials,. 3.1.3.2 Complementarity in Sectors 0 and 1: Food, live animals, beverage, tobacco.. 32 ...................................................................................................................................... 34 3.1.3.4 Complementarity in Sector 5: Chemicals and related products ....................... 35 3.1.3.5 Complementarity in Sector 6: Manufactured goods classified chiefly by material ........................................................................................................................ 36 3.1.3.6 Complementarity in Sector 7: Machinery and transport equipment ................ 37 3.1.3.7 Complementarity in Sector 8: Manufactured articles ...................................... 39 3.1.3.8 Complementarity by technology and skill level............................................... 40 3.1.3.9 Processing trade ............................................................................................... 45 3.2 Impact on investments ................................................................................................... 46. 4. Impact on Disputes and Cooperation ................................. 50 4.1 Impact on Disputes........................................................................................................ 50. 4.1.1 WTO dispute cases between the EU and China .......................................... 50 vi.
(8) 4.1.2 Dumping and Anti-Dumping ....................................................................... 54 4.1.3 People’s Opinion ......................................................................................... 58 4.2 Impact on Cooperation ................................................................................................... 60. 4.2.1 EU-China Cooperation Structure................................................................. 60 4.2.2 Evolution of the EU-China Relations through Summit Joint Communiqués .............................................................................................................................. 64 4.2.3 Agreements and Cooperation ...................................................................... 67 4.2.4 Signs of improvements in the EU-China Cooperation ................................ 69. 5. Concluding Remarks ........................................................... 73 5.1 The Experience of the US-Japan Economic Relations................................................... 74 5.2 Policy Recommendations............................................................................................... 78. Bibliography.............................................................................. 79 治. 政. 大 Appendix ................................................................................... 85 立 ‧. ‧ 國. 學. n. er. io. sit. y. Nat. al. Ch. engchi. vii. i n U. v.
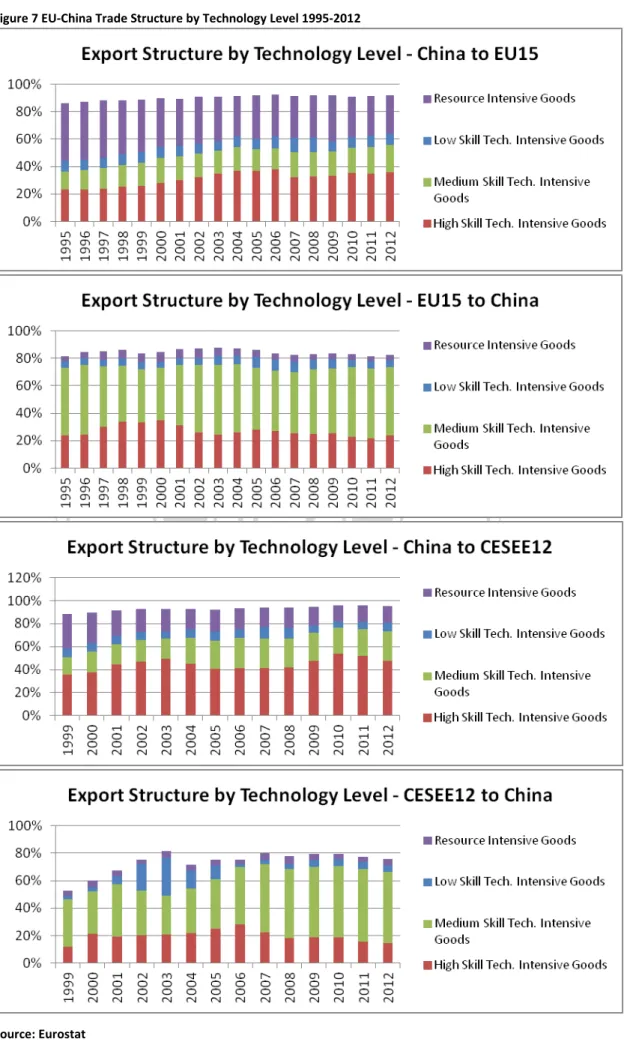
(9) List of Figures. Figure 1 Correlation Between the Variation in China’s Export Structure to the world and the Variation in China's Export Structure to the EU-15................................................................. 23 Figure 2 Correlation Between the Variation in China’s Export Structure to the world and the Variation in China's Export Structure to CESEE-12................................................................ 24 Figure 3 Correlation Between the Variation in China’s Export Structure to the world and the Variation in China's Import Structure from EU-15 .................................................................. 27 Figure 4 Correlation Between the Variation in China’s Export Structure to the world and the Variation in China's Import Structure from CESEE-12 ........................................................... 28 Figure 5 EU15-China Trade Structure 1995-2012 .................................................................. 30 Figure 6 CESEE12-China Trade Structure 1999-2012 ........................................................... 31 Figure 7 EU-China Trade Structure by Technology Level 1995-2012 .................................... 42 Figure 8 European AD/Subsidy Investigations against China 1995-2013 .............................. 56 Figure 9 On Going European AD/Subsidy measures against China 1995-2013 .................... 56 Figure 10 On Going AD Measures against the EU 1995-2013............................................... 57 Figure 11 EU-China Cooperation Structure............................................................................ 61. 立. 政 治 大. ‧ 國. 學. List of Tables. ‧. Nat. y. sit. n. al. er. io. Table 1 Association Between the Change in China's Export Structure to the World and the Change in China's Export Structure to the EU......................................................................... 22 Table 2 Association Between the Change in China's Export Structure to the World and the Change in China's Import Structure from the EU .................................................................... 26 Table 3 Association Between the Change in China’s Export Structure to the World and the Change in Chinese Investments in the EU ............................................................................... 47 Table 4 Association Between the Change in China’s Export Structure to the World and the Change in European Investments in China .............................................................................. 48 Table 5 Agreements Between the EU and China from 1995* to 2014 .................................... 68. Ch. engchi. viii. i n U. v.
(10) List of Appendixes Appendix 1 Change in China's Exports and Imports compared to (a)1995 or (b)1999 for all SITC Sectors, 1996-2012 ......................................................................................................... 85 Appendix 2 Change in China's Exports and Imports compared to (a)1995 or (b)1999 for Sector 0, 1996-2012 ................................................................................................................. 86 Appendix 3 Change in China's Exports and Imports compared to (a)1995 or (b)1999 for Sector 1, 1996-2012 ................................................................................................................. 86 Appendix 4 Change in China's Exports and Imports compared to (a)1995 or (b)1999 for Sector 2, 1996-2012 ................................................................................................................. 87 Appendix 5 Change in China's Exports and Imports compared to (a)1995 or (b)1999 for Sector 3, 1996-2012 ................................................................................................................. 87 Appendix 6 Change in China's Exports and Imports compared to (a)1995 or (b)1999 for Sector 4, 1996-2012 ................................................................................................................. 88 Appendix 7 Change in China's Exports and Imports compared to (a)1995 or (b)1999 for Sector 5, 1996-2012 ................................................................................................................. 88 Appendix 8 Change in China's Exports and Imports compared to (a)1995 or (b)1999 for Sector 6, 1996-2012 ................................................................................................................. 89 Appendix 9 Change in China's Exports and Imports compared to (a)1995 or (b)1999 for Sector 7, 1996-2012 ................................................................................................................. 89 Appendix 10 Change in China's Exports and Imports compared to (a)1995 or (b)1999 for Sector 8, 1996-2012 ................................................................................................................. 90 Appendix 11 Change in China's Exports and Imports compared to (a)1995 or (b)1999 for Sector 9, 1996-2012 ................................................................................................................. 90 Appendix 12 EU-China Trade Structure of Sectors 0 & 1 1995-2012 ................................... 91 Appendix 13 EU-China Trade Structure of Sector 2 1995-2012 ............................................ 92 Appendix 14 EU-China Trade Structure of Sector 5 1995-2012 ............................................ 93 Appendix 15 EU-China Trade Structure of Sector 6 1995-2012 ............................................ 94 Appendix 16 EU-China Trade Structure of Sector 7 1995-2012 ............................................ 95 Appendix 17 EU-China Trade Structure of Sector 8 1995-2012 ............................................ 96 Appendix 18 EU-China Trade Structure by Technology Level Sector 6 1995-2012 ............. 97 Appendix 19 EU-China Trade Structure by Technology Level Sector 7 1995-2012 ............. 98 Appendix 20 EU-China Trade Structure by Technology Level Sector 8 1995-2012 ............. 99 ppendix 21 Share of Capital and Consumer Goods in EU-China Trade 1995-2012 ............ 100 Appendix 22 Change in China's Exports to the World and Investments with the EU compared to 2005 for all Investments, 2006-2011 ................................................................................. 101 Appendix 23 Change in China's Exports to the World and Investments with the EU compared to 2005 for Investments in Agriculture, Forestry & Fishing, 2006-2011 .............................. 101 Appendix 24 Change in China's Exports to the World and Investments with the EU compared to 2005 for Investments in Mining & Quarrying, 2006-2011 ................................................ 101 Appendix 25 Change in China's Exports to the World and Investments with the EU compared to 2005 for Investments in Manufacture of Food Products, Beverages & Tobacco Products, 2006-2011 .............................................................................................................................. 102 Appendix 26 Change in China's Exports to the World and Investments with the EU compared to 2005 for Investments in Manufacture of Textiles & Wearing Apparel, 2006-2011 .......... 102. 立. 政 治 大. ‧. ‧ 國. 學. n. er. io. sit. y. Nat. al. Ch. engchi. ix. i n U. v.
(11) Appendix 27 Change in China's Exports to the World and Investments with the EU compared to 2005 for Investments in Manufacture of Wood, Paper, Printing & Reproduction, 2006-2011 ............................................................................................................................................... 102 Appendix 28 Change in China's Exports to the World and Investments with the EU compared to 2005 for Investments in Manufacture of Petroleum, Chemical, Pharmaceutical, Rubber and Plastic Products, 2006-2011 ................................................................................................... 103 Appendix 29 Change in China's Exports to the World and Investments with the EU compared to 2005 for Investments in Manufacture of Basis Metals & Fabricated Metal Products, except Machinery & Equipment, 2006-2011 .................................................................................... 103 Appendix 30 Change in China's Exports to the World and Investments with the EU compared to 2005 for Investments in Manufacture of Computer, Electronic & Optical Products, 20062011........................................................................................................................................ 104 Appendix 31 Change in China's Exports to the World and Investments with the EU compared to 2005 for Investments in Manufacture of Machinery & Equipment n.e.c., 2006-2011 ...... 104 Appendix 32 Change in China's Exports to the World and Investments with the EU compared to 2005 for Investments in Manufacture of Motor Vehicles, Trailers, Semi-trailers & of other Transport Equipment, 2006-2011 .......................................................................................... 105 Appendix 33 Correlation Between the variation in China's Export Structure to the World and EU-15’s Investments in China ............................................................................................... 106 Appendix 34 Correlation Between the variation in China's Export Structure to the World and CESEE-12’s Investments in China ........................................................................................ 107 Appendix 35 Correlation Between the variation in China's Export Structure to the World and Chinese Investments in EU-15 ............................................................................................... 108 Appendix 36 Correlation Between the variation in China's Export Structure to the World and Chinese Investments in CESEE-12 ........................................................................................ 109. 立. 政 治 大. ‧. ‧ 國. 學. n. er. io. sit. y. Nat. al. Ch. engchi. x. i n U. v.
(12) 1. Introduction. 1.1 Background. China and the European Union attach a great importance to their economic relationship. Indeed, since their first trade agreement in 1978, their relations have improved continuously and reached comprehensive strategic partnership. Today, the EU is China’s biggest trading partner and China is the EU’s second one. Furthermore, their trade value topped the amount of €1 billion per day in 2012 1.. 政 治 大 This economic partnership was mainly driven by a great complementarity between the 立 two sides (Kong, 2012). However, China’s economic structure has changed. ‧ 國. 學. tremendously in the 2000s and has become increasingly specialized in the manufacture of high-tech products. This transition was reflected in its export structure. ‧. which upgraded accordingly. In 1995, Chinese exports were dominated by labor and resource intensive goods which represented 36% of total exports, while high-skill and. y. Nat. sit. technology-intensive manufactures represented only 20%. In 2002, high-tech products. er. io. overtook labor-intensive goods and in 2012, they reached 38% of total exports. On the. al. v. n. other hand, labor-intensive goods dropped to 22%, under medium-skill and. i n . technology-intensive manufactures C h which reach 25% engchi U 2. Furthermore, China used to export principally miscellaneous manufactured products, which stood for 36% of its total exports in 1995, followed by manufactured goods and machinery and transport equipment, both around 21%. However today, China’s exports are largely dominated by machinery and transport equipment, with 47%, while miscellaneous manufactured products and manufactured goods are respectfully falling to 26% and 16% of total exports 3. Thus, China’s export structure is growing similar to the EU’s, which exports 30% of medium-skill and technology-intensive manufactures and 27% of high-skill and 1. China. Retrieved March 8, 2014, from European Commission: http://ec.europa.eu/trade/policy/countries-and-regions/countries/china/ 2 Data from UNCTAD http://unctadstat.unctad.org/ReportFolders/reportFolders.aspx 3 Ibid. 1.
(13) technology-intensive goods. Moreover, EU’s exports are also dominated by machinery and transport equipment 4. On the other hand, the economic cooperation between the EU and China has also undergone important changes in the recent years. Indeed, despite a promising start marked by the upgrade of the 1978 agreement with the Trade and Economic Cooperation Agreement in 1985 and followed by numerous communications from the European Commission and one paper from the Chinese government (A Long Term Policy for China EU Relations, 1995; Building a Comprehensive Partnership with China, 1998; EU Strategy Towards China: Implementation of the 1998 Communication and Future Steps for a more Effective EU Policy, 2001; A Maturing Partnership – Shared Interests and Challenges in EU-China Relations, 2003; China’s. 政 治 大 of disappointments from 立the two sides (Shambaugh, 2007; Andreosso - O' Callaghan. EU Policy, 2003), the relations started to cool down in 2006 due to the accumulation. & Nicolas, 2007; Fraser, 2009).. ‧ 國. 學. Many dialogues have been founded over the years, such as the EU-China Annual. ‧. Summit in 1998, the sectoral dialogues in the late 1990s and early 2000s and the EUChina High Level Economic and Trade Dialogue in 2008, each aiming at solving. Nat. sit. y. disputes and improving cooperation between China and the EU. However, it seems. io. er. that it is still not enough to resolve issues over Anti-Dumping measure, Intellectual Property Rights or Market Economy Status (Filippini, 2009; Tian, 2013).. al. n. v i n C hbetween China andUthe EU is rising progressively and As a consequence, competition engchi. China is increasingly perceived as a threat to the EU (Benkovskis, Silgoner, Steiner, & Wörz, 2013). Hence, the way they handle this transition phase will be decisive for their future economic cooperation.. 1.2 Motivations and Objectives. China and the EU are two of the three leading traders in the world 5 which makes their economic relations one of the most important. Of course, the third one is the US and 4. Data from UNCTAD http://unctadstat.unctad.org/ReportFolders/reportFolders.aspx 2.
(14) the US-China economic relations surely deserve attention too. However, as Men (2007) explains, the Sino-US relations are already much more centered on competition than cooperation, which is a major difference with the Sino-EU relations. Nevertheless, things may be changing. The objective of this thesis is to assess the impact of the change in China’s export structure on the EU-China economic relations. Indeed, the increasing competition in the EU traditional markets has already been proven, but very little was said about consequences on trade and the economic relations between the EU and China (Andreosso - O' Callaghan & Nicolas, 2007; Holslag, 2007; Filippini, 2009; Benkovskis, Silgoner, Steiner, & Wörz, 2013). Yet, as their relations are mainly based on the economic aspect (Freman, 2006), a negative impact on trade could not only. 政 治 大 political relations and cooperation 立 over security or environment issues.. affect their economic relations and create more disputes, but also dampen their. ‧ 國. 學. However, we should remember that the impact is not necessarily negative. Both sides could manage to keep some complementarity and use this opportunity to strengthen. ‧. their economic cooperation.. y. Nat. In either case, China’s export structure is bound to be increasingly dominated by. sit. technology intensive products. Hence today’s reactions from the EU and China will. n. al. er. io. set the pace for their future relations. This thesis will analyze their reactions and see which road they are taking.. Ch. engchi. i n U. v. 1.3 Research Question. As mentioned above, China and the EU’s relationship is mainly based on their economic relations (Freman, 2006). Indeed, it is the prospect of mutual economic benefits which led to two sides to establish a strategic partnership. This cooperation could be threatened by the upheaval of their economic interests. However, it is unclear to which extent the upgrade of China’s export structure is changing the situation.. 5. http://www.wto.org/english/res_e/statis_e/its2013_e/its2013_e.pdf 3.
(15) So, how does the change in China’s export structure affect its economic relations with the EU? One the one hand, do they manage to keep their complementarity or are they turning into competitors? On the other hand, are they strengthening their cooperation or intensifying their disputes?. 1.4 Methodology. This study will be in part quantitative and in part qualitative. Firstly, we will use linear regressions to analyze the impact of China’s upgrade on trade and investment in the. 政 治 大 variation in China’s export structure to the world and the variation in EU-China trade. 立 EU. To measure the impact on trade, we will analyze the correlation between the. The independent variable will be the change in China’s export structure to the world. ‧ 國. 學. between 1995 and 2012, using data from UNCTAD classified by SITC main sectors. The dependent variables will be the change in imports and exports structure with the. ‧. EU between 1995 and 2012, using data from Eurostat classified by SITC main sectors. sit. y. Nat. too.. io. er. Then, we will analyze the complementarity using descriptive statistics based on data from UNCTAD and Eurostat classified by SITC 3 digits, HS 4 digits and BEC,. n. al. between 1995 and 2012.. Ch. engchi. i n U. v. Finally, to measure the impact on investments between the EU and China, we will analyze the correlation between the variation in China’s export structure to the world and the variation in investments from the EU to China and China to the EU. The independent variable will be the change in China’s export structure to the world between 2005 and 2011, using data from UNCTAD classified by SITC 3 digits. The dependent variables will be the change in FDI flow from China to EU and from EU to China between 2005 and 2011 6, using data from Eurostat classified by NACE rev.1 until 2007 and NACE rev. 2 from 2008 to 2011 7.. 6 7. Only data available on Eurostat Data will be arranged at best to fit NACE rev. 2 4.
(16) The results will be displayed using scatterplots and r2 will be calculated to analyze the strength of the association. For each case, EU-15 and the 12 new members from Central and Eastern Europe will be analyzed separately because of their different economic structures. Secondly, we will use literature review to analyze the impact on cooperation and disputes between China and the EU. The literature review will be mainly based on reports from summits and dialogues provided by the EU and/or China, paper or articles from the European Commission and the Chinese Ministry of Commerce, newspaper articles and data from the World Trade Organization (WTO).. 立. 政 治 大. ‧. ‧ 國. 學. n. er. io. sit. y. Nat. al. Ch. engchi. 5. i n U. v.
(17) 1.5 Chapters and Framework. The Chapters will be divided as follows: Chapter I – Introduction. Upgrade of the Chinese Export Structure. -. Background. -. Research Question. -. Methodology. -. Chapters and Framework. Chapter II – Literature Review. -. Disputes between the EU and China. ‧ 國. -. 學. -. 治 政 Trade and Investments between the EU and大 China 立 Economic Cooperation between the EU and China. Chapter III – Impact on Trade and Investment. ‧. Trade Structure and Complementarity. Impact on Trade. -. Impact on Complementarity. -. Impact on Investments. sit. n. er. io. al. Investments. y. Nat. -. Ch. engchi. i n U. v. Chapter IV – Impact on Disputes and Cooperation -. Impact on Disputes. -. Impact on Cooperation. Disputes. Chapter V – Concluding Remarks. 6. Cooperation.
(18) 2. Literature Review. 2.1 Trade Theories. Many papers have been written on trade theories. The following authors provided significant contributions concerning inter- and intra-industry trade theories.. 治 政 theorem, i.e. the factor price equalization. This大 theory states that prices in two 立 different countries will be perfectly equalized if their factors of production can move First, Samuelson (1948) tested an important trade theory, the Ohlin-Heckscher. ‧ 國. 學. freely between the two of them. Another assumption was that the free mobility of. ‧. goods could be an alternative to the factors of production. However, according to. sit. y. Nat. Ohlin, in this case the equalization would be only partial. Nevertheless, Samuelson. io. er. (1948) found out that “On the contrary, not only is the factor-price equalization possible and probable, but in a wide variety of circumstances it is inevitable” (p.169).. n. al. Ch. engchi. i n U. v. Then, Balassa (1966) and Grubel (1967) both focused on intra-industry trade (IIT). Balassa (1966) proved that intensifying trade in consumer goods between developed countries would not affect their home production since it was rather easy to modify and diversify the products. Thus, the author concluded that “trade among the industrial countries is characterized by intraindustry rather than interindustry specialization” (p.472). Grubel (1967) also explained why IIT happened and provided a theoretical model predicting its development. Later, Krugman (1979) added researches on intra-industry trade and proved that “trade need not to be a result of international differences in technology or factor endowments. 7.
(19) Instead, trade may simply be a way of extending the market and allowing exploitation of scale economies” (p. 479). Finally, Anderson (1979) and Bergstrand (1989) studied the gravity equation, which is an equation predicting trade between two countries according to their incomes and the distance between the two of them. Anderson (1979) first provided a theoretical foundation to the gravity equation. Bergstrand (1989) then presented a framework assimilating the equation into the factor-proportions theory.. 政 治 大 2.2 Trade and Investments between the EU and China 立. ‧ 國. 學 ‧. As reflected by its export structure growing similar to advanced economies, China is increasingly competing with large industrialized countries. However, an important. y. Nat. er. io. sit. part of its exports are due to processing trade, similar export structure could also mean growing complementarity. Nevertheless, even if advanced countries can distinguish. n. al. Ch. i n U. v. themselves with price and quality for now, emerging market economies, such as China,. engchi. will be catching up quickly (International Monetary Fund, 2011). Indeed, Amiti and Freund (2010) analyzed the remarkable change in China’s export structure since 1992. They concluded that the sectors the most affected included machinery, especially telecoms, electrical machinery and office machines which soared considerably, and agriculture and apparel which shares on the contrary dropped. However, the authors also noted that China’s growing specialization in more advanced industries is mainly the result of processing trade.. 8.
(20) As highlighted by Nataraj and Tandon (2011), the change in China’s manufacturing happened in the 2000s, when it switched from the 1990s specialization in laborintensive goods such as footwear, textiles and toys, to the assembling of technologyintensive products. This change did not only result in a growth of China’s export in technology-intensive goods, but also in increasing competitiveness in the manufacture of high-tech products between 2001 and 2006. Moreover, Berger and Martin (2011) also focused on the main factors driving the growth of Chinese exports since the 2000s. They argued that the exchange rate only. 政 治 大 growing the fastest were 立technology-intensive, including cell phones and laptops, and have a limited impact on export growth. However, they noted that the products. ‧ 國. 學. explained their expansion by Chinese industrial policy, development of the demand both in China and in the world, as well as a drop in US high-tech fixed investment.. ‧. This growth of Chinese exports was not without consequences in industrialized. Nat. io. sit. y. countries which saw their manufacturing share decrease.. n. al. er. The EU is concerned by China’s changing economy too. Indeed, Andreosso O'. Ch. i n U. v. Callaghan and Nicolas (2007) noted an increase in intra-industry trade between the. engchi. EU and China in some sectors, especially in Machinery and Transport Equipment, contrarily to the general trend which tended to decrease. They explained that the specialization would not be at the same stage at first, but China’s quick catching-up could threaten the complementarity between the two sides. On the other hand, Holslag (2007) argued that the economic complementarity between China and the EU had already started to weaken, as China turned towards EU’s core sectors. According to the author, most of the EU member states can already feel the. 9.
(21) pressure from China’s rise. Moreover, China is also gradually catching up with Europe in research and development. Filippini (2009) confirmed that EU exports to China and China’s exports to the world are roughly the same, i.e. machinery and transport equipment, manufactured products and chemicals. However, Chinese exports to the EU are different and include textiles and clothing as well as manufactured goods and machinery. The possible threat represented by China to the EU in terms of export competition was analyzed by Benkovskis, Silgoner, Steiner, and Wörz (2013). The authors showed that. 政 治 大. there was an increasing competition in capital goods and transport equipment.. 立. However, member states from Central, Eastern and Southeastern Europe (CESEE). ‧ 國. 學. seem to cope better than other members, having an increasing share of export in these sectors, while the shares are declining in the rest of the EU. In overall though, even if. ‧. China is increasingly exporting in large EU countries’ traditional market, there is only. y. Nat. io. sit. small “cut-throat competition” and these large countries are less affected than CESEE. er. and small EU members.. al. n. v i n Freytag, C andh Legault Tremblay e n g c h i U (2011). Dettmer, Erixon,. focused on comparative. advantage and proved that China’s comparative advantages in trade with the EU have evolved due to its specialization in technology-intensive products. Moreover, EU’s comparative advantages alter faster with China than with the rest of the world. Concerning investments, China became the first global recipient of direct investments in 2002. However, the number of EU projects to China is still relatively low compared to Japan or the US. Nevertheless, an interesting fact is that in terms of value, EU projects are similar to that of the latter’s. The reason is that the EU is more open to. 10.
(22) technology transfer to China and thus invests in high value-added, technologyintensive industries, such as automobile or telecommunications (Wai, 2009). Hence, Zhang (2008) noted that China was mainly satisfied by the European investments. However, it does not hesitate to voice its dissatisfaction if needed, especially when it comes to the amount of technology transfer. On the European side, Chinese investments are low but increasing, particularly in Central and Eastern Europe where they are welcome to help closing the economic gap between Eastern and Western Europe.. 政 治 大. Finally, Ash (2008) concentrated on the reasons driving FDI both in China and in the. 立. EU, and argued that European companies are not investing in China simply to cut the. ‧ 國. 學. costs, but also to access Chinese market. Indeed, countries with low factor cost can be found in the EU itself, especially since the enlargements of the 2000s. The author. ‧. showed that the EU members in Central and Eastern Europe are partly responsible for. y. Nat. io. sit. the EU relatively low rate of investment in China, stating that: “7.1 per cent of all EU. n. al. er. FDI went to new Member States, compare to a mere 1.6 per cent to China” (p. 208).. Ch. i n U. v. On the other hand, Chinese outward FDI are relatively low compared with inward FDI. engchi. and investors tend to be less attracted by Western Europe than the North America because member states are too different from each other. Nevertheless, one of the major reasons for investment in Europe, except for facilitating knowledge transfer, is the acquirement of international brand names.. 11.
(23) 2.3 Economic Cooperation between the EU and China. China and the EU have many interests in common and many reasons to cooperate with each other. As Ash (2008) argued, China was first interested to have economic relations with the EU to balance the technological dependence it had with Japan and the US. On the EU side, they became growingly aware that relations with China were important both for their common foreign policy and economic future and competitiveness. The development of their economic relations was marked by the. 政 治 大. upgrading of its institutional framework. The sectoral dialogues, among others,. 立. became important means of coordinating trade relation, discussing sensitive issues and. ‧ 國. 學. developing new projects.. ‧. Rees (2009) also argued that economic cooperation with Europe was important for. sit. y. Nat. China, as a source of technology. On the other hand, European members are all very. io. n. al. er. attracted by the opportunity China represents and cannot afford to miss their chance.. i n U. v. Nowadays, new interests are also emerging. Indeed, Wong (2013) stated that China. Ch. engchi. draws EU’s attention not only because it is a huge market and the world’s factory, but also because it is a holder of European Debts. Furthermore, Freman (2006) argued that the most important part of the EU-China relationship was their economic relations. He asserted that the bases of the latter, from the European side, were mainly established by companies working in China, instead of politicians. However, today the Commission is responsible for formulating adequate responses to China’s growth. The task is not an easy one though, as each member has different interests and industries at stake.. 12.
(24) Nevertheless, except for the 16 months following the Tiananmen incident in June 1989, EU economic relations with China have been constantly improving. It started by the EC-China Trade Agreement in 1978, followed by a textile agreement in 1979 and the decrease of quantity restrictions on Chinese exports thanks to the Generalised System of Preferences (GSP). Then, the two sides became even closer in 1985 when they upgraded the 1978 agreement with the Trade and Economic Co-operation Agreement. In 2006, they started to discuss the revision of the later with a new Partnership and Co-operation Agreement (Andreosso - O' Callaghan & Nicolas, 2007).. 政 治 大 First is the “Foundation” 立with two communications from the Commission in 1995 and Fraser (2009) divided the relations between the EU and China into three main phases.. ‧ 國. 學. 1998. The two papers (“A Long Term Policy for China EU Relations” and “Building a Comprehensive Partnership with China”) aimed at consolidating their relationship. ‧. and focused particularly on China’s economic transformation, carefully avoiding. Nat. sit. y. sensible political issues. The second phase is the “Consolidation” with two other. n. al. er. io. papers from the Commission: The 2001 “EU Strategy Towards China:. i n U. v. Implementation of the 1998 Communication and Future Steps for a more Effective EU. Ch. engchi. Policy” included notes on China’s WTO accession and the 2003 “A Maturing Partnership – Shared Interests and Challenges in EU-China Relations” which was aimed at updating the two previous Commission’s communications of 2001 and 1998. Then the third phase is “New Horizons” with the 2006 “EU-China: Closer Partners, Growing Responsibilities” assessing China’s considerable growth and calling for further cooperation, notably through the Partnership and Cooperation Agreement (PCA), but also voicing some doubts concerning the ever growing trade imbalance. From the Chinese side, only one important paper has been issued in 2003. The “China’s EU Policy” paper was rather positive concerning their economic relations 13.
(25) but also noted China’s discontent about the market economy status or the antidumping measures. Men (2012) confirmed that the 1995 Commission’s paper “A Long Term Policy for China EU Relations” marked the beginning of a real engagement from the European side towards China. During the following 8 years, around 20 sectoral dialogues and agreements had already been created, and the relation between the two sides reached the status of strategic partnership. However, a few years later, China and the EU were disappointed by the development of the relations and the impossibility to solve issues. 政 治 大 Today, these issues are立 still unsolved and affect the better development of the relations. such as the arms embargo, the European trade deficit or the market economy status.. ‧ 國. 學. The PCA is good example of the stagnating situation with negotiations progressing very slowly since 2007.. ‧. Nonetheless, Balme (2008) argued that these sectoral dialogues are essential to EU-. y. Nat. io. sit. China economic relations. Indeed, they favor the transfer of know-how and experience,. n. al. er. not only from the EU to China but also the other way around, as in the case of nuclear. Ch. i n U. v. energy. Furthermore, they help the implementation of policies in China and balance. engchi. the negative impact of the numerous issues between the two sides. Indeed, as Filippini (2009) explained, we cannot dissociate economics from politics, and the Tiananmen incident and following arms embargo are good examples of political issues disturbing their economic relations. These sectoral dialogues, ranging from agriculture to science or environment 8, have been added to EU-China ordinary meetings to discuss these issues. In 2008, China added a new one, taking example on. 8. The full list is provided in Filippini 2009 p.29 14.
(26) its US-China Strategic Economic Dialogue to establish the EU-China High Level Economic and Trade Dialogue. Another important dialogue founded earlier in 1998 is the EU-China Annual Summit. As Tian (2013) explained it aims at supporting the ever upgrading economic relations between China and the EU. These summits are the occasion for both sides to discuss about the evolution of trade cooperation and issues they may encounter. Yet despite all these dialogues, Shambaugh (2007) argued that the 2006 European policy paper marked a change EU’s change of attitude towards China. This change. 政 治 大. was the result of the accumulation of unsolved economic as well as political issues,. 立. such as trade barriers or human rights. Another fact affecting their economic relations. ‧ 國. 學. was the change of leaders in the three major European countries, i.e. Germany, the UK and France.. ‧ sit. y. Nat. Men (2007) also agreed that the honeymoon between the EU and China which lasted. io. er. during 2003-2004 took another shape as soon as 2005. She argued that political. al. divergences between the two sides were threatening EU-China relations and both. n. v i n sides would have to improveCtheir to be able to cope with their conflicting h ecooperation ngchi U interests. Finally, Zhang (2012) argued that there were three important variables influencing China-EU economic relations: strategic foundations, reciprocity, and reasonable institutional arrangements. Thus, to improve their economic cooperation, they should strengthen their confidence in each other, see reciprocity in long term interests, instead of short term, and continue to promote dialogue between the two sides.. 15.
(27) 2.4 Disputes between the EU and China. The principal issues affecting trade between China and the EU are mainly due to the EU perceiving Chinese competition as unfair and its market as too protected. As a result, China is the first target of anti-dumping (AD) measures in the EU, with a number of cases increasing for electronics and mechanical products. Furthermore, China is accused to have too many entry barriers, such as high tariffs, non-tariff barriers, investment restrictions and lack of transparence in trade regulations. 政 治 大. (Andreosso - O' Callaghan & Nicolas, 2007).. 立. Indeed, as Filippini (2009) explained, the main issues from the EU side are the non-. ‧ 國. 學. tariffs barriers, the Intellectual Property Rights and the subsidies. Foreign products are. ‧. under much more constraints, such as product certification or labeling standards, than Chinese goods. Furthermore, counterfeits of European goods are increasing and. y. Nat. er. io. sit. European companies suffer from unfair competitions with Chinese companies enjoying export subsidies. On the other hand, one of the Chinese most important. n. al. Ch. i n U. v. complaints about the EU is the refusal to grant China the Market Economy Status. engchi. (MES). Indeed, this status facilitates anti-dumping measures against China, which are seen by the latter as a tentative to hinder its development. However, this issue should be solved in 2016, as it was agreed that the MES would be granted to China 15 years after its accession to the WTO at the latest. Nevertheless, other problems are persisting, such as EU’s tariffs and technical barriers or the arms embargo which started after the Tiananmen incident in 1989. Concerning the Market Economy Status, Balme (2008) argued that the dispute was only symbolic. Indeed, without the MES, the EU can use prices of a third country 16.
(28) instead of the Chinese market as a reference to measure if Chinese exports prices are too low and thus launch anti-dumping investigations. However, the AD measures concern only a very small share of Chinese exports, hence resulting in limited losses for China. Nevertheless, the issue is still affecting EU-China economic relationship. As for the Intellectual Property Rights, Wang (2004) stated that China’s progress were significant. However, it is facing problems to enforce the intellectual property protection in such a big country and enforcement agencies proved to be rather ineffective. Furthermore, the piracy market has grown alongside with the Chinese. 政 治 大 counterfeits. Finally, China 立 crucially lacks judges and professionals to raise the. economy, to the point that it became common for Chinese consumers to buy. ‧ 國. 學. awareness of the Chinese population concerning intellectual property. Men (2012) explained that the EU was favorable to China’s accession to the WTO. ‧. because it hoped it would constrain China to suppress trade barriers and to enforce. y. Nat. io. sit. Intellectual Property Rights. However, improvements are too slow according to the. n. al. er. EU which sees its trade deficit with China increase constantly. On the other hand,. Ch. i n U. v. China argues that the EU is solely responsible for its trade deficit, imposing too many. engchi. restrictions on EU exports to China, especially on products with high technology content, and refusing to give China the Market Economy Status. Indeed, Zhang (2008) confirmed that it would be to the advantage of the EU and China to limit, rather than abuse of anti-dumping measures. Indeed, benefits brought to the consumers are more consequential than the disadvantages suffered by the manufacturers. However, the EU is not the only one negatively reacting to China’s rise. Möller (2006) stressed that the US and Europe reacted in a comparable way to the threat represented 17.
(29) by China’s growth and its unfair competition. Nonetheless, the reaction of the EU tends to be more moderate than the US. Time did not seem to improve the situation. Indeed, Tian (2013) argued that the crises in Europe generated a wave of protectionism, especially turned against China. The case of the dispute over solar panels, which represents a big part of Europe’s exports, was seen an attempt to protect EU industry from losing export shares to China. Furthermore, Men (2007) claimed that disputes between the EU and China are partly due to the fact that each side does not have sufficient knowledge about the other’s. 政 治 大. market. Even more exchanges are necessary to cope with their increasing trade. 立. relations. Then, another fact affecting trade disputes between the EU and China is that. ‧ 國. 學. Europeans have very divergent interests, not only inside the EU but also inside their own country. Indeed, manufacturers and retailers won’t have the same opinion on. ‧. er. io. al. sit. Nat. come up with a common response to the disputes.. y. Chinese imports. This lack of coherence makes it difficult for the Commission to. n. Holslag (2007) also explained that disputes with China were creating issues between. Ch. engchi. the European countries, as EU members are. iv n diverse U and. do not have the same. economic structure. Hence, Southern Western countries such as Spain or Italy are opposed to Northern countries and Germany. The latter, specialized in high-tech industries, are being increasingly reluctant to protect the former, still producing laborintensive goods. On the other hand, Kong (2012) argued that trade disputes between the EU and China happen because neither side is willing to make compromises. Thus, their cooperation is hindered by concerns over reciprocity and short-term gains.. 18.
(30) Finally, Dreyer and Erixon (2008) stated that the many dialogues between the China and the EU seem to be rather ineffective to solve their problems. It remains to be seen if the new EU-China High Level Trade and Economic Dialogue, based on the USChina Strategic Economic Dialogue, will be more effective.. 2.5 Other factors affecting the EU-China Economic Relations. 政 治 大. The EU-China economic relations evolve in a complex environment, hence many. 立. factors, other than purely economic ones, can interfere and have an impact on the. ‧ 國. 學. relations.. ‧. Indeed, as mentioned before, politics and economics are linked, thus politics is one of. sit. y. Nat. the factors affecting the EU-China economic relations. Brown and Crossick (2009). io. er. argued that issues over human rights and Chinese internal affairs, such as Tibet, are hampering economic relations between China and the EU. For example, in 2008 the. al. n. v i n meeting of French presidentCSarkozy Dailai U Lama led to the cancellation of the h e nwith i h gc EU-China Summit and to the hindering of Chiese tourists traveling to Europe.. Moreover, Men (2013) explained that this was part of China’s economic diplomacy, which became significant starting 2004. Indeed, as Europe’s economy is stagnating, China is increasingly using business deals to turn the relations in its favor and avoid issues such as trade or environmental disputes and human rights. However, the author noticed that the use of economic diplomacy is relatively limited and only has an influence in the short term.. 19.
(31) On the other hand, financial factors also enter into account. Indeed, Van der Geest (2007) stressed that the depreciation of the RMB in the 2000s enabled a boost of Chinese exports in the eurozone. Nevertheless, the major financial factor influencing the EU-China relations is the financial crisis. Li (2009) argued that the financial crisis deeply affected the economic relations between EU and China, especially in terms of trade. Indeed, it became particularly clear in 2009, when trade between the two sides dropped by 20.9% compared to the same period in 2008. Chinese exports to the EU were the most. 政 治 大. affected with a decline of 24.5%, while EU exports to China decreased by 13.1%.. 立. Finally, Sorroza (2011) also argued that the euro crisis, subsequent to the financial. ‧ 國. 學. crisis, led to an increase of Chinese investments in Europe. Indeed, China can benefit from the situation in the eurozone and take the opportunity to gain influence in Europe. ‧. and more power on global supply chains. Investments particularly soared in the. y. Nat. n. al. er. io. Europe.. sit. Mediterranean region, which receives almost one third of China’s investments in. Ch. engchi. 20. i n U. v.
(32) 3. Impact on Trade and Investments. China’s change in export structure has raised some concerns, including the fear that it could have a negative impact for the EU. Indeed, as China’s and the EU’s export structure become similar some worry that the EU could lose its advantage in trading with China, hence hindering their economic relations.. 3.1 Impact on Trade. 政 治 大 3.1.1 Impact on Chinese 立Exports to the EU. ‧ 國. 學. In this part, we use a linear regression model to analyze the impact of China’s change. ‧. sit. Nat. E(y) = α + βx. y. in export structure on China’s exports to the EU, based on the following equation :. er. io. The independent variable is the change in China’s export structure to the world. al. n. v i n C hstructure to the EUUduring the same period, using data the change in China’s exports engchi between 1995 and 2012, using data from UNCTAD, and the dependent variables is. from Eurostat. The change (xn) is a percentage of variation from year n data (Xn) compared to the 1995 data (X95) (or 1999 for CESEE-12). It is calculated as follow: xn=(Xn/X95)-1 9. We will also use r2 to analyze the strength of association, as well as a test of independence with the null hypothesis H0 : β=0 and alternative hypothesis Ha : β≠0. Accepting the null hypothesis means that the two variables are independent.. 9. See Appendixes 1 to 11 21.
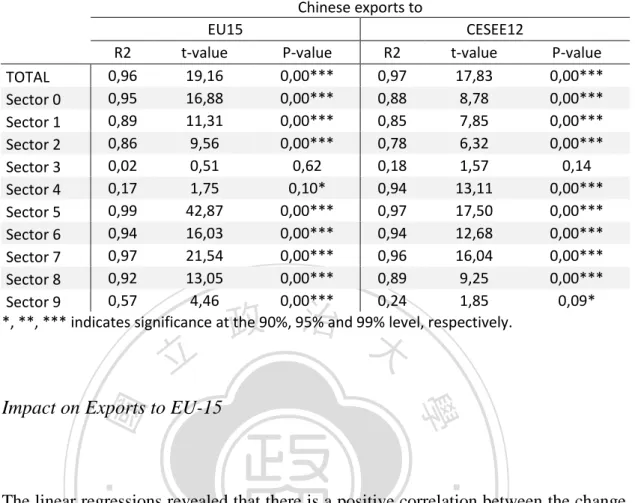
(33) Table 1 Association Between the Change in China's Export Structure to the World and the Change in China's Export Structure to the EU. Chinese exports to EU15 CESEE12 R2 t-value P-value R2 t-value 0,96 19,16 0,00*** 0,97 17,83 TOTAL 0,95 16,88 0,00*** 0,88 8,78 Sector 0 0,89 11,31 0,00*** 0,85 7,85 Sector 1 0,86 9,56 0,00*** 0,78 6,32 Sector 2 0,02 0,51 0,62 0,18 1,57 Sector 3 0,17 1,75 0,10* 0,94 13,11 Sector 4 0,99 42,87 0,00*** 0,97 17,50 Sector 5 0,94 16,03 0,00*** 0,94 12,68 Sector 6 0,97 21,54 0,00*** 0,96 16,04 Sector 7 0,92 13,05 0,00*** 0,89 9,25 Sector 8 0,57 4,46 0,00*** 0,24 1,85 Sector 9 *, **, *** indicates significance at the 90%, 95% and 99% level, respectively.. 政 治 大. 立. ‧. ‧ 國. 學. Impact on Exports to EU-15. P-value 0,00*** 0,00*** 0,00*** 0,00*** 0,14 0,00*** 0,00*** 0,00*** 0,00*** 0,00*** 0,09*. The linear regressions revealed that there is a positive correlation between the change. y. Nat. sit. in China’s export structure to the word and the change in China’s export structure to. al. er. io. the EU-15. We found a particularly strong association for 7 out of the 10 SITC main. n. sectors – food and live animals; beverages and tobacco; crude materials, inedible,. Ch. i n U. v. except fuels; chemicals and related products, n.e.s.; manufactured goods classified. engchi. chiefly by material; machinery and transport equipment; manufactured articles – with r2 ranging from 0.86 to 0.99. On the other hand, the correlation was particularly weak. 22.
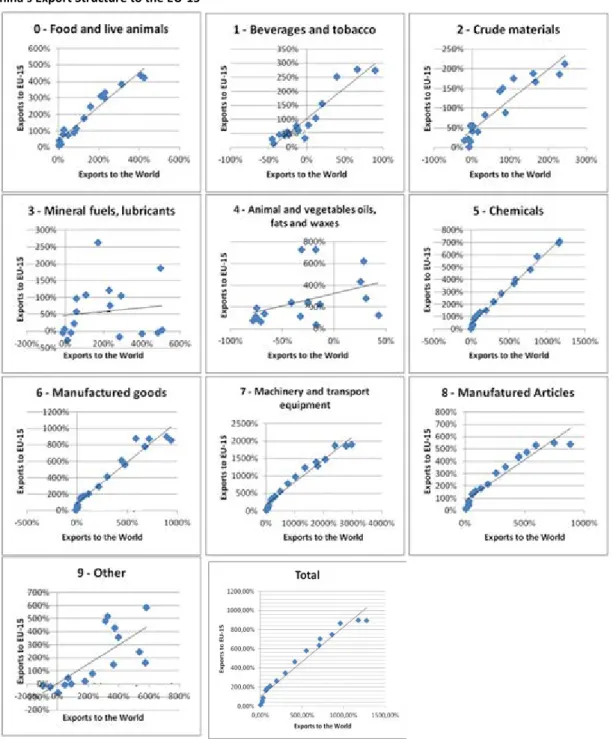
(34) Figure 1 Correlation Between the Variation in China’s Export Structure to the world and the Variation in China's Export Structure to the EU-15. 立. 政 治 大. ‧. ‧ 國. 學. n. er. io. sit. y. Nat. al. Ch. engchi. i n U. v. Sources: Appendixes 1 to 11. for groups 3 and 4 – mineral fuels, lubricants and related materials; animal and vegetable oils, fats and waxes – which implies that Chinese exports from these groups to the EU-15 do not particularly follow the same track as Chinese exports to the world. This is confirmed by the P-value which is not significant for these sectors. Nevertheless, on a general basis, Chinese exports to the world and to the EU-15 tend to evolve in the same way. Thus, the EU-15 is concerned by China’s change in export structure. 23.
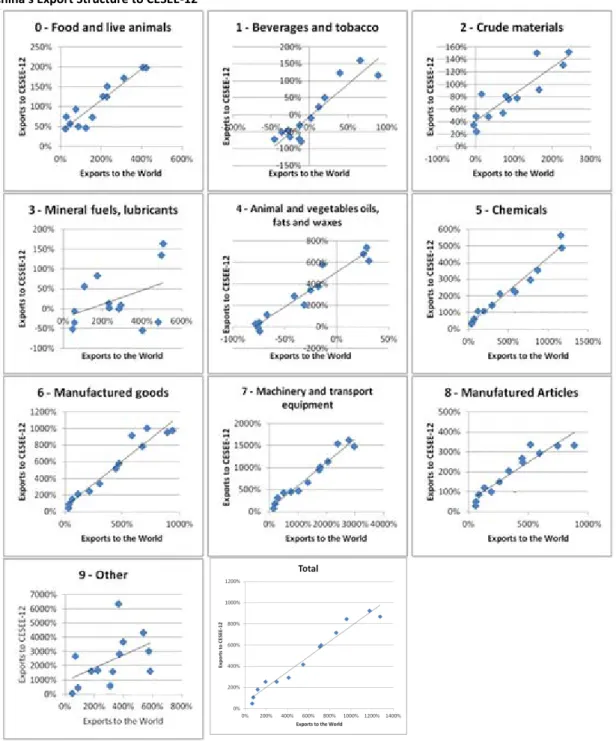
(35) Impact on Exports to CESEE-12. Concerning Central and Eastern Europe, the results from the linear regressions are very close to the one found with Western Europe. The relation between the change in China’s export structure to the world and the change in China’s export structure with Figure 2 Correlation Between the Variation in China’s Export Structure to the world and the Variation in China's Export Structure to CESEE-12. 立. 政 治 大. ‧. ‧ 國. 學. n. er. io. sit. y. Nat. al. Ch. engchi. Sources: Appendixes 1 to 11. 24. i n U. v.
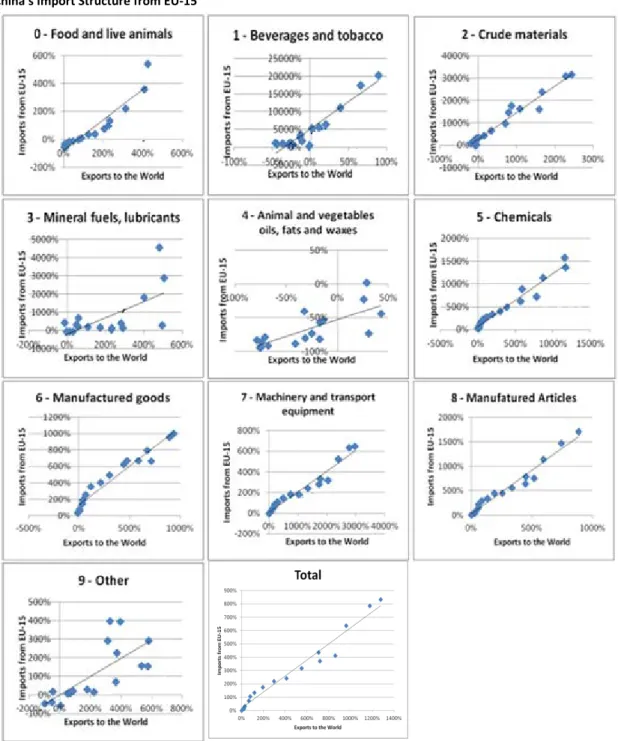
(36) CESEE-12 is positive for all groups. The strength of association indicated by r2 is slightly weaker than in the previous case, but the association is still strong enough for most groups. As for EU-15, groups 3 and 9 – mineral fuels, lubricants and related materials; commodities and transactions not classified elsewhere – show a weaker association with r2 of respectively 0.18 and 0.24. Their P-value is also insignificant, which means that the changes in these sectors are independent from the change in China’s export structure. However, there is a major difference for crude materials which got an r2 of 0.94 and significant P-value. Chinese exports to both Western and Eastern Europe evolve similarly to Chinese exports to the world. Hence, the change in China’s global export structure also has an impact on its export structure to the EU. We will see in the following part the. 政 治 大. consequence on China’s imports from the EU.. 學. ‧ 國. 立. 3.1.2 Impact on Chinese Imports from the EU. ‧ y. Nat. Following the first analyze on Chinese exports to the EU, we will now we use a linear. io. n. al. E(y) = α + βx. er. imports from the EU, based on the following equation :. sit. regression model to examine the impact of China’s change in export structure on its. Ch. i n U. v. The study is constructed in the same way: the independent variable is the change in. engchi. China’s export structure to the world between 1995 and 2012, using data from UNCTAD, and the dependent variables is the change in imports structure from the EU during the same period, using data from Eurostat. The change (xn) is a percentage of variation from year n data (Xn) compared to the 1995 data (X95) (or 1999 for CESEE12). It is calculated as follow:. xn=(Xn/X95)-1 10.. We will also use r2 to analyze the strength of association, as well as a test of independence with the null hypothesis H0 : β=0 and alternative hypothesis Ha : β≠0. Accepting the null hypothesis means that the two variables are independent.. 10. See Appendixes 1 to 111 25.
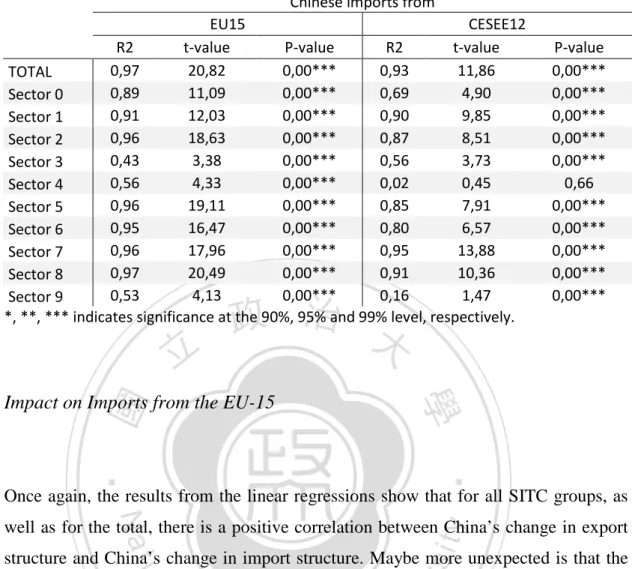
(37) Table 2 Association Between the Change in China's Export Structure to the World and the Change in China's Import Structure from the EU. Chinese imports from EU15 CESEE12 R2 t-value P-value R2 t-value 0,97 20,82 0,00*** 0,93 11,86 TOTAL 0,89 11,09 0,00*** 0,69 4,90 Sector 0 0,91 12,03 0,00*** 0,90 9,85 Sector 1 0,96 18,63 0,00*** 0,87 8,51 Sector 2 0,43 3,38 0,00*** 0,56 3,73 Sector 3 0,56 4,33 0,00*** 0,02 0,45 Sector 4 0,96 19,11 0,00*** 0,85 7,91 Sector 5 0,95 16,47 0,00*** 0,80 6,57 Sector 6 0,96 17,96 0,00*** 0,95 13,88 Sector 7 0,97 20,49 0,00*** 0,91 10,36 Sector 8 0,53 4,13 0,00*** 0,16 1,47 Sector 9 *, **, *** indicates significance at the 90%, 95% and 99% level, respectively.. 立. 政 治 大. ‧. ‧ 國. 學. Impact on Imports from the EU-15. P-value 0,00*** 0,00*** 0,00*** 0,00*** 0,00*** 0,66 0,00*** 0,00*** 0,00*** 0,00*** 0,00***. Once again, the results from the linear regressions show that for all SITC groups, as. y. Nat. sit. well as for the total, there is a positive correlation between China’s change in export. al. er. io. structure and China’s change in import structure. Maybe more unexpected is that the. n. same 7 groups as in the previous analyze – food and live animals; beverages and. Ch. i n U. v. tobacco; crude materials, inedible, except fuels; chemicals and related products, n.e.s.;. engchi. manufactured goods classified chiefly by material; machinery and transport equipment; manufactured articles – also have a very strong association with r2 ranging from 0.89 to 0.97. Again, groups 3, 4 and 9 have weaker associations. Nevertheless, the test of independence rejected the null hypothesis for all the sectors.. 26.
(38) Figure 3 Correlation Between the Variation in China’s Export Structure to the world and the Variation in China's Import Structure from EU-15. 立. 政 治 大. ‧. ‧ 國. 學. n. er. io. sit. y. Nat. al. Ch. engchi. i n U. v. Sources: Appendixes 1 to 11. The results show that none of the imports from the EU-15 dropped because of China’s increasing exports. Thus, imports from EU-15 to China not only do not suffer a bad influence from the change in China’s export structure, but they also tend to increase accordingly.. 27.
(39) Impact on Exports to CESEE-12. Figure 4 Correlation Between the Variation in China’s Export Structure to the world and the Variation in China's Import Structure from CESEE-12. 立. 政 治 大. ‧. ‧ 國. 學. n. er. io. sit. y. Nat. al. Ch. engchi. i n U. v. Sources: Appendixes 1 to 11. When we analyze the impact on imports from Eastern Europe, the results are again very similar to EU-15’s results. All groups have positive correlations between the change in China’s export structure and China’s imports from CESEE-12, but once 28.
(40) more the associations are a bit weaker, r2 ranging from 0.80 to 0.95 for groups 1, 2, 5, 6, 7 and 8. Furthermore, the P-value shows that the change in sector 4 and the change in China’s export structure are independent. Nevertheless, most of China’s imports from CESEE-12 follow the increasing trend of its export structure. Thus, the EU’s exports to China did not receive a bad impact from China’s changing export structure and both parts seem to be developing their intraindustry trade.. 3.1.3 Complementarity between the EU’s and China’s exports. 政 治 大 Trade between developed 立countries is often characterized by intra-industry trade. As. ‧ 國. 學. each country is specialized in the production of certain products in each industry, IIT does not necessarily bring problems.. ‧. Complementarity used to be one of the major pillars in the economic relations between the EU and China. In this paper, complementarity will be simply analyzed by. y. Nat. sit. comparing each side’s export structure. The complementarity will be judged as good. er. io. if both sides tend to mainly export different groups of products. On the contrary, it. al. will be judged as limited, if they mainly export the same groups of products.. n. v i n C We will now see how EU’s andhChina’s of trade with each other has evolved e n gstructure chi U since 1995 and if, despite the changes, they managed to keep some complementarity.. 29.
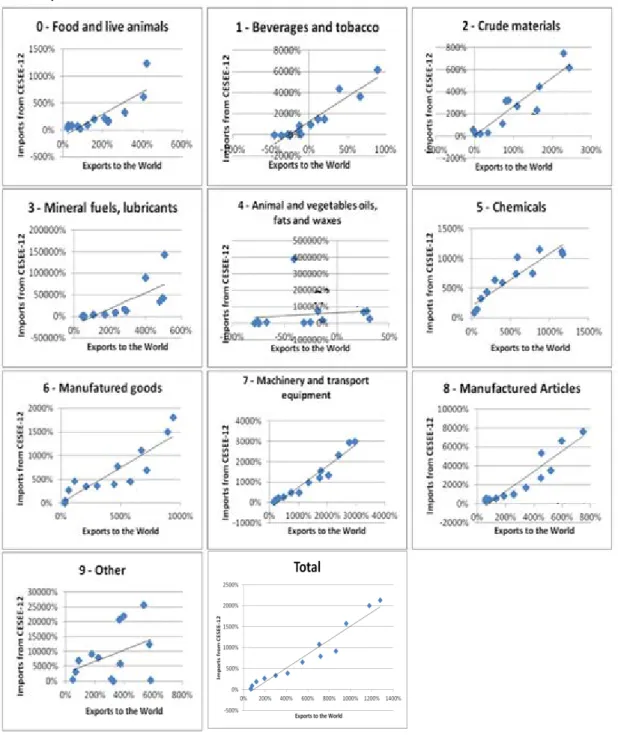
(41) 3.1.3.1 General trade structure. Trade with EU-15. First in 1995, almost three quarter of EU-15’s exports to China were machinery and transport equipment. The two next sectors were manufactured goods and chemicals with respectively only 7.67% and 6.72%. On the other hand, China’s exports to EU-15 were dominated by manufactured articles which represented half of its exports. Machinery and transport equipments and manufactured goods were also important with 24.09% and 12.97%.. 立. 政 治 大. Figure 5 EU15-China Trade Structure 1995-2012. ‧. ‧ 國. 學. n. er. io. sit. y. Nat. al. Ch. engchi. i n U. v. Source : Eurostat. Then in 2004, EU-15’s export to China had not changed a lot: machinery and transport equipment was still the most consequent sector with 63.95% and manufactured goods and chemicals rose to 12.08% and 9.14%. China’s exports were also dominated by the same sectors, although machinery and transport equipment became the most important one, representing half of the exports. Finally in 2012, machinery and transport equipment represented about half of the exports for both EU-15 and China. Manufactured goods were around 10% on both 30.
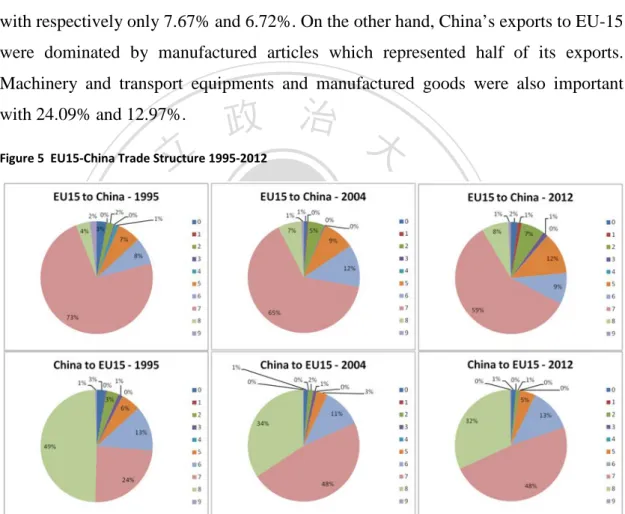
(42) sides too. The major differences were chemicals which represented 12.06% of EU15’s exports and only 4.52% of China’s exports, and manufactured articles which stood for 31.5% of China’s exports, compared to only 7.7% of EU-15’s.. Trade with CESEE-12. In 1999, CESEE-12’s exports were dominated by machinery and transport equipment, manufactured goods and crude materials, which represented respectively 41.23%, 23.48% and 21.62% of its exports. On the other hand, the share in machinery and. 政 治 大 second exporting sector was manufactured articles with 34.94%. 立. transport equipment also stood for 41% of China’s exports to CESEE-12, but the. Figure 6 CESEE12-China Trade Structure 1999-2012. ‧. ‧ 國. 學. n. er. io. sit. y. Nat. al. Ch. engchi. i n U. v. Source : Eurostat. In 2004, both sides increased the share of machinery and transport equipment, which reached 53.77% for CESEE-12 and 63.46% for China, and the share of manufactured goods did not change. For CESEE-12, the share of crude materials dropped to 6.52%. For China, the share manufactured articles dropped to 19.68%. Finally in 2012, CESEE-12’s and China’s export structures were pretty close, even though manufactured articles represented only 7.56% of CESEE-12’s exports, against 31.
(43) 15.59% of China’s exports, and manufactured goods stood for 20% of CESEE-12’s exports compared to only 11.67% of China’s exports. To conclude, China’s and the EU’s export structures are getting closer and closer to each other. Nevertheless, each sector includes many products, with many different technology and skill levels. In the following parts, we will look at each sector more precisely – except sectors 3, 4 and 9 which did not show a strong results in part 2 and are not important exporting sectors – to observe the complementarity inside of each 11.. 3.1.3.2 Complementarity in Sectors 0 and 1: Food, live animals, beverage, tobacco. 政 治 大. 立. ‧ 國. 學. The combined share of the sectors 0 and 1, which includes food, live animals, beverage and tobacco, turns around 2-3% of both EU’s and China’s exports. As the share is pretty small, we will combine these two sectors together to analyze the. ‧. complementarity between the EU and China.. n. al. er. io. sit. y. Nat Trade with EU-15. Ch. engchi. i n U. v. In 1995, China’s export structure was very different from the EU-15’s. Indeed, EU-15 exported almost exclusively cereals, whereas China’s exports were much more diversified, including mainly edible vegetables, fish and crustaceans, and preparations of vegetables, fruits and nuts. In the following years, China started to specialize in fish and crustaceans, which reached 34.02% in 2012. Nevertheless, its global export structure did not change too much, staying dominated by fish and crustaceans, preparations of vegetables, fruits and nuts, and edible vegetables.. 11. Groups from HS 4 digits have been redistributed in the 10 major SITC sections to be able to analyze the technology and skill level in each section. 32.
(44) On the other hand, the share of cereals in the EU-15’s export structure fell dramatically, from 80.71% in 1995 to 8.25% in 2012. Indeed, the structure started to diversify, but in different products than China. In 2012, EU-15’s exports in SITC sectors 0 and 1 were dominated by beverages, spirits and vinegar with a share of 34.92%, followed by preparations of cereals, flour, starch or milk and meat.. Trade with CESEE-12. CESEE-12’s export structure in sectors 0 and 1 is very different from that of EU-15,. 政 治 大 In 1999, half of CESEE-12’s 立 exports consisted of meat, followed by dairy, eggs and while China’s export structures to both regions are very similar.. ‧ 國. 學. honey products, and edible vegetables. On the other hand, as explained before, China mainly exported fish and crustaceans and preparations of vegetables. Vegetables were only the fourth group, preceded by cereals.. ‧. Over the years, China’s export structure changed a little. Indeed, it stayed dominated. Nat. sit. y. by fish and crustaceans and preparations of vegetables, but the share of cereals fell to. io. er. nearly 0%. As for CESEE-12, the shares of meat and dairy, eggs and honey products decreased a little bit, but stayed the most important ones. However, vegetables were. n. al. Ch. replaced by edible fruits and nuts.. engchi. i n U. v. To conclude, China’s export structure in food, live animals, beverage and tobacco did not change too much from 1995 to 2012. Furthermore, although EU’s exports structure undertook more variation, both sides kept a great complementarity over the year and tend to specialize in different products.. 33.
(45) 3.1.3.3 Complementarity in Sector 2: Crude materials, inedible, and related materials. The sector 2 - crude materials, inedible, and related materials – is also a minor sector in both EU and China’s export structure. Although it used to stand for 20% of CESEE-12’s exports, it decreased to less than 10% in 2012. Its share is falling in China’s exports too. Only EU-15 has an increasing share, but still very small.. Trade with EU-15. 政 治 大. At first sight, we can see that China’s exports and EU’s exports are both very. 立. diversified. In 1995, EU-15 exported mainly man-made staple fibers, wool and fine or. ‧ 國. 學. coarse animal hair, and copper. On the other hand, China’s exports consisted mostly of products of animal origin, and fine or coarse animal hair, ores slag and ashes, and salt, sulphur, earth and stone, lime and cement.. ‧. Then, Eu-15’s share of both man-made staple fibers and wool and fine or coarse. y. Nat. sit. animal hair fell to less than 1% in 2012. However the share of copper reached 37%,. al. er. io. followed now by pulp of wood waste and scrap of paper. Concerning China, its. n. structure stayed more or less the same: only the share of ores slag and ashes dropped. Ch. from 15% in 1999 to 6% in 2012.. engchi. i n U. v. Trade with CESEE-12. Contrary to the trade between EU-15 and China, trade with CESEE-12 is much less diversified, especially in 1999. At that time, almost all of CESEE-12 exports were concentrated in copper, oil seeds and grains, and wood and articles of wood. China was also exporting oil seeds and grains, but much less than products of animal origin – which stood for almost half of the exports – and salt, sulphur, earth and stone, lime and cement.. 34.
(46) Over the years, China’s export structure started to diversify. The share of products of animal origin decreased to 23%. The share of oil seeds and grains and salt, sulphur, earth and stone, lime and cement decreased a little bit too, and other products such as silk and wool saw their share increase. However, CESEE-12’s exports structure did not follow the same track at all as it became more and more dominated by copper which share reached 75% in 2012. To conclude, EU’s and China’s exports structures in the sector of crude materials are evolving quite differently. Once again, both sides manage to keep their complementarity from 1995 to 2012.. 政 治 大. 3.1.3.4 Complementarity in Sector 5: Chemicals and related products. 立. ‧ 國. 學. The sector of chemicals is the fourth most important sector for EU-15 and China, and the fifth one for CESEE-12.. ‧ sit. y. Nat. io. n. al. er. Trade with EU-15. Ch. engchi. i n U. v. EU-15 and China seem to be a little less complementary when it comes to chemicals. Indeed, in 1995, organic chemicals represented half of the exports for both sides. Nevertheless, it was followed by pharmaceutical products and fertilizers for EU-15, and inorganic chemicals for China. Then, in 2012, both EU-15 and China mainly exported organic chemicals, pharmaceutical products, inorganic chemicals and tanning or dying extract. However, the repartition was not exactly the same for organic chemicals and pharmaceutical products. Indeed, the share of organic chemicals stayed more or less the same for China, but decreased by almost half for EU-15, while the share of pharmaceuticals reached 45% for EU-15, against only 10.5% for China.. 35.
數據
+7


Outline
Introduction
Economic Cooperation between the EU and China
Disputes between the EU and China
Dumping and Anti-Dumping
EU-China Cooperation Structure
Evolution of the EU-China Relations through Summit Joint Communiqués
Signs of improvements in the EU-China Cooperation
The Experience of the US-Japan Economic Relations
Policy Recommendations
相關文件
With regard to spending structure, visitors from Mainland China spent 60% of the per-capita spending on shopping, whereas those from Hong Kong and Taiwan, China spent 79% and 74% of
With regard to the spending structure, visitors from Mainland China spent 63% of their per- capita spending on shopping, whereas those from Hong Kong and Taiwan, China spent 79% and
Promote project learning, mathematical modeling, and problem-based learning to strengthen the ability to integrate and apply knowledge and skills, and make. calculated
There is a growing recognition that China will change the world, not only economically, but also politically, intellectually, ideologically and culturally...
In order to solve the problems mentioned above, the following chapters intend to make a study of the structure and system of The Significance of Kuangyin Sūtra, then to have
中國春秋時期 (The period of Spring and Autumn in China) (770-476BC).. I am from the state of Lu in the Zhou dynasty. I am an official and over 60 years old. Her name is Yan
The remaining positions contain //the rest of the original array elements //the rest of the original array elements.
The min-max and the max-min k-split problem are defined similarly except that the objectives are to minimize the maximum subgraph, and to maximize the minimum subgraph respectively..
