Vortex flow pattern selection and temporal-spatial structures of transverse
and mixed vortex rolls in mixed convection of air in a horizontal flat duct
M. Y. Chang and T. F. Lin
Department of Mechanical Engineering, National Chiao Tung University, Hsinchu, Taiwan ~Received 18 March 1996!
Combined flow visualization and temperature measurement were carried out to explore the processes for selecting the buoyancy-induced vortex flow patterns and the temporal-spatial structures of the transverse and mixed longitudinal and transverse vortex rolls in air flow through a bottom-heated horizontal flat duct. The results for 1<Reynolds number Re<50 and 1800<Rayleigh number Ra<30 000 showed that the vortex flow patterns were determined from the competition between the buoyancy-induced thermal plume, which tends to generate transverse rolls and the onset of longitudinal vortices in the entry region of the duct. At 70<Ra/Re2,200 and 6<Re<20, the mixed longitudinal and transverse rolls prevail, while the moving trans-verse rolls dominate for 200<Ra/Re2,1900 and 1<Re<7.5. Moreover, the measured spanwise distributions of the time-averaged air temperatureuavindicated that whenuavat the midheight of the duct rises to a value
very close to zero, the transverse rolls appear. This simple condition provides a convenient method with which to detect the existence of the transverse rolls. The measured time samples of the instantaneous air temperature showed that in the duct filled with the pure and regular transverse rolls the entire flow oscillates at the same frequency and amplitude. At higher buoyancy, the downstream transverse rolls deform and can even break into irregular cells when Ra is high enough. The corresponding temperature oscillation becomes nonperiodic and its amplitude increases with the downstream distance. In the mixed-roll structure, the axial growth of the longi-tudinal rolls tends to bend the transverse rolls and causes them to become knotted. Finally, correlation equa-tions for the oscillation frequency of the air temperature and the wave speed in the transverse and the mixed longitudinal and transverse vortex flows were provided.@S1063-651X~96!14311-7#
PACS number~s!: 47.27.2i
I. INTRODUCTION
Mixed convection in a horizontal plane channel heated from below plays an important role in the understanding of the transition process of vortex flow resulting from the inter-action between the inertia and buoyancy forces and in the technological applications in growing thin crystal films from chemical-vapor deposition @1,2#, energy transfer in heat ex-changers @3#, and thermal control in compact electronic de-vices@4,5#. In each case it is important to know the detailed temporal and spatial structures of the buoyancy-induced vor-tex flow and the associated heat-transfer characteristics. Various vortex flow structures, such as the regular and de-formed longitudinal rolls, transverse rolls, and mixed longi-tudinal and transverse rolls have been observed in our previ-ous flow visualization@6,7#. Although the longitudinal vortex flow has been extensively studied in the past @8#, the transverse- and mixed-roll structures are not well under-stood. The present study is intended to unravel the flow and thermal conditions and the processes for the initiation of the transverse- and mixed-roll structures and the temporal and spatial characteristics of these structures by conducting a combined experimental flow visualization and temperature measurement. In what follows, the literature relevant to the present study is briefly reviewed.
For a horizontal plane channel specified by two large as-pect ratios RA 15b/d, where b and d are the duct width and height, respectively, and RA 25l/d, where l is the duct length
~RA 1@1 and RA 2@1! and bounded by two horizontal dif-ferentially heated conducting plates with a Poiseuille flow
imposed at the channel inlet, the onset of convection in the form of longitudinal rolls occurs around a critical Rayleigh number of Rac
L51708 @9–14#. The Rayleigh number Ra is defined as gbd3(Th2Tc)/na, where g,b,n, and adenote, respectively, the gravitational acceleration, air thermal-expansion coefficient, kinematic viscosity, and thermal dif-fusivity; Th and Tc are the uniform bottom and top wall temperatures, respectively. It is well known that Rac
L is un-affected by the Reynolds number Re~[Wmd/n, where Wm is the mean speed of the channel flow!, but the critical Ray-leigh number RacTfor transverse rolls increases with the Rey-nolds number @15,16#. Beyond the critical Rayleigh number RacT, different vortex flow patterns may compete depending on the Reynolds number. Steady and unsteady longitudinal rolls, time-periodic moving transverse rolls, and irregular chaotic snaking rolls were reported @7#. At high buoyancy-to-inertia ratio, the flow patterns are highly time and space dependent and multiple vortex flow patterns can coexist in the channel.
The dependence of the vortex structures on the Reynolds and Rayleigh numbers was delineated by a flow regime map including the flow with no rolls, steady and unsteady longi-tudinal rolls, transverse rolls, and unsteady intermittent rolls
@17–20#. Kamotani, Ostrach, and Miao @14# indicated that
the heat-transfer rate was affected not only by the Rayleigh number but also by the buoyancy-to-inertia force ratio. Be-sides, the insulated duct sides were found to have some ef-fect of stabilizing the flow, suggesting that the smaller the aspect ratio RA 1, the stabler the vortex flow. Moreover, the steady vortex flow was seen to become unsteady once the fully developed vortex rolls occupied the entire test section 54
in a long duct. Thus, the larger the aspect ratio RA 2, the more irregular the flow. Hence the flow regime map is somewhat different for different aspect ratios RA 1and RA 2. Moffat and Jensen@21,22# suggested that the buoyancy-driven secondary flow structure is very sensitive to the aspect ratio RA 1 and needs to be investigated in detail. Very regular transverse rolls can be easily obtained with a high-Prandtl-number sili-cone oil. It was noted that the higher the Prandtl number Pr of the working fluid, the lower the Reynolds number for the existence of the transverse rolls@16#.
A series of experiments was conducted@9–12# to investi-gate the spanwise temperature distribution of the flow con-taining steady longitudinal rolls. The spanwise temperature distribution has a very regular sinusoidal shape for the lon-gitudinal vortex rolls with a pitch l52d. The experimental results of Kamotani and Ostrach @12# showed that the sinu-soidal spanwise temperature distribution was destroyed at high Rayleigh number due to the unsteadiness of the flow. The simultaneous presence of the longitudinal and transverse
vortex rolls was predicted by Mu¨ller and co-workers@23–25# through solving the modal-amplitude equations for an ex-tremely low Reynolds number flow.
In our recent studies @6,7#, the detailed spatial structures of the longitudinal, transverse, and mixed vortex rolls in air flow through a horizontal flat duct were investigated through the flow visualization and temperature measurement. But the detailed temporal structures of the transverse and mixed rolls and the condition and processes for the selection of these structures remain unexplored. These will be examined in this study.
II. EXPERIMENTAL APPARATUS AND PROCEDURES A. Experimental apparatus
A sketch of the established test apparatus for the mixed convection of air in a bottom-heated horizontal plane chan-nel and the adopted coordinate system are shown in Fig. 1. FIG. 1. Schematics of the test apparatus and the chosen coordinate system.
The nondimensional x, y , and z coordinates respectively de-note the spanwise, vertical, and axial distances from the duct side, bottom, and inlet measured in the unit of duct height. The test section is a rectangular duct 240 mm wide and 300 mm long with a gap width of 20 mm between the hot and cold walls. Thus the aspect ratio RA of the duct is 12. The lower plate of the test section is made of a 15-mm-thick, high-purity copper plate and is electrically heated by dc power supplies. The heaters glued onto the outside surface of the bottom wall were divided into 10 segments in the flow direction and each heater was controlled independently by a GW GPC 3030D laboratory power supply. The high thermal conductivity, density, and large thickness of the copper plate can minimize the nonuniformity and unsteadiness in the bot-tom wall temperature. The width of the lower plate is 40 mm greater than that of the test section in order to reduce the edge effect in the spanwise direction of the test section. The upper plate is cooled by distilled water flowing above it. The distilled water is maintained at a constant temperature by a heat exchanger. The heat exchanger can control the tempera-ture of the distilled water to within 60.1 °C. The volume flow rate of the distilled cooling water is adjusted carefully so that the temperature difference in the cooling water over the glass plate is within 60.1 °C. The water head is also suitably adjusted to minimize any possible deformation of the glass plate. The side walls of the test section are made of 5-mm-thick plexiglass.
The temperature of the lower plate is measured by 13 calibrated and electrically insulated T-type thermocouples embedded in the plate. The upper-plate temperature is mea-sured by 6T-type thermocouples stuck to the inside surface of the plates. The temperatures of both plates could be main-tained at a nearly uniform and constant value with the devia-tions ranging from60.05 °C to 60.12 °C, depending on the Rayleigh number tested. For each experiment the top plate, temperature is kept at the same value as that of the inlet air flow for the purpose of eliminating the formation of a ther-mal boundary layer on the top wall.
The open-loop mixed-convection apparatus begins with the air regulated from a 600-psi and 50 000 cubic-foot-high pressure air tank which is passed through a settling chamber, a contraction nozzle, and a developing channel before enter-ing the test section. In the settlenter-ing chamber, turbulence is suppressed by passing the air first through two fine mesh screens, then a honeycomb section, and finally four fine mesh screens. The nozzle, with a contraction ratio of 20:1, has been designed to eliminate flow separation, minimize turbulence, and provide a nearly uniform velocity at the inlet of the developing section. The developing section is 1600 mm in length, approximately 83 times that of the channel height. This insures that the flow is fully developed at the inlet of the test section for Re<50.0. A 160-mm outlet sec-tion is added to the exit end of the test secsec-tion to reduce the disturbance resulting from discharging the flow to the ambi-ent atmosphere. The settling chamber and the contraction nozzle are made of stainless steel, whereas the developing channel and the outlet section are made of 5-mm-thick plexi-glass. The whole test apparatus is placed in a quiescent house to eliminate any possible disturbance from the ambient atmo-sphere surrounding the house. The entire loop, including the settling chamber, contraction nozzle, developing channel,
test section and outlet section, is thermally insulated with a superlon insulator 20-mm thick and is mounted on a rigid supporting frame.
The volume flow rate of air is controlled and measured by a Hasting HFC flow controller with an accuracy better than 1%. The flow-measuring system is calibrated periodically by a Brooks bell prover with an accuracy of 0.2%. The operat-ing condition of the flow meter in actual measurement is adjusted to a condition similar to that of the calibration stand. The mean air speed in the test section is calculated from the total flow rate.
To measure the velocity and temperature of the air flow in the test section, probes are inserted from the downstream end of the test section. The probes are supported by a three-way traversing device. Velocity is measured by a hot-wire probe. For calibrating the hot wire, the pipe flow method whereby the probe is placed in the center of a fully developed laminar pipe flow is used. The total flow rate is measured and the pipe center velocity is calculated from the parabolic distribu-tion. Temperature is measured by a thermocouple probe, an OMEGA~model HY P–O!, an extremely small T-type ther-mocouple~33-gauge! implanted in a 1-in.-long stainless steel hypodermic needle.
B. Data uncertainty
The data acquisition and control system and various in-struments including a PC 486-66, multiplexers ~Computer Product RTP 743 series!, a digital barometer ~Setra System 361B!, reference junctions ~Celesco Transducer Products BRJ 14!, laboratory power supplies ~GW GPC 3030D!, a stripe chart recorder ~GOULD Recorder 2800S!, OMEGA type-T thermocouples, a Hasting HFC flow controller, and reduction software were calibrated and adjusted end to end on site by Instrument Calibration Section, Q.A. Center, Chung Shan Institute of Science and Technology ~CSIST!, Taiwan with the transfer standards that the calibration hier-archy can trace back to the standards of National Institute of Standard and Technology, U.S.A. Before performing the end-to-end calibration, all the sensors and transducers used were transported to CSIST for calibration or adjustment with the interlab standards based on the test point that will be encountered in the present test to get best calibration curve-fit data. The main purpose of this calibration is to reduce any possible bias between the true physical values and the read-outs of the sensors or transducers. The data reduction error is reduced further by using the best nonlinear least-square cali-bration curve fits and by selecting a suitable gain code of the multiplexers. The system is well grounded and the electric noises are suitably filtered out. Fixed physical or simulated signals are then applied in the data uncertainty test. Samples higher than 32 are measured at each test point during the uncertainty test. Uncertainties in the Rayleigh number, Rey-nolds number, and other independent parameters were calcu-lated according to the standard procedures established by Kline and McClintock @26# and Abernethy and Thompson
@27#. The uncertainties due to the control unsteadiness and
temperature nonuniformity are also accounted for in the data uncertainty evaluation. The thermophysical properties of the working fluid~air! area50.220 cm2/s,b50.00335 °C21, Pr
50.737, and n50.162 cm2
properties are real-time corrected based on the temperature and pressure detected in the test section inlet. The detailed uncertainty analysis indicated that the uncertainties of tem-perature, volume flow rate, dimension, Reynolds number, and Rayleigh number measurements are estimated to be less than 60.15 °C65%, 60.05 mm66%, and 66%, respec-tively.
C. Analysis of temperature oscillation
The measured time-averaged temperatures of the air flow were obtained by averaging 1000–3000 sampled data points depending on the amplitude and frequency of the oscillation at that detection point. The sampling rate of the data channel was set at 0.1 s per scan, which was sufficiently high for the low-frequency oscillation in the low-Reynolds-number mixed convective flow considered here. In the tests, the de-tection points are distributed at 120 equally spaced spanwise positions in the horizontal planes at y51
2 and z52.52, 5.89,
9.26, and 12.62. In addition, a Gould Recorder 2800S analog recording system was utilized to record the instantaneous air temperature at the selected detection points.
D. Preliminary investigation of flow field
At first, the main forced flow was investigated to check its fully developed condition at the entrance to the test section with no heat input to the bottom plate. Figure 2 shows the sampled data from the hot-wire measurement for a typical case with Re550. The results clearly indicate that at the test section inlet the velocity profile is fully developed and is in good agreement with the analytical results given by Shah and London@28#. Additionally, the turbulence intensity is found to be less than 0.7%.
Flow visualization was conducted to observe the second-ary flow patterns from the top, side, and end views by inject-ing smoke at some distance ahead of the settlinject-ing chamber. They were carried out by using a 1.5–2.5-mm plane light beam to shine through the flow field containing tiny incense particles as the light scattering centers and a sharp contrast
could be achieved between the duct walls and the smoke. In the experiment, we first imposed a fully developed flow in the entire test section and then turned on the power supply to the bottom plate and in the meantime circulated the chilled water over the top plate. It took about 3 h for the Rayleigh number Ra to rise to the test point and required about another 2 h for Ra to stabilize. For the transient tests to examine the pattern formation, the Reynolds numbers could be changed to a new value in 6 s. After this, we began various measure-ments and flow visualization. The ranges of the parameters to be covered in the experiment are Re from 1.0 to 50 and Ra from 1800 to 30 000.
III. EXPERIMENTAL RESULTS AND DISCUSSION In the following, results are presented to show the effects of the Reynolds and Rayleigh numbers on the various char-acteristics of the transverse and mixed longitudinal and transverse vortex flows. Moreover, the conditions and FIG. 2. Comparison of the measured axial velocity profiles
W/Wmax at the inlet with the analytical solution from Shah and
London~Ref. @28#!. Circles: experimental data. Solid curves: ana-lytic solution.
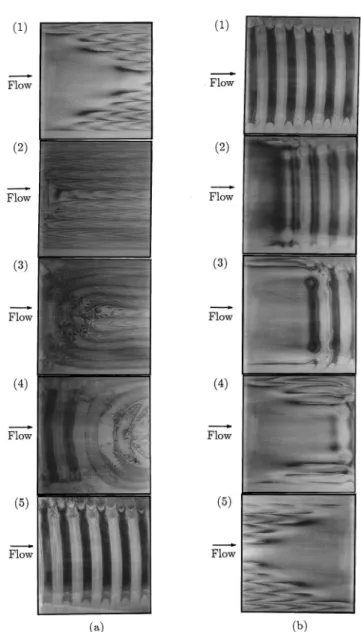
FIG. 3. Flow-pattern transformation effected by changing Re in 6 s~a! decreasing Re from 20 to 5 at Ra54000 and t5(1) 0 s, ~2! 16 s,~3! 26 s, ~4! 44 s, and ~5! 73 s; ~b! increasing Re from 5 to 20 at Ra54000 and t5(1) 0 s, ~2! 6 s, ~3! 10 s, ~4! 14 s, and ~5! 22 s.
mechanisms for selecting the vortex flow patterns will be examined.
A. Selection mechanism of vortex flow patterns The physical mechanisms determining the patterns of the vortex flow structures in the channel are examined first. Upon imposing a supercritical temperature difference across the horizontal plates, our previous flow visualization indi-cated that the vertical upward buoyancy tends to induce the longitudinal rolls in the downstream portion of the test sec-tion especially near the duct sides@6#. Meanwhile, the buoy-ancy can also induce a spanwisely uniform thermal plume in the upstream portion. Since the plume is strong enough to overcome the main forced flow at high buoyancy and rises from the bottom wall to the top wall, a pair of transverse rolls form @7#. More specifically, raising the buoyancy-to-inertia ratio by increasing the Rayleigh number or decreasing the Reynolds number causes the longitudinal rolls to move upstream and become stronger. At the same time, the trans-verse rolls also become stronger and are generated in a slightly upstream region. The subsequent competition of the
longitudinal and transverse rolls determines the pattern that will eventually dominate in the flow.
To elucidate the competition between the two different types of vortex rolls, the temporal evolution of the vortex flow following a change in the Reynolds number is examined in Fig. 3 by checking the instantaneous top view flow photos. Figure 3~a! shows the transformation from a steady longitu-dinal vortex flow with Re520 and Ra54000 to a time-periodic moving transverse vortex flow caused by a reduc-tion of Re from 20 to 5 with the Rayleigh number fixed at 4000. The instant at which the Reynolds number is changed is designated as time t50. Note that shortly after the Rey-nolds number is reduced at t516 s, the onset point of the longitudinal rolls has moved to the rather upstream region close to the duct inlet. Later, at t526 s, the longitudinal rolls merge with their symmetric counterparts in the upstream re-gion to form six U rolls. In the meantime, a pair of trans-verse rolls are generated in the duct entry region. Then the transverse rolls are slowly pushed downstream by the main forced flow, and the U rolls are also pushed downstream and gradually leave the test section. In the duct entry region, new FIG. 4. Effect of the Rayleigh number on the time-averaged spanwise temperature distributions at z52.52 and the flow patterns from the side view at x56 for ~a! Re530 and ~b! Re520.
transverse rolls are generated periodically in time. Finally, at
t573 s, all the U rolls are pushed out of the duct and pure
and regular traveling transverse rolls dominate the flow. When the Reynolds number is not reduced to that low value, the resulting buoyancy-to-inertia ratio is lower and the trans-verse rolls generated are shorter in the spanwise dimension and are weaker. Only the longitudinal rolls in the duct core are pushed out of the duct by the transverse rolls. Thus the
resulting vortex flow consists of moving transverse rolls in the duct core and stationary longitudinal rolls near the duct sides. The pattern transformation from traveling transverse rolls at Re55 and Ra54000 to stationary longitudinal rolls achieved by raising the Reynolds number to 20 with the Rayleigh number fixed at 4000 is shown in Fig. 3~b!. The results clearly indicate that when the main forced flow is speeded up, the transverse rolls are convected downstream at FIG. 5. Effect of the Reynolds number on the time-averaged spanwise temperature distributions at z52.52 and the flow patterns from the side view at x56 for ~a! Ra530 000 and ~b! Ra56000.
a higher velocity. Moreover, at Re520 the thermal plume is not strong enough to form the transverse rolls. Hence, at
t56 s, no roll appears in the upstream portion of the duct. A
close inspection of the photos, however, reveals that weak longitudinal rolls start to form in the upstream side wall re-gions. As time proceeds, the longitudinal rolls strengthen and grow in size and the transverse rolls move further down-stream. Meanwhile, more longitudinal rolls are induced near the existing ones. At t514 s, the transverse rolls almost move out of the test section and there are three longitudinal rolls near each side wall. Finally, at t522 s, a steady longi-tudinal vortex flow prevails in the duct.
It is important to note from the above results that during the intermediate stage of the pattern transformation the vor-tex flow experiences significant hysteresis. But as far as the end states are concerned, no hysteresis is detected. An over-all inspection of the results from the present flow visualiza-tion suggests that at low Re and high Ra/Re2 the inlet ther-mal plume is strong and can form the transverse rolls, and a pure transverse vortex flow prevails in the duct, while at high Re and low Ra/Re2 the thermal plume is too weak to form transverse rolls and the duct is filled with the longitudinal rolls. In between, at intermediate Re and Ra/Re2, the mixed-roll structure dominates the flow. It is interesting to further note from the combined flow observation and measurement of the spanwise distributions of the dimensionless time-averaged temperature uav5~Tav2Tm)/DT at the mid-height of the duct (y512) that when the transverse rolls dominate
the mixed convective flow, uav can rise to a value close to zero by the strong thermal plume. Here, Tav is the time av-erage of the local air temperature, Tm5(Th1Tc)/2, and
DT5Th2Tc. This provides a convenient condition for
jus-tifying the existence of the transverse rolls without visualiz-ing the flow.
To substantiate the above discussion, Fig. 4 presents the measured data foruavat y512 near the duct inlet and
instan-taneous flow photos from the side view at x56 for various Ra at Re530 and 20. Figure 4~a! shows that at Re530 the transverse rolls do not form for Ra up to 30 000, and uav away from the side walls is all well below zero. At Ra56000 and 15 000, the flow is respectively dominated by the steady and unsteady longitudinal rolls. At Ra530 000, irregular cel-lular flow occupies the duct. At the lower Reynolds number with Re520, uav is closer to zero@Fig. 4~b!# and there is a higher possibility of the transverse rolls existing. At Ra
56000, the vortex flow is still in the form of longitudinal
rolls, but at Ra515 000 the transverse rolls are clearly seen from the side view. The wrinkles in theuavdistribution, how-ever, indicate that the transverse rolls are rather unstable and irregular, which is considered to result from the significant flow perturbation by the unsteady longitudinal rolls in the downstream end. At the very strong buoyancy of Ra
530 000, the thermal plume and longitudinal rolls are
quickly destroyed by the strong irregular cells. Thus, for Re>20 no regular transverse rolls can be induced even when Ra/Re2is relatively high.
Next, the results for reducing the Reynolds number for Ra530 000 and 6000 are inspected in Fig. 5. For Ra
530 000, unsteady longitudinal rolls prevail at Re550 @6#
anduavis well below zero@Fig. 5~a!#. As Re is lowered to 40 FIG. 6. Side-view photos at x55.5 for ~a! Ra58000 and Re
5~1! 40, ~2! 22, ~3!–~6! 20, ~7! 15, and ~8! 10 and ~b! Ra54000 and Re5~1! 15, ~2! 10, ~3! 7.5, ~4! 5, and ~5! 2.5.
FIG. 7. Variations of the time-averaged temperature at x56, y50.5, and z52.52 with the ~a! Rayleigh and ~b! Reynolds num-bers.
and 30, uav is raised but is still somewhat below zero. For Re540, the unsteady longitudinal rolls are in a large-amplitude oscillation and become sinuous @6#. At Re530, the rolls are rather irregular and terminate in a short distance. Lowering Re further to 20 causes uavto rise nearly to zero. But the buoyancy-to-inertia ratio is high enough to result in a chaotic cellular flow. At the lower buoyancy of Ra56000, the flow is again dominated by the longitudinal rolls for Re>20 anduavis below zero. Note that at Re510, regular transverse rolls are clearly seen in the duct from the side-view photo except near the duct sides and the associateduav is slightly above zero.
To further illustrate the formation of the transverse rolls from the inlet thermal plume, snapshots of the flow at x55.5 from the side view at various Reynolds numbers for Ra
58000 and 4000 are given in Fig. 6. The results in Fig. 6~a!
for Ra58000 indicate that at Re540 the tip of the longitu-dinal roll at the onset point lies at the mid-height of the duct between the top and bottom plates. Reducing Re to 22 causes the tip to move upstream and shift toward the cold upper plate. This liftup of the roll tip is driven by the weak thermal plume induced near the hot bottom plate, as is evident from the side-view photo. A small reduction of Re to 20 strength-ens the thermal plume to a certain degree and the thermal plume sometimes can rise up to the top plate producing weak transverse rolls. The resulting vortex flow is rather unsteady and irregular. The transverse-roll structure clearly forms when Re is further reduced to 15 and 10. Note that stronger and bigger transverse rolls result for a decreasing Reynolds number. Due to the large Ra/Re2 for Re515 and 10, the transverse rolls become irregular in the downstream region. A similar but clearer vortex flow pattern transition can be seen for Ra54000 in Fig. 6~b!. Note also that at Re<7.5, the transverse rolls are relatively regular and there is a returning flow ahead of the test section inlet at z50.
As discussed above, the presence of the transverse rolls in the duct can be conveniently detected by measuring the time-averaged temperature uavin the inlet region. To portray the vortex flow structural change with the Reynolds and Ray-leigh numbers, Fig. 7 presents the relationship between the observed flow patterns and the measured uav at location 6, 0.5, and 2.52 for 77 cases investigated in the present study. The results in Fig. 7~a! suggest that for Re>35 the vortex
flow changes from steady to unsteady longitudinal rolls at increasing Rayleigh numbers anduavis well below zero. For Re525 and 30, an increase in Ra can cause the unsteady longitudinal rolls to change to the intermittent flow pattern, which is characterized by the time-periodic presence of the longitudinal and transverse rolls in the upstream core region. The simultaneous presence of the longitudinal and transverse rolls appears in a certain range of Ra for Re510, 15, and 20, which is designated as the mixed-roll structure. At the very low Re of 2.5 and 5.0, pure transverse rolls can exist withuav being very close to but slightly below zero due to the cold flow entrained by the returning flow ahead of the test section. Finally, it is noted that at a very high buoyancy-to-inertia ratio the chaotic cellular flow is prevalent. It is worth point-ing out thatuavdoes not always rise for the same flow pattern as the Rayleigh number is increased. Complicate variations in uav are observed if the Rayleigh number increase is ac-companied by the flow pattern changes. Inspecting the re-sults in Fig. 7~b! reveals that at Ra530 000, the vortex flow changes from unsteady longitudinal rolls to a chaotic cellular flow at decreasing Reynolds numbers. At a much lower Ra of 8000, before the flow becomes chaotic we can also see the intermittent flow and mixed-roll structures. The pure trans-verse rolls dominate the flow at Re52.5 and 5.0 for Ra
54000. It is important to note the drops inuavwith a reduc-tion in the Reynolds number for Re<5 at all Rayleigh numbers due to the appearance of the returning flow near the duct inlet. A flow regime map of Ra versus Re based on the present data is demonstrated in Fig. 8 for Re,20. For engi-neering applications, the ranges of the parameters for the appearance of the transverse and mixed-roll patterns are pro-posed as
70<Ra/Re2,200 and 6<Re<20
for the mixed rolls, ~1!
200<Ra/Re2,1900 and 1<Re<7.5
for the transverse rolls. ~2!
The flow regime map indicates also that at small flow rates FIG. 8. Flow-regime map for different types of flow patterns observed by flow visualization ~102 cases!.
Rac T
increases quadratically with Re and the critical Rayleigh number for the onset of the transverse rolls can be correlated as
RacT51823126.88Re2 for 1<Re<15. ~3! The equation can also fit the experimental data of Ouazzani
et al. very well in the parameter range of their study@18#. In
addition, the quadratic variation of RacT with Re in Eq.~3! agrees with the theoretical prediction at a low Reynolds number limit@24,25#. Besides, the critical thresholds for the transverse rolls Rac
T
and the longitudinal rolls Rac L
intersect at a nonzero Re*~'2!, which is qualitatively analogous to
the theoretical results@25#.
For the purpose of illustrating the detailed picture relating the vortex flow structure to the time-averaged temperature distribution at the mid-height of the duct, Fig. 9 shows snap-shots of the flow from the top and end views of a typical mixed-roll pattern and the associated uav distribution for a representative case with Re510 and Ra56000. The flow is time periodic and its temporal structure will be examined later. The results in Fig. 9 show that in the longitudinal rolls near the duct sides, uavhas a significant spanwise variation and uav is much flatter and closes to zero in the duct core, which is filled with the moving transverse rolls. In addition, the growth of the longitudinal rolls in the axial direction substantially squeezes the transverse rolls, causing them to become somewhat irregular and shorter. Similar results for FIG. 9. Flow visualization and the time-averaged spanwise temperature distributions for Re510 and Ra56000 for ~a! top view photo-graph at y512,~b! end view photos at z512.62,
and~c! spanwise temperature distributions on line y512 ~t50 denotes a certain time instant at
the pure and regular transverse-roll pattern are shown in Fig. 10 for an exemplified case with Re55 and Ra54000. No longitudinal roll is induced near the side walls and uav is rather flat and stays at zero in the entire duct except near the side walls, whereuavdrops slightly due to the significant heat loss from the hot bottom plate to the cold top plate through the plexiglass side walls and some heat loss from the flow to the ambient atmosphere. The roll size is equal to the duct
height. Moreover, slight bending of the rolls toward the downstream direction is observed.
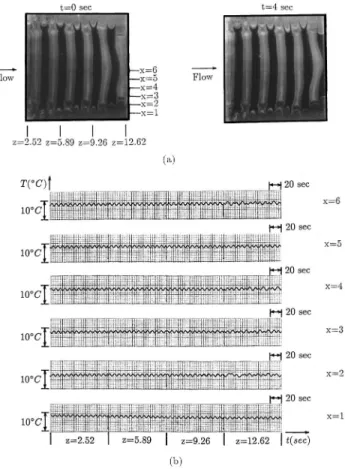
B. Temporal-spatial structures of transverse and mixed rolls The observed planforms of the flow and the measured instantaneous temperature variations in space and time are presented in the following to delineate the temporal and spa-FIG. 10. Flow visualization and the time-averaged spanwise temperature distributions for Re55 and Ra54000 for ~a! top-view photo-graph at y512,~b! side-view photos at x56, and ~c! spanwise temperature distributions on line y5
1
2 ~t50 denotes a certain time instant at
tial structures of the transverse and the mixed longitudinal and transverse vortex rolls. Figure 11 shows the planforms at two selected time instants in a typical period and the time records of the air temperature at 24 selected locations at the mid-height of the duct for a typical pure and regular trans-verse roll structure with Re55 and Ra54000. The results clearly indicate that the entire flow is time periodic with a period tp of 7.4 s and the amplitude of the sinusoidal tem-perature oscillation is the same for all detection points. The flow oscillation was found to result from the periodic gen-eration of the transverse rolls at the duct inlet and the down-stream movement of the rolls. It is of interest to note that an increase of Ra from 4000 to 5000 with Re still fixed at 5 causes the moving transverse rolls to become deformed, since they are close to the exit end of the duct~Fig. 12!. The rolls in the upstream remain rather regular and still oscillate at the same frequency and amplitude as those for Ra54000. The cause of the roll deformation in the downstream region is attributed to the larger heat transfer to the rolls from the bottom plate at a higher Ra and this heat cannot be com-pletely dissipated at the top plate. This excessive heat is then consumed in the roll deformation processes. Checking the time samples of the air temperature in Fig. 12 discloses that the roll deformation caused by the stronger buoyancy results in some irregularity and increasing amplitude in the tempera-ture oscillation at z512.62. Additionally, the temperature oscillation shows some dependence on the spanwise loca-tion. Near the duct side at x51, the oscillation is nearly regular. At a still higher Rayleigh number of 6000, the
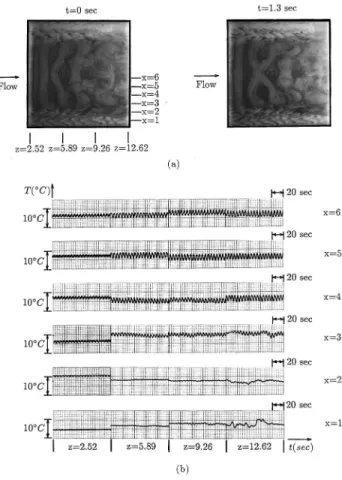
buoy-ancy is high enough to break certain deformed transverse rolls in the downstream portion of the duct into a number of irregular recirculating cells, as is evident from the results in Fig. 13~a!. Thus, in the exit half of the duct we observed a mixture of highly distorted rolls and cells. Moreover, the rolls in the entry region of the duct also become deformed. The degree of roll deformation increases with the down-stream distance. This trend is also reflected in the corre-sponding time records of the air temperature in Fig. 13~b!. Near the duct inlet, the temperature oscillation is time peri-odic. As the flow moves downstream, it becomes more and more irregular and oscillates in a larger amplitude with a lower frequency.
The temporal and spatial structure of the mixed longitu-dinal and transverse vortex flow are examined next. Again the vortex flow pattern revealed from the top-view photos at two time instants in a periodic cycle ~tp52.9 s! and the as-sociated time histories of the air temperature are presented in Fig. 14 for a typical mixed-roll structure for Re513.2 and Ra58000. The results in Fig. 14~a! clearly show that the regular transverse rolls in the entry region become bent and deformed as they travel downstream. This obviously results from the growth of the longitudinal rolls in the flow direc-tion, as mentioned above. The rolls bend toward the duct inlet and contain knots. Examining the time histories in Fig. 14~b! discloses that in the region dominated by the regular transverse rolls, the air temperature oscillates periodically at a single frequency and in the same amplitude. Slight irregu-larity in the temperature oscillation exists for the deformed transverse rolls. In the side wall regions dominated by the FIG. 11. Temporal structure of vortex flow from~a! top-view
photos and ~b! time records of air temperature on line y512 and
x56, 5, 4, 3, 2, and 1 for Re55 and Ra54000 ~tp57.4 s!.
FIG. 12. Temporal structure of vortex flow from~a! top-view photos and ~b! time records of air temperature on line y512 and
longitudinal rolls, the air temperature is rather stable except near the duct exit, where the longitudinal rolls become slightly unstable. Lowering the Reynolds number from 13.2 to 11.0 with Ra still fixed at 8000 results in a higher buoyancy-to-inertia ratio, and the resulting flow patterns shown in Fig. 15 are more irregular. Specifically, the defor-mation of the transverse rolls begins immediately after the rolls are generated at the duct inlet. The rolls quickly become highly distorted and near the duct exit they transform into longitudinal rolls. It is noted that the longitudinal rolls near the side walls also become increasingly irregular in the flow direction, similar to that for the transverse rolls. Furthermore, significant change in the vortex flow pattern with time is observed in Fig. 15~a!. Finally, the increasing flow irregular-ity with the downstream distance can be clearly seen from the data for the time histories of the air temperature in Fig. 15~b!. It is necessary to point out that the sawtooth wave form detected in the exit region@Fig. 15~b!# is caused by the cyclic flow deceleration and acceleration during the trans-verse roll to the longitudinal-roll transformation there. In ad-dition, a small decrease of the Reynolds number from 11.0 to 10.0 was found to result in a noticeable increase in the dis-order of the temperature oscillation.
Somewhat different temporal characteristics of the mixed-roll pattern are noted in Fig. 16 for the case with a higher Ra of 12 000 and a higher Re of 15.4. The results show that except near the test section inlet the flow is dominated by the highly deformed transverse rolls and irregular cells, but the corresponding time samples of the air temperature still
indi-cate that the flow is time periodic in the core region. A sub-stantial increase in the oscillation amplitude is noted in the entry region, where the roll deformation is so large that two adjacent rolls contact each other, resulting in the merging of these rolls and causing the rolls to move at a slower pace and to oscillate in a higher amplitude but at a lower frequency. In the downstream region, the longitudinal rolls near the side walls exhibit large-amplitude irregular oscillation. Now, as the Reynolds number is lowered from 15.4 to 13.2, the vor-tex flow shown in Fig. 17 becomes relatively irregular and the amplitude of the temperature oscillation is much larger and more irregular.
To manifest the effects of the Reynolds and Rayleigh numbers on the temporal structure of the moving transverse rolls, the time histories of the temperature at location x56.0,
y50.5, and z52.52 for various Re and Ra are given in Fig.
18. These results indicate that a reduction in the Reynolds number causes the air temperature to oscillate in a larger amplitude but at a lower frequency @Fig. 18~a!#. Note also that the mean air temperature maintains a constant value for all Reynolds numbers. Besides, the increase in the Rayleigh number results in a higher oscillation amplitude but minor change in the oscillation frequency except near the onset point of the transverse rolls at Ra53000, where the oscilla-tion frequency is a little higher@Fig. 18~b!#. The increase in the oscillation amplitude is due to the higher buoyancy-to-inertia ratio for a lower Re when Ra is fixed or for a higher Ra when Re is fixed. The decrease in the oscillation fre-quency with a reduction in Re obviously results from the FIG. 13. Temporal structure of vortex flow from~a! top-view
photos and ~b! time records of air temperature on line y512 and
x56, 5, 4, 3, 2, and 1 for Re55 and Ra56000 ~tp57.4 s!.
FIG. 14. Temporal structure of vortex flow from~a! top-view photos and ~b! time records of air temperature on line y512 and
lower convective velocity of the transverse rolls at a lower Reynolds number. It is noted from the present experimental data that for the transverse rolls the oscillation frequency of the air temperature due to the periodic passage of the moving transverse rolls over the detection points for the transverse and mixed-roll patterns are independent of the Rayleigh number and can be correlated in a nondimensional form as
F5 f
a/d250.47Re18.86431025Re
3, ~4!
where f is the frequency of the temperature oscillation. Note that F is an odd function of the Reynolds number, which is analogous to the theoretical prediction @24,25#. Besides, the oscillation frequency is weakly dependent on Ra but strongly dependent on Re, like that found by Ouazzani et al.@19# for water. The velocity Wr at which the transverse rolls are con-vected by the Poiseuille flow in the present study can be correlated as
Wr51.30Wm, ~5!
where Wmis the mean speed of the forced flow. This result is close to the experimental results of other investigators, with
Wr51.38Wm from Luijkx and Platten @16# for silicone oil and Wr51.393Wmfrom Ouazzani et al.@19# for water.
Finally, it should be mentioned that in the present inves-tigation of the time-dependent transverse and mixed vortex rolls, the flow is considered to be unsteady in a certain region
of the duct, which fluctuates at all times in that region. For these time-dependent flows, the Rayleigh number is well above the critical Ra for the absolute instability @24#. Thus the flows are absolutely unstable.
IV. CONCLUDING REMARKS
In the present study, the mechanism for the vortex pattern selection, the temperature condition for the existence of the transverse rolls, and the temporal-spatial structures of the regular and deformed transverse and mixed-roll patterns in air flow through a bottom-heated horizontal flat duct were investigated. Major results obtained can be summarized as follows.
~1! The pattern selection of the vortex flow is determined
by the competition between the longitudinal and transverse roll generation in the entrance region of the duct.
~2! At Re<7.5, the buoyancy-induced thermal plume is
rather strong and dominates over the onset of the longitudi-nal rolls when the Rayleigh number is in a certain range. Thus, the moving transverse rolls prevail. At Re>35, the inlet thermal plume is much weaker and the longitudinal rolls dominate the flow. At an intermediate Reynolds number 7.5,Re,35, the thermal plume predominates in the core region and the longitudinal rolls prevail in the side wall re-gion, resulting in the mixed-roll structure.
~3! The ranges of Ra/Re2 and Re based on the present data are proposed as 70<Ra/Re2,200 and 6<Re<20 for mixed longitudinal and transverse rolls and FIG. 15. Temporal structure of vortex flow from ~a! top-view
photos and ~b! time records of air temperature on line y512 and
x56, 5, 4, 3, 2, and 1 for Re511.0 and Ra58000 ~tp53.5 s!.
FIG. 16. Temporal structure of vortex flow from~a! top-view photos and ~b! time records of air temperature on line y512 and
200<Ra/Re2,1900 and 1<Re<7.5 for transverse rolls.
~4! The existence of the transverse rolls can be
conve-niently detected by measuring the spanwise distribution of the time-averaged temperature.
~5! The flow characterized by the regular transverse rolls
oscillates periodically in time at the same frequency and in the same amplitude in the entire duct. At higher buoyancy
the downstream rolls become deformed and even break up into irregular cells when the Rayleigh number is sufficiently high. The corresponding temperature oscillation is nonperi-odic and in a larger amplitude.
~6! In the mixed-roll structure, the effects of the Rayleigh
number on the deformation of the transverse rolls in the duct core are similar to that for the pure transverse vortex flow. But the growth of the longitudinal rolls tends to bend the transverse rolls and causes them to become knotted.
~7! The oscillation frequency of the air temperature in the
transverse rolls can be correlated as
F5 f
a/d250.47Re18.864310
25Re3.
ACKNOWLEDGMENT
The financial support of this study by the engineering di-vision of the National Science Council of Taiwan, R.O.C. through Contract No. NSC83-0404-E-009-054 is greatly ap-preciated.
@1# R. Takahashi, Y. Koga, and K. Sugawara, J. Electrochem. Soc. 119, 1406~1972!.
@2# B. J. Curtis, PhysicoChem. Hydrodyn. 2, 357 ~1981!. @3# W. M. Kays and A. L. London, Compact Heat Exchangers,
3rd ed.~McGraw-Hill, New York, 1984!.
@4# K. J. Kennedy and A. Zebib, Int. J. Heat Mass Transfer 26, 471~1983!.
@5# M. E. Braten and S. V. Patanker, Int. J. Heat Mass Transfer 28, 1699~1985!.
@6# M. Y. Chang, C. H. Yu, and T. F. Lin, Int. J. Heat Mass Transfer~to be published!.
@7# C. H. Yu, M. Y. Chang, and T. F. Lin, Int. J. Heat Mass Transfer~to be published!.
@8# C. C. Hwang and T. F. Lin, Int. J. Heat Mass Transfer 37, 1235~1994!.
@9# Y. Mori and Y. Uchida, Int. J. Heat Mass Transfer 9, 803 ~1966!.
@10# M. Akiyama, G. J. Hwang, and K. C. Cheng, J. Heat Transfer 93, 335~1971!.
@11# S. Ostrach and Y. Kamotani, J. Heat Transfer 97, 220 ~1975!. @12# Y. Kamotani and S. Ostrach, J. Heat Transfer 98, 62 ~1976!. @13# G. J. Hwang and C. L. Liu, Can. J. Chem. Eng. 54, 521 ~1976!. @14# Y. Kamotani, S. Ostrach, and H. Miao, J. Heat Transfer 101,
222~1979!.
@15# J. K. Platten and J. C. Legros, Convection in Liquids ~Springer-Verlag, Berlin, 1984!, Chaps. 6 and 7.
@16# J. M. Luijkx and J. K. Platten, Int. J. Heat Mass Transfer 24, 1287~1981!.
@17# K. C. Chiu and F. Rosenberger, Int. J. Heat Mass Transfer 30, 1645~1987!.
@18# M. T. Ouazzani, J. P. Caltagirone, G. Meyer, and A. Mojtabi, Int. J. Heat Mass Transfer 32, 261~1989!.
@19# M. T. Ouazzani, J. K. Platten, and A. Mojtabi, Int. J. Heat Mass Transfer 33, 1417~1990!.
FIG. 17. Temporal structure of vortex flow from~a! top-view photos and ~b! time records of air temperature on line y512 and
x56, 5, 4, 3, 2, and 1 for Re513.2 and Ra512 000 ~tp52.9 s!.
FIG. 18. Effects of the Reynolds and Rayleigh numbers on the temporal structure at x56.0, y50.5, and z52.52 for ~a! Ra54000 and Re5~1! 10.0, ~2! 7.5, ~3! 5.0, ~4! 2.5, and ~5! 1.25, and ~b! Re55.0 and Ra5~1! 2000, ~2! 3000, ~3! 4000, ~4! 5000, ~5! 6000, and~6! 7000.
@20# M. T. Ouazzani, J. K. Platten, and A. Mojtabi, Appl. Sci. Re-search 51, 677~1993!.
@21# H. K. Moffat and K. F. Jensen, J. Cryst. Growth 77, 108 ~1986!.
@22# H. K. Moffat and K. F. Jensen, J. Electrochem. Soc. 135, 459 ~1988!.
@23# H. W. Mu¨ller, M. Lu¨cke, and M. Kamps, Phys. Rev. A 45, 3714~1992!.
@24# H. W. Mu¨ller, M. Tveitereid, and S. Trainoff, Phys. Rev. E 48,
263~1993!.
@25# M. Tveitereid and H. W. Mu¨ller, Phys. Rev. E 50, 1219 ~1994!.
@26# S. J. Kline and F. A. McClintock, Mech. Eng. 75, 3 ~1953!. @27# R. B. Abernethy and J. W. Thompson, Jr., Aerospace Industry
Division of Instrument Society of America, Tennessee Tech-nical Report No. AEDC-TR-73-5, 1973~unpublished!. @28# R. K. Shan and A. L. London, Laminar Flow Forced