2010
Asia-Pacific International Symposium on Electromagnetic Compatibility, April
12 -16,2010,Beijing, China
A Study of PCB EMI Measurement and Simulation
Cheng-Chang Chen#\
Jian-Li Donl
2, Yen-Tang Chang#3, Chu-Kuo Chen#4, Ching-Wen Hsue*5, Shinichi Ikami#6# Bureau o/Standards, Metrology and Inspection, MOEA, Chinese Taipei '[email protected]
'[email protected] [email protected]
'National Taiwan University o/Science and Technology, Chinese Taipei [email protected]
#Yamato Laboratory, IBM Japan, Japan [email protected]
Abstract- In this paper, simplified models and simulation of radiated far-field emission from a printed circuit board (PCB) are discussed. Furthermore, a study of radiated far-field emission for an equivalent PCB model is presented. The behaviour between simulated far-field EMI spectra and experimental results keeps the same trend.
I. INTRODUCTION AND BACKGROUND New technologies in telecommunications and computer industry are constantly evolving. Integrated circuits with faster clock speeds are being manufactured. Motherboards and other printed circuit boards become more complex. The demand for more rigorous, global modelling [1] of the electro magnetic behaviour is especially obvious when dealing with spurious or parasitic modes. The problem of predicting both electromagnetic interference (EMI) levels and compliance with regulatory EMC standards is very common. It is advan tageous to be able to make estimation for the EMI from PCBs during design process. The traces on a modem PCB are characterized by a typical length of several cm up to 30 cm with extreme small cross section. The cross section consists of a copper trace with a width in the millimeter region and thickness of 100 f1 m located above a dielectric layer having thickness of several 100 f1 m. The main focus of this paper is the analysis of the spurious emission from these modem PCB structures.
The analysis of the electromagnetic behaviour can be performed exactly by using the method of moments (MoM), which is in widespread use. Due to the great complexity of conducting structures and the layered media, the PCB causes a challenge for the MoM. Therefore, it has been difficult to calculate the radiation behaviour of a complete modem PCB with the MoM or other full-wave method. Up to now, a new method to determinate the spurious emission from the PCB has presented by [2]. It is an efficient method to calculate the radiation of PCB in frequency domain. In practice, the modem PCB circuit always include both analog and digital signal. The EMI problem of this kind PCB may be very complex. It is very difficult to simulate the EMI problem in frequency and time domain.
To overcome this problem, we have developed co simulation method in this paper. First of all, the radiated
emissions from the PCB higher than EM! limiter are obtained by using the measurement. The equivalent noise source of the PCB can be defined from each frequency of the higher radiated emission. Then by incorporating the equiv-alent noise source into the full-wave field solver platform, one may establish a fast method for analyzing the radiated fields from the modem PCB circuit. Note that the developed fast method would be very efficient for spurious emissions estimation.
II. CO-SIMULATIOM METHOD
EMI simulation and engineering analysis techniques are very useful in the product design. It can help R&D engineers to understand electromagnetic phenomena at the early stage of the development process. EMI phenomena are very sophisticated; however, there is no easy way to simulate a whole product set within one time.
To analyse PCB EMI problems, two ways are often taken, namely, measurement and simulation. Measurement data aren't easy to clearly figure out EMI problem due to a source, signal path and victim. This causes EMI problem hard to be solved. Another way is full wave simulation which may provide sufficient data to figure out solution. But full wave simulation spends a lot of time. This paper discusses a method that combines boht measurement and simulation to easily solve EMI problem. The flow chat is shown Fig.l. The major analysis steps are summarized as below:
1. Measurement:
2.
a. Near field scan is used to obtain hot spot positions.
b. Far field measure is employed to fmd out critical frequencies.
Simulation:
a. Spice solver is used to simulate noise source. b. According PCB layout and measurement data, a
simplified model is created to reduce simulation time.
c. Verification of step 2-b result with measurement data. If the results are inconsistent with each other, we then modify model until the results are acceptable.
A AL TERA MAX CPLD chip is selected as the device under test (DUT) because it is widely used in the industry. It is configured with 3 sets of 8-bit data bus. One of the 8-bit bus will be routed, as shown in both Fig. 2 and Fig. 3. Enabling the Pair 1 (Pair 2) in single-ended mode and comparing the result with the operation of Pair 4 (Pair 3), the effect of the slit will be obtained. By comparing operations of Pair 1 with those of Pair 2, the effect of signal position against the slit will be obtained. With population of the slit bypass capacitors, its effect will be obtained. The dielectric constant of this four-layered sample PCB is 4.5.
PCB EM! PROBLEM
Fig.! Flow chart of PCB EMI analysis.
Fig.2 Top view of PCB for its physical view.
Slit of Ground & Power planes ___
Slit Bypass
Capacitors
,
----.
(Not populated
-In -Initial card) Pair 1: -bit 0 & 1 -Pair 2: -bit 2 & 3
1=
-."
0 CPLD il '"I-l
Pair 3: bit4 & 5I
Pair 4: bit6 & 7 B1A B1C BiD B1BFig.3 Routing illustration.
III. MEASUREMENT Signal Receiv � r -r=--
'---A. Near field measurement to obtain hot spot positions er
A magnetic surface scanning measurement was conducted. The near-field scanning is Imm above the PCB. The meas urement result shows hot spot position where noise source is located.
B. Far field measurement to find out critical frequencies
To fmd out every emitted frequency from main source of emission, Fig. 4 shows the typical setup for radiation EMI measurement. The PCB is placed on the top of a rotating table. It is 0.8 meters above the ground plane in a semi anechoic chamber. The spurious emissions are received by the R&S ESIB test receiver equipped with the wideband antennas (CHASE CBL 6112). Several ferrite cores are arranged on the power cable (near the PCB) to minimize the common mode current induced on the cable from power supply noise. The table was rotated 360 degrees to determine the position of the highest radiation. The height of the test antenna varies between 1m to 4m [3]. Both vertical and horizontal polarizations of the antenna are set to make the measurement. The distance between antenna and PCB is 10 meter.
Fig.4 Measurement setup.
All results for the four cases of radiation were taken individually from both vertical and horizontal measurements.
Fig. 5 shows the completed four cases of far-field results. The trace gives the information on both the concerned frequency and field strength. From these results, the 10 meter radiated strength of Pair AlC is higher than one of Pair BID at specific frequencies, as shown in Fig. 6. It is a general EMI rules for
PCB� .� __________________________ __
Slit Un der Trace
60 r-
---
��----
------
------
�o 100 200 300 400 500 600 700 800 900 1000 Frequency (MHz)
Fig.5 Field strength for four cases under critical frequencies ..
Slit Under Trace
45 .... , ... , ... 75 � 40
�
E ______ 150 � ."-
-
-
-'---til 35�
-..-
L=::===r
--.-225 :"!�
//��"--.. .<:: 300 to 30�
'"
c e ____ 375 en 25 "0 4j u::.
.
.
---..
----+--450 20 _525 15 B1A B1B B1C BlO -600Fig.6 Comparison between a trace over a partially slit ground plane and a trace over a fully ground plane
C. Find out noise source waveform
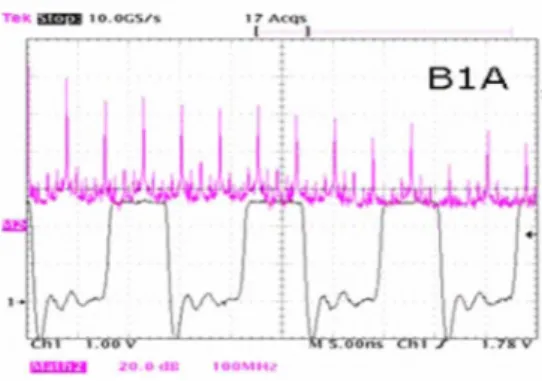
Time domain signal waveforms are sampled to verifY their running behaviour to ensure the accuracy of model set up. We measure the output waveform by enabling one of the four pairs and calculate the corresponding frequency spectrum by the fast Fourier transfer (FFT) method. The transfer factors of the harmonics for the waveform is then obtained. These factors can be used for the scaling of the noise source without the IC internal specification. Fig. 7 shows both the waveform and spectrum taken from Pair 1.
Fig.7 Output waveform and spectrum for Pair 1.
IV. SIMULATION
IBM EMSurf based on Moment of Method (MoM) (see [4], [5]) is the simulation tool for this work. A simplified model (see Fig. 8) based on PCB circuit has been constructed where CPLD is replaced by two pieces of conducting power planes with 3.3v and 5.0v, respectively. Noise source of I-volt swing is assigned in one of the 8-bit outputs with 37.5 ohm output impedance. In order to collect far-field data, a surface to detect 10m electric field must be made for the simulation tool. However, due to the condition of single dielectric constant, 4.5, for both PCB and background, the distance between OUT and the antenna must shrink from 10m to 4.7m while the vertical position is from 4m to 2.4m because the wavelength is proportional to the inverse of square root of dielectric constant. Thus, the detective field points can be prepared.
Fig.8 A corresponding model built-up for PCB.
Fig. 9 shows the simulation results. Resonance �ccurs. at frequencies 225MHz and 600MHz for the first SImulatIOn result, the upper line in Fig. 9. After examining th� difference between PCB and the model, 13 bypass capaCItors found missing on the model. Thus, the middle line of Fig. 9 is the result by adding back these capacitors which resonance disappears. Finally, the IO-pF stray capacitances are placed at the termination and adjacent quiet signal trace to model the coupling effects along with 33-ohm dumpers inserted into the trace where the bottom line of Fig. 9 is the result of the completed model. With these conditions, the model predicts the far field data (see Fig. 10) and consequently the effects of EMI design rule.
E
B1A(Outer with Slit) modeling 100
90 a
80 LeveI2-0829-SourceB lA-J 7 .50hm .modl
1
*1 +' 70 C\l -0E
60 Q) "--u::: I > :::l 50 *2 W CD 40 --0 .:s\.
B1A-bp.modl <l) 30 +' C\l '6 20 C\l B1 [or2] x-bp-Adj10pF-s33.modl 0:: 10 0 0 150 300 450 600 FrequencyFig.9 Radiated fields. top) original model with 37.5 ohm source impedance; middle) with 13 bypass capacitors added; bottom) completed model.
�E
��
40 50 ill" 30 " -!l �8 � 20 .., v 10 � E 0 '";! ",,� ",�Effect of GrOU"ld Slit
r=->
II
I I f 1 t;}�..
' :\0 4" .:t-' q.� �v.t-- c:-<f' o� � ... ��� <lJ'" '",.
.,$fil
�� .. ,0 1=75 ... 75(�m)1� Effect of Grol.l"ld $lIt
�
�I
IT
�{ -> � ,11
F9
rl
j!
�
�' '" ".!t cj� 4-!;,. 4� 4� .to' �� .to' �\o",.t> ",I' ,,f'
� ... � (fJ'" 'i!:),Q
1=150 ... 150(simll
Effect of GrOU'ld SII t
I
50 ,---, 40 � ���
� 10(
a)75MHz-300MHz measurement and simulation! Effect of Ground Silt
�
60 ,-------, it 50 _> 40 � � 30 '0 � 20 ! i "(b) 375MHz-600MHz measurement and simulation
Fig.lO Comparison results between the measurement and simulation at (a) 75MHz-300MHz (b) 375MHz-600MHz
V. SUMMARY
This study shows how to easily find out clear EM! phenomena from measurement and full wave simulation. A CPLD chip was used as a benchmark for measurement and simulation. Near field measurement finds out where is a noise source while far field measurement carries out the critical frequencies. Measurement data can then create the simplified model and decide simulation conditions.
This approach is most useful to obtain PCB simplified model to reduce its computational complexity for a system level. The behaviour between simulated far-field EMI spectra and experimental results keeps the same trend.
ACKNOWLEDGMENT
This work was supported in part by National Science Council under Grant NSC 100-1403-05-05-11.
REFERENCES
[ 1] Jin Shi, Jiangqi He, Edward Chan ,Kevin Slattery, Jin Zhao, Jeremy Fejfar, and Fabrizio Zanella, "Equivalent Radiation Source Extraction Method for System Level EMI and RFI Prediction," EMC 2008. IEEE International Symposium, Page(s): 1 - 5, Aug. 2008
[2] Han-Chang Hsieh, Cheng-Nan Chiu" Chi-Hsueh Wang, and Chun Hsiung Chen, "A new approach for fast analysis of spurious emissions from RF/microwave circuits," IEEE TRANSACTIONS ON ELECTROMAGNETIC COMPATIBILITY, VOL. 5 1, NO. 3, AUGUST 2009.
[3] CISPR 22, Information technology equipment - Radio disturbance characteristics - Limits and methods of measurement.
[4] Frank Sabath, and Heyno Garbe, "Radiation analysis of PCB layout using a hybrid MoM-MTL method," IEEE TRANSACTIONS ON ELECTROMAGNETIC COMPATIBILITY, VOL. 45, NO. 2, MAY
2003.
[5] Bruce Archambeault, and Albert E. Ruehli, "Analysis of power/ground-plane EMI decoupling performance using the partial element equivalent circuit technique," IEEE TRANSACTIONS ON ELECTROMAGNETIC COMPATIBILITY, VOL. 43, NO. 4, NOVEMBER 2001.