Industrial & Engineering Chemistry Research is published by the American Chemical Society. 1155 Sixteenth Street N.W., Washington, DC 20036
Article
Relay Feedback Tests for Highly Nonlinear Processes:
Reactive Distillation
Yu-De Lin, Hsiao-Ping Huang, and Cheng-Ching Yu
Ind. Eng. Chem. Res., 2006, 45 (12), 4081-4092 • DOI: 10.1021/ie0514105Downloaded from http://pubs.acs.org on November 18, 2008
More About This Article
Additional resources and features associated with this article are available within the HTML version: • Supporting Information
• Links to the 3 articles that cite this article, as of the time of this article download • Access to high resolution figures
• Links to articles and content related to this article
Relay Feedback Tests for Highly Nonlinear Processes: Reactive Distillation
Yu-De Lin, Hsiao-Ping Huang, and Cheng-Ching Yu*
Department of Chemical Engineering, National Taiwan UniVersity, Taipei 106-17, Taiwan
This paper is intended to demonstrate the effectiveness of the relay feedback test for the identification of highly nonlinear processes, namely, reactive distillation. Because of the multifunctional nature, reactive distillation exhibits strong nonlinearity and possible “sign reversal” in the steady-state gain of product composition and tray temperatures. A methyl acetate reactive distillation is used to illustrate performance of two different identification approaches: step test and relay feedback test. For the composition control, step tests reveal sign changes in steady-state gain as the step size varies from -10% to +10%. Moreover, step test is also sensitive to the direction of the step. On the other hand, consistent ultimate gain and the ultimate period can be identified for different relay heights with different initial step directions. The error in the high-frequency information is <5% for the reactive distillation column that has been studied. Good control performance can be obtained using simple PI controllers tuned with the ultimate gain and ultimate period. Comparison is also made for temperature control and, again, the results indicate that consistent high-frequency information can be obtained with the relay feedback test. Finally, relay feedback is applied to multivariable control of reactive distillation. The resultant PI controllers, designed based on the ultimate information, also gives satisfactory performance for set-point and load changes.
1. Introduction
The relay feedback test proposed by Åstro¨m and Ha¨gglund1
has received much attention in the process control community. Luyben2was among the first to use the relay feedback test for
system identification and it is shown to be effective for highly nonlinear chemical processes, namely, high-purity distillation columns. Chang et al.3derived the transfer function from the
relay feedback test with increased accuracy. The autotune variation (ATV) identification method has become a standard practice in chemical process control. Several groups4-10have
developed autotuning procedures for the design of proportional-integral-derivative (PID) controllers. Methods to obtain exact parameter estimation from asymmetrical limit cycle data are also proposed.7,9,11 Two books have been written to cover
various aspects of relay feedback autotuning and summarize the progress made over the past decade.12,13Applications of relay
feedback to distillation columns, reactor/separator recycle plants, fuel processors, and reactive distillation columns have been reported in the literature, and the method is shown to be effective for nonlinear processes.
Reactive distillation combines reaction and separation in a single unit, which provides substantial economic incentives for some chemical reaction systems. The literature and patents in reactive distillation have grown rapidly in recent years, as surveyed by Malone and Doherty.14The books by Doherty and
Malone15and Sundmacher and Kienle16give updated summaries
in regard to the concept, design, and control aspects. However, the multifunctional nature of the reactive distillation complicates the already very nonlinear nature of either reaction or separation. Thus, the dynamics and control of reactive distillation are less obvious, as compared to its single functional unit counterparts. The past decade has seen a steady growth in the number of papers that involve control of the reactive distillation column, from a mere a handful to more than a dozen papers. Roat et al.,17 among the first, proposed a two-temperature control
structure for an industrial column in which two fresh feeds are
manipulated by two tray temperatures and the reaction consid-ered is the methyl acetate production with a reversible reaction with two reactants and two products (i.e., A + B T C + D). Luyben and co-workers propose eight control structures for the “neat” reactive distillation (CS1- CS718,19and CS7 and CS820).
Linear and nonlinear control of semibatch reactive distillation for ethyl acetate production has been explored by Engell and Fernholz21and Vora and Daoutidis.22Nonlinear estimation and
control of a two-stage reaction has been studied by Gru¨ner et al..23Linear proportional-integral (PI) temperature control has
been explored.24,25
The identification methods for such highly nonlinear pro-cesses are not studied as well. From the literature, several approaches have been used to determine controller parameters. Sneesby et al.26 have used step changes to find a model for
inferential control, followed by trial-and-error tuning. Vora and Daoutidis22 have made step disturbances to understand
two-time-scale behavior followed by small step changes to determine settings for a simplified physical-model-based controller. Gruner et al.23derived model parameters for step tests for a nonlinear
observer. Tian et al.27use step tests to devise a first-order plus
dead-time model, followed by nonlinear transformation for approximated linear behavior. Khaledi and Young28 use step
responses models for model predictive control (MPC). Relay feedback tests have been used by Luyben and co-workers,18-20
Olanrewaju and Al-Arfaj,29 and Huang et al.24 Engell and
Fernholtz21 used the pseudo-random binary signal (PRBS) to
find transfer function matrix.
The objective of this work is to explore the nonlinear dynamics of reactive distillation and show the effectiveness of the relay feedback test for the identification dynamic model for control system design. The remainder of this paper is organized as follows. Methyl acetate reactive distillation is described in section 2, where process nonlinearity is also examined. Section 3 shows the dynamic behavior under step and relay feedback tests, and the importance of control structure design for single-variable and multisingle-variable systems are explored. Conclusions are drawn in section 4.
* To whom correspondence should be addressed. Fax: +886-2-3366-3037. E-mail: [email protected].
10.1021/ie0514105 CCC: $33.50 © 2006 American Chemical Society Published on Web 04/21/2006
2. Methyl Acetate Reactive Distillation
Consider the methyl acetate (MeAc) reactive distillation system. The esterification of the acetic acid (HAc) with methanol (MeOH) can be expressed as
A pseudo-homogeneous model is used for the rate expression
where mcatis the catalyst weight (in kilograms), k1is the forward
rate constant, and k-1is the rate constant for the reverse reaction
(with units of kmol/(kgcat-s). The parameter ai represents the
activity of component i. The rate constants are taken from Tang et al.:30
and
This corresponds to an equilibrium constant of 17 at 363 K. The vapor-liquid equilibrium (VLE) is described by the UNIQUAC activity coefficient model with the Hyden-O’Conell second virial coefficient, to account for the acetic acid dimer-ization in the vapor phase. In this work, all the results are obtained from steady-state and dynamic simulations using Aspen Plus and Aspen Dynamics programs. The reactive distillation column of Tang et al.30is studied here. This is a 38-tray column
with 34 reactive trays, 3 stripping trays, and 1 rectifying tray, as shown in Figure 1. Tops and bottoms product purities are held at 98 mol %. The light reactant (MeOH) is fed to tray 13 (counting the tray number from the bottom upward) and the heavy reactant (HAc) is introduced to tray 36. Note that these two trays lie inside the reactive zone (but not on the top and bottom of the reactive zone). The composition profile in Figure 2 indicates that we are separating MeOH/H2O in the stripping
section and MeAc/HAc in the rectifying section. This clearly shows the advantage of the reactive distillation by reacting away the heaviest acid toward the bottom part of the reactive zone and consuming the light alcohol toward the upper part of the reactive zone. This makes the separation easy by designing the composition for the stripper and the rectifier. Thus, high-purity MeAc and H2O can be obtained in the top and bottoms of the
column. Also note that the fraction of total conversion in the Figure 1. Process flowsheet and multivariable control structure for the methyl acetate (MeAc) reactive distillation column.
Figure 2. Composition profiles in MeAc reactive distillation column (Ri/Rtotindicates the fraction of total conversion on the ith tray).
acetic acid + methanol 798
k1
k-1 methyl acetate + water (1)
r ) mcat(k1aHAcaMeOH- k-1aMeAcaH
2O) (2)
k1) 2.961 × 10⁴exp
(
-49190RT
)
k-1) 1.348 × 10⁶exp
(
-69230reactive zone (the shaded area in Figure 2) reveals that 95% of the total conversion occurs in∼10 reactive trays from a total of 34 reactive trays.
Generally, there are three degrees of freedom in the column, if the feed ratio is allowed to vary. Typically, the reflux ratio is fixed and we have two manipulated variables associated with the MeAc reactive distillation column (according to Hung et al.31). One is the feed ratio (FR), which is used to maintain the
stoichiometric balance, and the other is the heat input (QR),
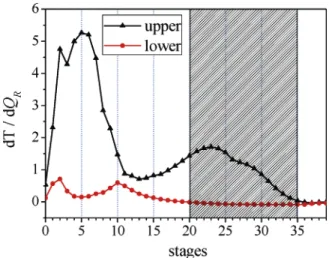
which controls the product purity at the column base. Initially, we assume that the feed ratio is controlled perfectly and this leaves us a single-input-single-output (SISO) system with the heat input as the manipulated variable. The assumption is relaxed and the behavior for a multivariable control system is explored. Figure 3 reveals the nonlinearity of the MeAc reactive distil-lation column. As QRvaries from -5% to +5%, the upper and
lower bounds of the steady-state gains of tray temperatures are shown in Figure 3. For a truly linear system, the upper and lower bounds clearly should coincide with each other. Figure 3 shows that MeAc reactive distillation columns exhibit strong nonlinearity and, moreover, the “sign reversal” is also observed, as indicated by the shaded area in Figure 3 (ranging from tray 20 to tray 35). The term “sign reversal” means that the steady-state gain of a specific tray temperature changes sign as the magnitude of the manipulated variables varies. Thus, we have a nonlinear process with “input multiplicity”.32-34 The term
“input multiplicity” implies the existence of more than one steady-state solution when the output is specified. This phe-nomenon can be found in chemical reactors, continuous fer-menters, and distillation columns. As noted by several au-thors,15,19 the MeAc system exhibits the input multiplicity.
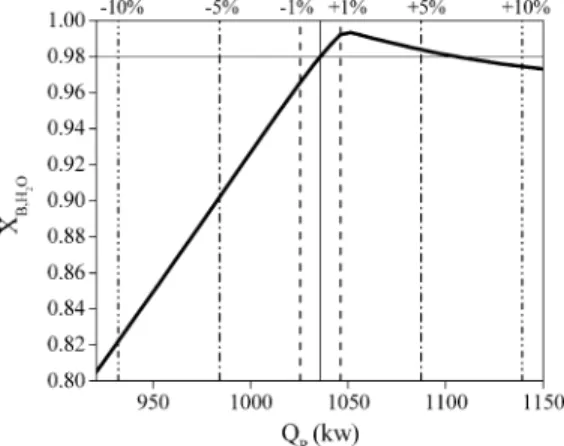
Figure 4 clearly shows that the heat-input changes result in the input multiplicity in the top and bottoms product composition, xD,MeACand xB,H2O, as well as the tray temperatures. The nominal
steady state is indicated by the vertical dashed line in Figure 4. From the separation perspective, an increase in the heat input Figure 3. Upper and lower bounds of steady-state gains of all tray
temperatures for (5% reboiler duty changes (areas of “sign reversal” are shaded).
Figure 4. (A) Trends of product compositions and temperature responses for a range of change in the manipulated variables (heat input) and nominal design (indicated by the dashed line). (B) Expanded view for changes of (0.1%.
will enrich the bottoms product, but Figure 4 indicates that H2O composition goes through an increase, followed by a
decrease. Similarly, the top product composition (MeAc) also shows nonmonotonic behavior as the heat input changes. If the tray temperature is selected appropriately, e.g., T2 and
T11, the multiplicity problem disappears, but if the
tempera-ture control tray is poorly selected, e.g., T27, we have a
much severe problem. It is also noted here that if we focus only on the immediate vicinity of the nominal steady state (e.g., ( 0.1%), the system behaves almost linearly, as shown in Figure 4B. In the next section, we will use single-loop control (i.e., the bottoms composition, xB,MeAc), and temperatures (T2)
control, to illustrate the identification problem associated with this nonlinear system, followed by a multivariable control study.
3. Dynamic Analysis
3.1. Composition Control. As mentioned previously, the
reflux ratio and feed ratio are fixed, and this leads to a SISO control system. Consider the case where the bottoms composi-Figure 5. Bottoms product compositions (xB,H2O) for a range of changes
in the heat input (changes of (10%).
Figure 6. Responses of the bottoms product composition (water, acetic acid, and methanol) and the total reaction rates for heat input (QR) step changes with
tion (xB,H2O) is controlled by the heat input (QR). Step changes
in heat input are made with a magnitude of (1%, (5%, and (10%. Steady-state analysis reveals that, as the heat input increases, bottoms composition increases initially, reaches a maximum value (a change of approximately +1%), and then decreases as shown in Figure 5. In the decreasing side of the heat input, relatively linear behavior is observed up to a -10% QRchange. The top graph of Figure 6 shows the step responses
of H2O composition for positive and negative heat-input changes
and, as predicted from steady-state analysis, the negative step changes follows a first-order response with small difference in the steady-state gain (Table 1). However, very asymmetric step responses are observed, especially for positive step changes. For a +1% step change in QR, a first-order response is evident,
despite somewhat of a different gain from the negative counterpart. However, for a +5% step change, an underdamped behavior with 360% overshoot is observed and the steady-state gain is only1/
20th of its positive-step counterpart. Even worse,
for a +10% step change, we have an inverse response and the sign of the steady-state gain is the opposite of its negative-step counterpart. Therefore, the model that is identified really is dependent on the direction of the step and the magnitude of the change. For the ranges investigated ((10%, which is typical in an operating environment), the model varies from a first-order system, to an underdamped system, then, to a system with inverse response with sign change in the steady-state gain.
This is indeed a highly nonlinear process and, as the heat input increases, one of the zeroes seems to move from the left-half-plane (LHP) toward the right-half-plane (RHP). One may wonder how could a reactive distillation exhibit such a degree of nonlinearity. Actually, Figure 6 offers some physical insight. Recall that a reactive distillation performs a reaction as well as a separation in a single unit. As the heat input increases, initially, the temperature effect leads to an increase in the total reaction rate (see∆Rtotal in the bottom graph of
Figure 6). However, the separation effect moves two
intermedi-ate boilers (methanol and wintermedi-ater) toward the middle of the column and the heavy key (acetic acid) downward, which is unfavorable for the reaction. The slow composition effect eventually leads to a reduction in the total reaction rate, especially for the size of changes larger than 5%. This results in an increase in the acetic acid composition when the step size is >5% (see Figure 6). For a negative step change, both the temperature and composition effects are not favorable for the reaction and this gives a consistent result in the steady-state behavior as well as the dynamic behavior. In summary, this characteristic is caused by competing physical effects on the output variable.
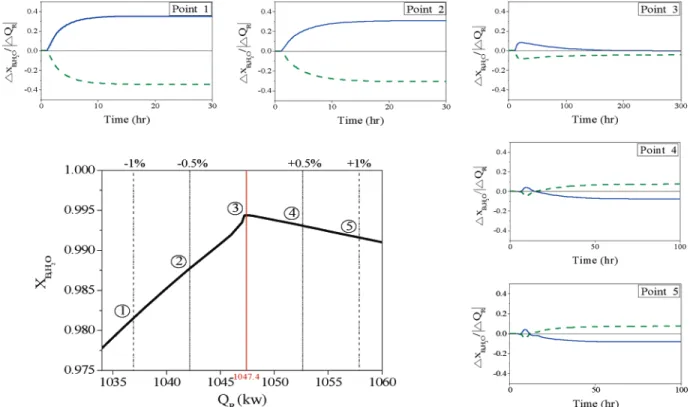
Mathematically, this is manifested through a process zero that crosses the imaginary axis when the steady-state gain changes sign as stated in the lemma of Sistu and Bequette:32If the
open-loop steady-state gain of a SISO nonlinear system changes sign in an operating region, then there is at least one zero of the linearized process crossing the imaginary axis under the following assumptions: (a) there is no simultaneous change in the relatiVe order of the linearized process, and (b) the linearized process dynamics are described by a strictly proper transfer function with at least one finite zero. Although the assumptions are not restrictive in several chemical processes, we are not absolutely certain whether they are met for the MeAc reactive distillation system. Thus, a computer experiment is performed on the reactive distillation to ensure the behavior of the zero crossing the imaginary axis. Small step changes are made on five different operating points, which have different signs in the steady-state gains (Figure 7). At operating points 1 and 2, monotonic step responses are observed with positive steady-state gains. As we reach the top of the hill (point 3), the steady-state gain becomes almost zero and this implies that we have reaches the imaginary axis. A further increase in the heat input results in inverse response with a negative steady-state gain, as shown in points 4 and 5 of Figure 7. This experiment confirms that the zero crosses the imaginary axis as the result of input multiplicity.
The question then becomes: what will be a more reliable identification method for nonlinear system with input multiplic-ity? Before getting into the proposed approach, let us analyze the potential problem in the open-loop test, e.g., the step test. Note that the process is operated at the point (indicated by the solid line in Figure 5) with a better economical incentive (smaller heat input) and, from a control perspective, we have a positive steady-state gain. A positive step change with a step size of >1% transfers the process from the minimum phase region to the non-minimum phase region and the step responses in Figure 6 indicate the transition. This is not desirable, because we meant to identify the linearized model at the minimum phase region. Thus, a closed-loop test is more suitable for identifica-tion. The relay feedback autotuning is explored here. Consider the cases of the relay height of 1% and 5% with positive and
negative initial directions. Rather symmetric sustained oscilla-tions are observed. The results indicate that consistent informa-tion in the ultimate gain and ultimate period can be obtained for all possible variations, as shown in Table 1. The range of error for ultimate gain and ultimate period is <2% and <1%, respectively. On the other hand, Table 1 also indicates that the results of the step tests are rather inconsistent and the steady-state gain varies from 0.082 to 1.56 with the process charac-teristic changing from an overdamped system to an under-damped system. For an even larger magnitude of change ((10%), inverse responses can be seen for a +10% heat input change and there exist two possible switching point for the relay (points 1 and 2 in Figure 8A). For a linear system with inverse response, the correct switching point should be point 2, because it gives the correct information on the sign of the process. However, this is a nonlinear system with input multiplicity and the sign of the nominal operating point is positive and, more importantly, the step response shown in Figure 8 is simply the transition from the minimum phase region to the nonminimum phase region, not the true process behavior in the vicinity of the operating point. In other words, it should not be viewed as a system with nonminimum phase behavior and the relay should be manipulated according to the sign of the process. Figure 8B reveals that a successful limit cycle is generated when the relay is switched at point 1 and Figure 8C indicates that the relay feedback test fails to generate sustained oscillation if we make the switch at point 2. This is exactly the opposite from what has been known for a truly linear system (see Shen et al.35)
and the reason for that is quite obvious: do not mistake the transition to be local linear behavior. More importantly, the result shows that the relay feedback is a reliable to identify process model for nonlinear system with input multiplicity, provided with knowledge about the sign of the steady-state gain (it should not be missed). Figure 8D reveals that almost the same result can be obtained if the relay makes a negative switch initially.
After correct ultimate gain and ultimate frequency become available, the PI controller is tuned using the Tyreus-Luyben setting (i.e., Kc ) Kcu/3 andτI ) 2Pu). Figure 9 shows good
Figure 8. (A) Step responses of xB,H2Ofor (10% QRchange showing inverse responses, (B) relay feedback test of xB,H2O-QRwhen switching at point 1 (+10% QRstep initially), (C) relay feedback test of xB,H2O -QR when switching at point 2 (+10% QR step initially), and (D) relay
feedback test of xB,H2O-QR when switching at point 1 (-10% QR step initially).
Table 1. Sequential Identification Results of Relay Feedback Tests and Step Responses with Different Initial Directions and Magnitudes in the Input Starting from the xB,H2O-QRLoop to the T11-∆FR Loop
Relay Step Response
∆QR
(%) ∆FR(%) Kcu Pu(h)
steady-state
gain remark
Step 1: xB,H2O-QRManipulated, T11-FR Open
+1 22.874 0.266 1.22 first-order response -1 22.937 0.267 1.44 first-order response +5 23.090 0.265 0.082 underdamped (363% overshoot) -5 23.214 0.267 1.56 first-order response +10 23.968 0.264 -0.057 inverse response -10 23.749 0.264 1.58 first-order response Step 2: xB,H2O-QRClosed, T11-FR Manipulated
+1 -7.000 1.924 -1.88 inverse response
-1 -6.969 1.920 -1.93 inverse response
+5 -6.731 1.984 NA unstable response
-5 -6.715 1.976 -0.56 underdamped (25% overshoot)
Step 3: xB,H2O-QRManipulated, T11-FR Closed
+1 24.069 0.264 NA unstable response
-1 24.069 0.264 0.83 underdamped (1.2% overshoot)
+5 24.176 0.262 NA unstable response
control performance and can be obtained as the product composition set point changes to 97 and 99% and product composition settles in less than 3 h. Similar response speeds can also be observed for 5% feed flow disturbances as shown in Figure 10. This is rather good control performance, considering the nonlinearity that is associated with the pro-cess. More importantly, the relay feedback test successfully identifies key process information for controller design, re-gardless of the magnitude and direction applied to the experi-ment.
3.2. Temperature Control. Certainly, the sign reversal
problem can be mitigated by selecting a different control structure. In addition to product composition, tray temperatures are good candidates for controlled variables. The sensitivity and nonlinearity indicator in Figure 3 reveal that the tray 2 temperature (T2) is a quite sensitive to input changes while
maintaining a slightly better linear characteristic, as compared to the temperatures of trays 4-6. Figure 4 also shows that T2
exhibits monotonic behavior as the heat input varies from 700 kW to 1200 kW (the nominal value is 1036 kW). Step changes
in heat input are made with a magnitude of (0.1%, (5%, and (10% (Figure 11). Symmetric step response is observed for the case of change (0.1%, which is only possible with process simulation (cannot be implemented in practice). As the mag-nitude increases, asymmetric responses can be observed and it is obvious that the model structure will be completely different if the model is derived from the positive or negative step changes (e.g.,∆QR ) (5% and (10%). The steady state varies from
0.94 to 5.34 (a factor of 6) as the magnitude changes from -0.1% to +10%. In summary, it is difficult to determine the process transfer function in a reliable manner on the basis of step response data.
The relay feedback test, on the other hand, gives relatively consistent results on ultimate gain and ultimate frequency. Figure 12 shows that the qualitative shapes and quantitative magnitudes of oscillation are almost the same for relay heights of +0.1%, +5%, and +10%. This implies that high-frequency information can be correctly captured using a relay feedback test and it is essential for controller design. Moreover, the shape of the relay feedback indicates that an integrator plus dead time model is Figure 9. Dynamic responses for (0.01 (mole fraction) set-point changes in product composition under composition control.
appropriate to describe high-frequency process characteris-tics.36,37Table 2 shows that, using three different magnitudes
((0.1%, (5%, and (10%) with different initial step directions (positive and negative), the ultimate gain variation is <6% and the ultimate period is off by 3%.
With correctly identified ultimate gain and ultimate period, the PI controller for the temperature loop is tuned using the Tyreus-Luyben setting. Figure 13 shows the step responses for set-point changes of (1°C. Rapid temperature set-point tracking can be achieved (on the order of minutes) and the composition (xB,H2O) dynamics is much slower but it settles in
<5 h, as shown in Figure 13. Moreover, the dynamic responses for positive and negative changes are much more symmetrical, compared to that of composition control (Figure 9). As expected, the composition of the bottoms product increases as we increase the temperature setpoint and it decreases as the temperature set-point decreases. The temperature control can handle much larger feed flow disturbances. For feed flow changes of (20%, again, fast temperature dynamics can be observed, as shown in Figure 14. Similar to set-point changes, the composition dynamics is slightly slower than the temperature one, but it settles in∼5 h.
Unlike the composition control, steady-state offsets can be seen in Figure 14 and, as expected, the product composition decreases as the production rate increases. Again, control-relevant dynamic information can be effectively identified using relay feedback test and this can be conducted in a reliable manner, i.e., different relay heights (0.1%, 5%, and 10%) and different step directions. Rigorous simulation of highly nonlinear reactive distillation column, indeed, confirms that good control can be achieved with the identified ultimate gain and ultimate frequency.
3.3. Extension to Multivariable Control. The previous two
cases illustrate the potential nonlinearity problem associated with system identification in reactive distillation. The importance of control structure selection becomes evident as temperature control is used, instead of composition control. In practice, the feed ratio FR cannot be controlled perfectly and stoichiometric imbalance may result. Generally, the feed ratio FR is adjusted by a feedback mechanism, preferable a tray temperature. This leads to a 2 × 2 multivariable system with two controlled variablessthe tray temperature and the bottoms product compositionsand two manipulated variablessheat input QRand
feed ratio (the ratio of acid flow to alcohol flow, FR). The nonsquare relative gain analysis of Hung et al.31suggests that
the temperature on tray 11, T11, be used for control. This leads
to the following steady-state gain matrix, which is obtained by
making 0.1% perturbation from steady-state simulation:
The relative gain array (RGA) becomes
whereΛ is the RGA. Thus, we have the following pairings: bottoms composition is controlled by heat input, and T11 is
maintained by adjusting the feed ratio FR (see Figure 1). The sequential relay feedback tests of Shen and Yu38are used here.
Initially, the relay feedback test is performed on the fast loop (xB,H2O-QR) with the feed ratio loop open (see Figure 8). As
previously noted, consistent ultimate gain and period can be observed, as opposed to the inconsistency in the step tests (see Figure 6). The PI controller then is tuned using Tyreus-Luyben settings. Next, relay feedback test is performed on the T11-FR
loop with the composition loop closed. For relay heights of (1% and (5%, sustained oscillations are observed (see Figure 15A and 15B) and consistent Kuand Puvalues can be obtained, as
shown in Table 2 (marked as step 2). Note that inverse responses can be seen for (1% and +5% step changes. However, with the knowledge of nominal steady-state gain (negative), correct switches can be made, which results in stable limit cycles. Step tests, on the other hand, indicate even more limited acceptable step size. Figure 15B shows that the step response becomes unstable for a +5% step increase in the feed ratio. The reason Figure 12. Relay feedback experiments of T2-QRfor different magnitudes
of relay height: (A) 0.1%, (B) 5%, and (C) 10%.
Figure 13. Dynamic responses for (1°C set-point changes under temperature control.
Table 2. Identification Results of Relay Feedback Tests and Step Responses with Different Initial Directions and Magnitudes in the Input (QR) for Tray 2 Temperature and Heat Input Loop (T2-QR)a
Relay Step Response
∆QR (%) Kcu Pu(h) steady-state gain remark +0.1 18.481 0.036 5.34 first-order response -0.1 19.551 0.036 4.86 first-order response +5 19.260 0.036 3.09 underdamped (35% undershoot) -5 19.196 0.036 1.56 underdamped (9.7% overshoot) +10 19.068 0.035 1.57 underdamped (18% undershoot) -10 19.620 0.035 0.94 underdamped (16% overshoot)
[
xB,H 2O T11]
)[
1.281 - 0.168 0.874 -1.520][
QR FAcid/FMeOH]
(4) Λ ) QR FAcid/FMeOH xB,H 2O T11[
1.082 -0.082 -0.082 1.082]
(5)Figure 14. Dynamic responses for production rate changes of (20% under temperature control.
Figure 15. Relay feedback test of xB,H2O-QRin step 2 of the sequential relay feedback autotuning and step tests using different magnitudes of relay height: (A) +1% and (B) +5%.
Figure 16. Relay feedback tests of T11-FR in step 3 of the sequential relay feedback autotuning and step tests using different magnitudes of relay height: (A) +0.5% and (B) +1%.
for that is because excess acetic acid drops out the column base and the composition controller fails to maintain the product composition. When the ultimate information is obtained, the PI controller settings for the T11-FR loop are determined. Next,
we go back to the xB,H2O-QRloop with the T11-FR loop closed
(see step 3 in Table 1). Again, relay feedback tests give rather consistent results on ultimate information while the step tests show limited range for stable responses, as shown in Figure 16. For a positive step size of >0.5%, the responses become unstable, as can be seen in Figure 16B. This observation implies that, using any practical step size, step tests may fail and, even
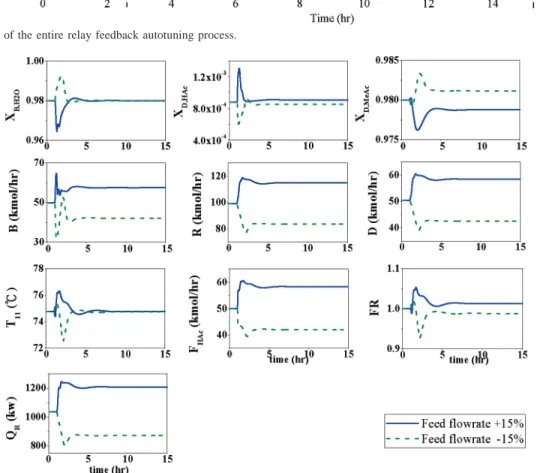
worse, unstable responses may result. Because the difference in the ultimate gain and ultimate frequency between step 1 and step 3 is <5%, we consider the iteration converges. Figure 17 shows the entire autotuning processes. For (15% feed flow changes, fast composition dynamics can be observed, as shown in Figure 18. The dynamics of multivariable control is slightly slower than single-loop control, but it settles around 5 h. It seems easy to obtain acceptable control for this highly nonlinear system using a rather straightforward approach. It should be emphasized here that, if a different approach is taken (for example, using step changes to determine the process model), very likely, Figure 17. Schematic of the entire relay feedback autotuning process.
completely different controller parameters will be obtained and most likely, inconsistent control performance may result.
4. Conclusion
In this work, the effectiveness of two different identification approaches is explored: the relay feedback test and the step test. The multifunctional nature of reactive distillation leads to strong nonlinearity and possible “sign reversal” in the steady-state gain of product composition and some tray temperatures. A methyl acetate reactive distillation is used to illustrate performance of these two identification methods. For the composition control of the bottoms product, step tests indicate sign changes in steady-state gain as the step size varies from -10% to +10%. Moreover, the model structure may vary from a first-order system, to an underdamped system, to a system with the right-hand-plane (RHP) zero. The step test is sensitive to the magnitude and direction of the step. On the other hand, consistent ultimate gain and ultimate period can be obtained for different relay heights with different initial directions. The error in the high-frequency information is <5% for the reactive distillation column studied. Good control performance can be obtained using simple PI controllers, designed based on the ultimate gain and ultimate period. A much improved control structure can be achieved if the tray 2 temperature (T2) is
controlled, instead of composition. The results indicate that consistent high-frequency information can be obtained with the relay feedback test while step tests show direction- and magnitude-sensitive behavior. The resultant proportional-integral (PI) controller, designed based on the ultimate informa-tion, also gives satisfactory performance for set-point and load changes. Finally, when a multivariable control system is implemented, relay feedback autotuning is effective in identify-ing ultimate information and findidentify-ing controller settidentify-ing, while the step tests, on the other hands, show even more limited step sizes for reliable model identification.
Acknowledgment
This work was supported by the Ministry of Economic Affairs (under Grant No. 94-EC-17-A-09-S1-019).
Literature Cited
(1) Åstro¨m, K. J.; Ha¨gglund, T. Automatic Tuning of Simple Regulators with Specifications on Phase and Amplitude Margins. Automatica 1984, 20, 645.
(2) Luyben, W. L. Derivation of Transfer Functions for Highly Nonlinear Distillation Columns. Ind. Eng. Chem. Res. 1987, 26 (12), 2490.
(3) Chang, R. C.; Shen, S. H.; Yu, C. C. Derivation of Transfer Function from Relay Feedback Systems. Ind. Eng. Chem. Res. 1992, 31 (3), 855.
(4) Tan, K. K.; Wang, Q. G.; Lee, T. H. Finite Spectrum Assignment Control of Unstable Time Delay Processes with Relay Tuning. Ind. Eng. Chem. Res. 1998, 37 (4), 1351.
(5) Huang, H. P.; Jeng, J. C.; Luo, K. Y. Auto-tune System Using Single-Run Relay Feedback Test and Model-based Controller Design. J. Process Control 2005, 15, 713.
(6) Marchetti, G.; Scali, C.; Lewin, D. R. Identification and Control of Openloop Unstable Processes by Relay Methods. Automatica 2001, 37, 2049.
(7) Wang, Q. G.; Hang, C. C.; Zou, B. Low-Order Modeling from Relay Feedback. Ind. Eng. Chem. Res. 1997, 36 (2), 375.
(8) Sung, S. W.; Lee, I. B. An Improved Algorithm for Automatic Tuning of PID Controllers. Chem. Eng. Sci. 2000, 55, 1883.
(9) Kaya, I.; Atherton, D. P. Parameter Estimation from Relay Auto-tuning with Asymmetric Limit Cycle Data. J. Process Control 2001, 11, 429.
(10) Leva, A. Model-based Proportional-Integral-Derivative Autotun-ing Improved with Relay Feedback Identification. IEE Proc.: Control Theory Appl. 2005, 152 (2), 247.
(11) Shen, S. H.; Wu, J. S.; Yu, C. C. Use of Biased-Relay Feedback for System Identification. AIChE J. 1996, 42, 1174.
(12) Yu, C. C. Autotuning of PID Controllers, 2nd Edition; Springer-Verlag: London, 2006.
(13) Wang, Q. G.; Lee, T. H.; Lin, C. Relay Feedback; Springer-Verlag: London, 2003.
(14) Malone, M. F.; Doherty, M. F. Reactive Distillation. Ind. Eng. Chem. Res. 2000, 39, 3953.
(15) Doherty, M. F.; Malone, M. F. Conceptual Design of Distillation System; New York: McGraw-Hill: New York, 2001.
(16) Sundmacher, K.; Kienle, A. ReactiVe Distillation: Status and Future Directions; Wiley-VCH: Weinheim, Germany, 2003.
(17) Roat, S.; Downs, J.; Vogel, E.; Doss, J. Integration of Rigorous Dynamic Modeling and Control System Synthesis for Distillation Columns. In Chemical Process ControlsCPC III; Elsevier: Amsterdam, 1986; pp 99-138.
(18) Al-Arfaj, M. A.; Luyben, W. L. Comparison of Alternative Control Structures for an Ideal Two-product Reactive Distillation Column. Ind. Eng. Chem. Res. 2000, 39, 3298.
(19) Al-Arfaj, M. A., Luyben, W. L. Comparative Control Study of Ideal and Methyl Acetate Reactive Distillation. Chem. Eng. Sci. 2002, 57, 5039. (20) Kaymak, D. B., Luyben, W. L. Comparison of Two Types of Two-Temperature Control Structures for Reactive Distillation Columns. Ind. Eng. Chem. Res. 2005, 44, 4625.
(21) Engell, S.; Fernholz, G. Control of a Reactive Separation Process. Chem. Eng. Process. 2003, 42, 201.
(22) Vora, N.; Daoutidis, P. Dynamics and Control of Ethyl Acetate Reactive Distillation Column. Ind. Eng. Chem. Res. 2001, 40, 833.
(23) Gru¨ner, S.; Mohl, K. D.; Kienle, A.; Gilles, E.; Fernholz, G.; Fredrich, M. Nonlinear Control of a Reactive Distillation Column. Control Eng. Pract. 2003, 11, 915.
(24) Huang, S. G.; Kuo, C. L.; Hung, S. B.; Chen, Y. W.; Yu, C. C. Temperature Control of Heterogeneous Reactive Distillation. AIChE J. 2004, 50, 2203.
(25) Chiang, S. F.; Kuo, C. L.; Yu, C. C.; Wong, D. S. H. Design Alternatives for the Amyl Acetate Process: Coupled Reactor/Column and Reactive Distillation. Ind. Eng. Chem. Res. 2002, 41, 3233.
(26) Sneesby, M. G.; Tade, M. O.; Smith, T. N. Two-Point Control of a Reactive Distillation Column for Composition and Conversion. J. Process Control 1999, 9, 19.
(27) Tian, Y. C.; Zhao, F.; Bisowarno, B. H.; Tade, M. O. Pattern-Based Predictive Control for ETBE Reactive Distillation Column. J. Process Control 2003, 13, 57.
(28) Khaledi, R.; Young, B. R. Modeling and Model Predictive Control of Composition and Conversion in an ETBE Reactive Distillation Column. Ind. Eng. Chem. Res. 2005, 44, 3134.
(29) Olanrewaju, M. J.; Al-Arfaj, M. A. Performance Assessment of Different Control Structure for Generic Reactive Distillation Using Linear and Nonlinear Process Models. Ind. Eng. Chem. Res. 2005, 44, 2106.
(30) Tang, Y. T.; Hung, S. B.; Chen, Y. W.; Huang, H. P.; Lee, M. J.; Yu, C. C. Design of Reactive Distillations for Acetic Acid Esterification with Different Alcohols. AIChE J. 2005, 51, 1683.
(31) Hung, S. B.; Lee, M. J.; Tang, Y. T.; Chen, Y. W.; Lai, I. K.; Hung, W. J.; Huang, H. P.; Yu, C. C. Control of Different Reactive Distillation Configurations. AIChE J. 2006, 52, 1423-1440.
(32) Sistu, P. B.; Bequette, B. W. Model Predictive Control of Processes with Input Multiplicities. Chem. Eng. Sci. 1995, 50, 921.
(33) Kuhlmann, A.; Bogle, D. Study on Nonminimum Phase Behaviour and Optimal Operation. Comput. Chem. Eng. 1997, 21, S402.
(34) Perez, H.; Ogunnaike B.; Devasia, S. Output Tracking between Operating Points for Nonlinear Processes: Van de Vusse Example. IEEE Trans. Control Syst. Technol. 2002, 10, 611.
(35) Shen, S. H.; Yu, H. D.; Yu, C. C. Auto-Tune Identification for Systems with Right-Half-Plane Poles and Zeros. J. Process Control 1999, 9, 161.
(36) Luyben, W. L. Getting More Information from Relay Feedback Tests. Ind. Eng. Chem. Res. 2001, 40 (20), 4391.
(37) Thyagarajan, T.; Yu, C. C. Improved Auto-tuning Using Shape Factor from Relay Feedback. Ind. Eng. Chem. Res. 2003, 42, 4425.
(38) Shen, S. H., Yu, C. C. Use of Relay-Feedback Test for Automatic Tuning of Multivariable Systems. AIChE J. 1994, 40, 627.
ReceiVed for reView December 19, 2005 ReVised manuscript receiVed March 25, 2006 Accepted March 27, 2006 IE0514105