以系統動力學模擬機隊委託維護管理之策略與績效
83
0
0
全文
(2) 中文摘要 自 1992 年 Kaplan 與 Norton 合作發展出平衡計分卡以來,受到企業界廣泛地引用,然諸 多的企業在推動平衡計分卡的過程中,出現了一些執行面上的問題,由於企業的因果關 係複雜,常有某部門的績效並非某部門所能控制的現象,因此績效制度並不一定能有效 的發揮改善之作用;例如某些企業只將平衡計分卡當作績效評估的工具,雖然設定了各 部門的關鍵績效指標 KPI,但卻忽略了部門關鍵績效指標與整體企業策略間之間的連動 性,導致部門的目標雖然都達成了,但是企業的整體營運績效並沒有相對獲得提升及改 善。於是 Kaplan 與 Norton 提出了策略地圖的重要性,將企業策略的運用從平衡計分卡 四個構面中所選出的目標、項目間的關係,做了的較清楚描述,是謂「策略地圖」。然 而完善的策略地圖,縱然可以使平衡計分卡從績效評量工具轉化為策略執行工具,讓企 業策略成為具體的指標與行動,然而這二項工具均缺乏動態的方法,及其並無法對於策 略目標和績效指標間的關係進行模擬及分析。因此如果能透過系統動力學這樣的一個動 態的、能修改檢討及進行模擬分析的方法及工具,在策略地圖及目標規劃中,展開平衡 計分卡的衡量項目,藉此建構出基本模型及修正行動和目標的架構,並隨著模擬的時空 及外在環境因素的變化,分析檢討成果,再以假設某些情境的變化,進行多次測試模擬, 以了解所制定的策略規劃目標可能造成之結果,用以擬定因應措施及行動,可做為企業 組織在執行策略目標及績效評估時的依據。 本研究之目的是希望藉由本研究及對個案公司的分析模擬,協助企業在描繪策略地圖及 設定與執行平衡計分卡時,能更明確有效的找出策略的關鍵因素,並進行整體系統式的 思考,配合系統動力學建模方法,對策略及企業系統進行模擬,藉以修正各項策略及 KPI 值,擬定適合組織發展的關鍵績效指標,以期彌補策略地圖對動態回饋環路影響不 足之處,並可藉此訂定完整之績效衡量指標,也期望能於執行時,藉由領先指標的追蹤 及適時的行動修正,找尋最適之績效指標及策略,進一步提升企業整體營運績效與競爭 力。. -i-.
(3) Abstract More and more organizations and enterprises adopt the Strategy Map and Balanced Scorecard(BSC). However, did they really reach their strategy goal or do they have a mature method to assess their performances? When they finish contructing their strategy map and lauching the balanced scorecard, they may face the same problems, such as how to sucessfully implement strategy? How to effectively set up KPI? How to apply the limited resources into the most important strategy? Some researches mention that there is no interactive relationship among BSC, Strategy goal, Performance Indicators, and the actions they took. That is the limit of the current BSC theory. However, it do exists the complicated dynamics relation between the BSC strategy actions and the internal process of organization. Most of the top management only pay attention to the short-term performance and neglect the side effect and unintended consequences caused by the improper actions they took. They even misjudge the feedback information from the wrong messages because of the system delay. Therefore, the whole strategy planning turn out to be imperfect and the effectiveness of promoting strategy goal is not so good as they expected. But if they incorporate the system dynamics method into BSC, then it may resolve the dynamic and complex issue that happen in their system. The purpose of this study is to research and find out the interactive mechanism and method between strategy goal and performance measurement for the enterprises. According to the causal relationship found in the process of establishing the strategy map and examining its various measuring items, construct the system dynamics model and analyze the simulation outcomes. And then find out the driving factors to succeed and the Key Indicators for achieving the strategic goal. In this way, two objectives could be accomplished: (1) Launch and develop the strategy map and Balanced Scorecard, and then utilize the system dynamics to conduct the planning, simulation and test. (2) Through this interactive simulation and test between performance indicators and strategy goal, look for the best key performance indicators and revise the policy actions and strategy. System dynamics is the main approach adopted in this study. By following its modeling procedure, I undertook the data collecting and analyzing for the target company as my case study. And then, conducted the construction, simulation, test, and analysis of system dynamic model. According to the results, I made the conclusions of this study as follows: (1) Within the causal relationship between the strategy goal and performance. - ii -.
(4) measurement items of the BSC, there do exists an influence of side effect and unintended consequences. (2) The simulation outcomes of this system dynamics model could be taken as reference for planning and adjusting the strategy goal of BSC, and also could be the basis of finding out the leading index of the system. (3) Conclude and set up the basic system dynamics model for Balanced Scorecard. Trough this study, we hope that enterprises could adopt the system dynamic to help them improve their long- term integral effectiveness. At last, this study brings up the suggestions and proposes some idea for follow-up research. Keywords: Strategy Map, Balanced Scorecard, System Dynamics, Key Performance Indicator, Causal loop, GOCO, Reliability, Maintainability, Readiness;. - iii -.
(5) Acknowledgement First thing I want to declare is that it is not easy for a non full-time student to finish master thesis, especially doing the research in system dynamics at National Sun Yat-Sen University. In the past three years, I have been through a rough time to conduct my master research on a part time basis. At the second school year, I was introduced to work in Taipei. From then on, I was not able to participate the panel discussion on weekdays. That was really a big loss for my thesis writing progress. It also affected the selection of my thesis topic. Since the wrong topic I chose, I could not incorporate the right data into my system dynamics model. I wasted my time in developing the model that is not approved by Dr. Tu. Then I changed the topic to this current one that is finally accepted and passed the oral test this year. First, two people I have to thank are my thesis advisors, Dr. Yi-Ming Tu and Dr. Chin-Tarn Lee. Without their professional knowledge and attentive direction, I wouldn’t finish doing my dissertation. Secondly, I also want to thank Dr. Liang and Dr. Liu, two members of my thesis oral test committee, to endorse my thesis. Thirdly, I ‘d like to thank Mr. Huang to assist revising my dissertation. At last, I finally found the right way to do research. Moreover, I want to thank my IMBA classmates for their support and encouragement. Lastly I want to thank my wife and my son for their support throughout the three school years -- whatever I was up to. Anthony Chen National Sun Yat-Sen University, IMBA 2006. 07.. - iv -.
(6) Contents 中文摘要………………………………………………………………………………………i Abstract…………………………………………………………………………………….….ii Acknowledgement…………………………………………………………………………….iv Contents………………………………………………………………………………………..v Table List……………………………………………………………………………………...vi Figure List…………………………………………………………………………………….vi Chapter 1 Introduction ...............................................................................................................1 1.1 Research and Motivation .............................................................................................1 1.2 Research Purpose .........................................................................................................3 1.3 Research Flow and Framework ...................................................................................4 1.4 Research Scope and Limitations..................................................................................6 Chapter 2 Literatures Review ....................................................................................................7 2.1 System Dynamics.........................................................................................................7 2.2 Corporation Strategies and Performance Evaluation .................................................14 2.3 Balance Scorecard......................................................................................................16 2.4 Strategic Map .............................................................................................................20 2.5 GOCO ........................................................................................................................22 2.6 Airplane Fleet Maintenance Management .................................................................24 Chapter 3 Construct Strategy Map & Balanced Scorecard......................................................25 3.1 The process of planning and measuring on the dynamic corporate strategic goal ....25 3.2 Constructing Strategy Map and Balanced Scorecard.................................................27 3.3 Construction, test, analysis, and adjustment of the Basic System Dynamics Model.29 Chapter 4 Case Study – AIDC Commercialized Maintenance Program .................................36 4.1 Introduction of the Target Company..........................................................................36 4.2 Data Collecting, Sorting, and Applying.....................................................................39 4.3 Target Company Balanced Scorecard Development & System Dynamic Model......44 4.4 System Dynamics Model of the Target Company with Feedback Loop ...................54 4.5 Model Scenario Constructing—Extreme Test ...........................................................64 Chapter 5 Conclusions and Suggestions ..................................................................................70 5.1 Research Discoveries and Conclusions .....................................................................70 5.2 Contribution to Managerial Practice..........................................................................72 5.3 Research Constraints and Follow-up proposition ......................................................73 5.3 Research Constraints and Follow-up proposition ......................................................73 References................................................................................................................................74. -v-.
(7) Table List Table 4.1 Data Collection from October 2003 to March 2006…………………….…………40 Table 4.2 Correlation of Reliability To Readiness…………………………………………...42 Table 4.3 Correlation of Usage Rate To Total Maintenance Hours………………………….43 Table 4.4 Correlation of Mission Effect To Usage Rate……………………………………..44 Table 4.5 Balanced Scorecard of the Target Company………………………………………45 Table 4.6 Scenario Extreme Test…………………………………………………………….65 Figure List Figure 1.1 Research Flow……………………………………………………………………. 7 Figure 2.1 Sterman’s Modeling Process………………………………………………..……13 Figure 2.2 Dr. Tu’s Modeling Procedure………………………………………………..…...14 Figure 2.3 Forrester’s Modeling Procedure………………………………………………....15 Figure 2.4 The Structure of transforming Strategy to Operation from BSC………………...19 Figure 2.5 Kaplan & Norton’s Strategy Map…………………………………………….….21 Figure 3.1 The Procedure of enterprise’s Strategic Goals Planning & Measurement………31 Figure 3.2 Organization Value Creating Process…………………………………………....32 Figure 3.3 dynamic behavior mode -Goal Seeking………………………………………….37 Figure 3.4 The Reference Model of Performance Measurement and Policy Action………..37 Figure 3.5 The Basic Wire Flow for the Four Perspectives of BSC…………………….…..39 Figure 4.1 Commercialized Maintenance Program Organization Chart…………………....43 Figure 4.2 Management Objective Values of the Target Company…………………….…..44 Figure 4.3 Intuitive Strategy Map of the Target Company………………………..………..51 Figure 4.4 Intuitive System Dynamics Model of the Target Company / Wire Flow……….52 Figure 4.5 Outcome Plot of 6 Indices for Intuitive Model of the Target Company………..54 Figure 4.6 Outcome Plot of 3 Indices for Intuitive Model of the Target Company………..54 Figure 4.7 Strategy Map of the Target Company with Feedback Loop……………………55 Figure 4.8 Causal Feedback Loop Diagram for the Model of the Target Company……….56 Figure 4.9 Flow Wire Diagram of the Model of the Target Company with Causal Feedback Loop…………………………………………………………………………………………57 Figure 4.10 Outcome Plot of 6 Indices for the model with causal feedback loop………….64 Figure 4.11 Outcome Plot of 4 Indices for the model with causal feedback loop………….64 Figure 4.12 Outcome Plot of 6 Indices for the model in Steady State test…………………65 Figure4.13 Outcome Plot of 6 Indices for the model in Steady State test………………….66 Figure 4.14 Outcome Plot of 6 Indices for the model in Reverse Policy test………………67 Figure 4.15 Outcome Plot of 6 Indices for the model in Prolong Period test………………68. - vi -.
(8) Chapter 1 Introduction In order to reach the strategic goal, enterprises top management usually set up the action schemes and the performance measurement indicators. Through this process, they hope to manage and trace the progress of achieving the strategic goal and monitor the performance of corporation. However, is this straightforward idea, especially in this modern environment, a perfect one? From the view point of the system thinking, referred to the Fifth Discipline (Peter Senge, 1990), is there any better interactive mechanism between the strategic goals and performance measurement indicators?. 1.1 Research and Motivation 1.1.1 Background Under the environment of complicated and dynamic competition nowadays, no matter what sector in the world, all need to face the challenge that change fast in the science and technology, economy, society or organization. How enterprises quickly response to these challenge has become an important topic. Balanced scorecard, developed by Kaplan and Norton, have been widely quoted by the business sectors Since 1990, It has not only been evaluated by " Harvard Business Review ", hosted by Harvard Business School, as one of the most influential management model in the past 75 years, but also been adopted and implemented by the majority of the global famous enterprises. Over half of the North American enterprises, and many corporations and NPO in rest of the world, including Taiwan, adopt it and take it as “strategy implementing “and “performance assessment” tool. Although many enterprises are implementing the balanced scorecard, one question has arisen, that enterprise's causality is much complicated than they expected. The performance of one department often can't be controlled by itself. For example, some enterprises only establish the key performance Indicator (KPI) for every department directly, regarding the balanced scorecard as the performance assessment tool. But they neglect the interrelationship among all departments. The KPI of each department must to be linked to the whole enterprise goal. Even part of departments reached their goals, but the whole operation performances of enterprises have not been improved, let alone the corporation strategic goal. Therefore, Kaplan and Norton proposed the importance of the strategy map, use the causality among the strategic goal and some items derived from the four perspectives of the balanced scorecard and describe their interrelationship more clearly, known as “ the strategy map “. A. -1-.
(9) good strategy map must have better explanation of the causality of the strategy, After enterprises establish the appropriate goals according to the four perspectives of the balanced scorecard, and then join all goals with the arrow sign, In order to show the causality among them. (Kaplan and Norton, 2003) The so-called perfect strategy map, even though it can turn the balanced scorecard from the performance measurement tool into the strategy carrying out tool, and let the enterprise's strategy become a concrete action. However, these two tools not only lack of the dynamic method, but also fail to simulate and analyze the relation among the strategic goals and performance indices. It is common that when they finished the planning of strategy map and balanced scorecard and put it into practice, they meet the change of the external environment. And then they have to revise it from the beginning. In this way, they can not conduct the analysis and revision right after they found the problem. Although the strategy map is not unalterable, the function of the strategy map should include tracking, carrying out , explaining , stating of the strategy, and need to react fast with the change of the external environment at any time. So we need a dynamic and revisable method to simulate and analyze the process and outcome of conducting the strategy map and target planning. Also, by way of launching the balanced scorecard, we can measure the performance indicators and construct the frame of model. Following the modeling procedure, we can trace the changes of the external environment and analyze the simulation results. Using these outcomes, we may take it as a reference basis to assist enterprise to carry out their strategic goal and assess their performances. 1.1.2 Motivation More and more organizations and enterprises adopt the strategy map and BSC. But, could they really reach the strategy goal and do they have a complete method to assess their performances? When they finish contructing their strategy map and lauching the balanced scorecard, they may face the same problems, such as how to sucessfully implement strategy? How to effectively set up KPI? How to apply the limited resources into the most important strategy? If we can find out and analyze the interactive machenism between enterprise’s strategic goal and performance measurement, then we may help them improve the their whole operation performance and competitiveness.. -2-.
(10) 1.2 Research Purpose The purpose of this study is to research the interaction relationship between strategic goals planning and performance measurement indices when enterprises carry out the Balanced Scorecard. Most of the enterprises use the way of bottom up to determine whether their departments or employee could achieve the corporation’s strategic goal. However, the balanced scorecard use the way of top down to plan the strategic goal and try to find the KPI among those causal relationship. In this way, there are some side effect and unintended consequence happening in the implementing process of strategic goal planning and performance measurement indices constructing. Then, it ends up with “counterintuitive behavior”. This study utilizes System Dynamics to simulate the complex and dynamics problems that happened in the real world and incorporate the four perspectives balanced scorecard into this model. Also try to offer the company that is going to evaluate their performance in an effective way. Enterprises usually neglect the causality that influences each other among the systems while they are pursuing the strategic goal and department's performance. The simulation result of the target company's model in this study shows that the employee's work efficiency improves, then drive the rising of the reliability and declining of the maintainability. The improvement of readiness rate causes the customer satisfaction to be relatively higher, and also increase the utilization rate of airplanes. Increase the utilization rate of airplanes, lead to the scheduled maintenance hours come earlier than regular flight using way, and cause the fatigue of spare parts of airplanes and raise the failure rate. It end up with the increasing in total man-hour of maintenance, then the work loading of the employees is overweight. The overtime expenses rise obviously as well and staff satisfaction declines too, Since the income of the target company in this study is collected in fix firm price, the main strategic goal for the target company is to minimize the operating cost and maximize the profit rate. In this way, it is unable to reach this goal if staff's satisfaction drops and the turnover rate rises. Therefore, we can see that the side effect of improving employee's work efficiency reversely causes the employee's work efficiency even worse than the original situation eventually. The target company should be aware that if maintainability and employee's work loading have not been taken care appropriately, then even tremendously improve employee's work efficiency, it will turn out to be even worse than the original situation eventually. Therefore, the maintainability and employee's work loading of the target company become their leading indices, must put more efforts on them.. -3-.
(11) 1.3 Research Flow and Framework The framework of this thesis is based on the following procedure, Figure 1.1. ,and set up a basic model. Also take practical instances as the reference basis while constructing the scenario. With the simulation software of systematic dynamics available for now, then apply the data collected from the specific target company into the model, Here, this study ran 5 years simulation, and then implement data analysis according to the results of simulation.. -4-.
(12) 1. Preface and Introduction Describe the background, motivation, and purpose of this research. State the structure of this thesis and its scope and restrictions of the procedure and research.. 2. literature Review Review and extract the relevant documents and reports of System Dynamics, Strategy Maps and Balanced Scorecard, GOCO, and Airplane Fleet Maintenance Management.. 3. The design and description of the dynamic method to launch the Balanced Scorecard from Strategy Maps. State the process and way of constructing the Strategy Maps and Balanced Scorecard. And describe the procedure and way of setting-up, testing, analyzing and adjusting of the systematic dynamics model of this research.. 4. Case Study Take the target company as an example to research how did its balanced scorecard work and achieve the strategic goal. And then adapt to the system dynamics model, verify the validity and analyze the test result of the model.. 5. Conclusion and Suggestion State the discovered phenomenon and conclusion of this research. Consider the contribution on managerial real meaning and practice, and state the restriction of this research and suggestion of follow-up study. Figure 1.1 Research Flow. -5-.
(13) 1.4 Research Scope and Limitations (1) The historical data of the target company in this research are limited. Therefore, the application of many parameters and effects, which are unable to properly quantified, must resort to the Table Function, that relate the input data and output data in a way of positive or negative correlation. The assumptions in this study are made in accordance with the validity test of system dynamics, and then they will be revised and feedback to Table Function again to make the model more reliable. (2) The target company in this research is assumed that mainly focus on the maintenance management. Therefore, the logistics issues and supplies acquisition are put aside temporarily. If there is a relevant article or research based on that, then it may combine with that research to make this study more complete. (3) In order to avoid involving the sensitive information, all of the data in this research have been replaced with the fictitious ones. (4) Only one type of aircraft has been discussed in this study for simplicity of modeling.. -6-.
(14) Chapter 2 Literatures Review 2.1 System Dynamics 2.1.1 History System dynamics is a powerful methodology and computer simulation modeling technique for framing, understanding, and discussing complex issues and problems. Originally developed in the 1950s to help corporate managers improve their understanding of industrial processes, system dynamics is currently being used throughout the public and private sector for policy analysis and design. System dynamics was created during the mid-1950s by Professor Jay W. Forrester of the Massachusetts Institute of Technology. Forrester arrived at MIT in 1939 for graduate study in electrical engineering. His first research assistantship put him under the tutelage of Professor Gordon Brown, the founder of MIT's Servomechanism Laboratory. Members of the MIT Servomechanism Laboratory, at the time, conducted pioneering research in feedback control mechanisms for military equipment. Forrester's work for the Laboratory included traveling to the Pacific Theater during World War II to repair a hydraulically controlled radar system installed aboard the aircraft carrier Lexington. The Lexington was torpedoed while Forrester was on board, but not sunk. At the end of World War II, Jay Forrester turned his attention to the creation of an aircraft flight simulator for the U.S. Navy. The design of the simulator was cast around the idea, untested at the time, of a digital computer. As the brainstorming surrounding the digital aircraft simulator proceeded, however, it became apparent that a better application of the emerging technology was the testing of computerized combat information systems. In 1947, the MIT Digital Computer Laboratory was founded and placed under the direction of Jay Forrester. The Laboratory's first task was the creation of WHIRLWIND I, MIT's first general-purpose digital computer, and an environment for testing whether digital computers could be effectively used for the control of combat information systems. As part of the WHIRLWIND I project, Forrester invented and patented coincident-current random-access magnetic computer memory. This became the industry standard for computer memory for approximately twenty years. The WHIRLWIND I project also motivated Forrester to create the technology that first facilitated the practical digital control of machine tools. After the WHIRLWIND I project, Forrester agreed to lead a division of MIT's Lincoln Laboratory in its efforts to create computers for the North American SAGE (Semi-Automatic Ground Environment) air defense system. The computers created. -7-.
(15) by Forrester's team during the SAGE project were installed in the late 1950s, remained in service for approximately twenty-five years, and had a remarkable "up time" of 99.8%. Forrester's experiences as a manager led him to conclude that the biggest impediment to progress comes, not from the engineering side of industrial problems, but from the management side. This is because, he reasoned, social systems are much harder to understand and control than are physical systems. In 1956, Forrester accepted a professorship in the newly-formed MIT School of Management. His initial goal was to determine how his background in science and engineering could be brought to bear, in some useful way, on the core issues that determine the success or failure of corporations. Forrester's insights into the common foundations that underlie engineering and management, which led to the creation of system dynamics, were triggered, to a large degree, by his involvement with managers at General Electric during the mid-1950s. At that time, the managers at GE were perplexed because employment at their appliance plants in Kentucky exhibited a significant three-year cycle. The business cycle was judged to be an insufficient explanation for the employment instability. From hand simulations (or calculations) of the stock-flow-feedback structure of the GE plants, which included the existing corporate decision-making structure for hiring and layoffs, Forrester was able to show how the instability in GE employment was due to the internal structure of the firm and not to an external force such as the business cycle. These hand simulations were the beginning of the field of system dynamics. During the late 1950s and early 1960s, Forrester and a team of graduate students moved the emerging field of system dynamics, in rapid fashion, from the hand-simulation stage to the formal computer modeling stage. Richard Bennett created the first system dynamics computer modeling language called SIMPLE (Simulation of Industrial Management Problems with Lots of Equations) in the spring of 1958. In 1959, Phyllis Fox and Alexander Pugh wrote the first version of DYNAMO (DYNAmic MOdels), an improved version of SIMPLE, and the system dynamics language that became the industry standard for over thirty years. Forrester published the first, and still classic, book in the field titled Industrial Dynamics in 1961. From the late 1950s to the late 1960s, system dynamics was applied almost exclusively to corporate/managerial problems. In 1968, however, an unexpected occurrence caused the field to broaden beyond corporate modeling. John Collins, the former mayor of Boston, was appointed a visiting professor of Urban Affairs at MIT.. -8-.
(16) Collins had been stricken with polio during the 1950s and, as a result, required an office in a building with automobile access to the elevator level. By chance, Jay Forrester's office was located in such a building and the office next to his was vacant. Collins thus became Forrester's work-day neighbor, and the two began to engage in regular conversations about the problems of cities and how system dynamics might be used to address the problems. The result of the Collins-Forrester collaboration was a book titled Urban Dynamics. The Urban Dynamics model presented in the book was the first major non-corporate application of system dynamics. The model was, and is, very controversial, because it illustrates why many well-known urban policies are either ineffective or make urban problems worse. Further, the model shows that counter-intuitive policies -- i.e., policies that appear at first glance to be incorrect, often yield startlingly effective results. As an example, in the Urban Dynamics model, a policy of building low income housing creates a poverty trap that helps to stagnate a city, while a policy of tearing down low income housing creates jobs and a rising standard of living for all of the city's inhabitants. The second major nonprofit organization application of system dynamics came shortly after the first. In 1970, Jay Forrester was invited by the Club of Rome to a meeting in Bern, Switzerland. The Club of Rome is an organization devoted to solving what its members describe as the "predicament of mankind" -- that is, the global crisis that may appear sometime in the future, due to the demands being placed on the earth's carrying capacity (its sources of renewable and nonrenewable resources and its sinks for the disposal of pollutants) by the world's exponentially growing population. At the Bern meeting, Forrester was asked if system dynamics could be used to address the predicament of mankind. His answer, of course, was that it could. In 1991, three of the original authors of The Limits to Growth redid the study in preparation for the twentieth anniversary of the book's publication. The results were published in a book titled Beyond the Limit. The revised system dynamics model created for the study was called WORLD3-91. Once again, the results presented in Beyond the Limits were consistent with the results presented in World Dynamics and The Limits to Growth, although Beyond the Limits included a significant amount of numerical data that did not exist when the original studies were undertaken. Beyond the Limits also contained a careful presentation of arguments aimed at counteracting the criticisms that were directed at the earlier world modeling books. During the last twenty years, Jay Forrester's attention has been focused primarily in two areas: 1) the creation of a system dynamics model of the United States economy,. -9-.
(17) and 2) the extension of system dynamics training to kindergarten through high school education. Forrester sees the former project as leading to a new approach to economic science and a fundamental understanding of the way macroeconomic systems work. He views the latter project as crucial, not only for the future health of the field of system dynamics, but also for the future health of human society. Although Forrester's national economic model remains unfinished, early and intermediate results have been published. The most noteworthy of the results is that the model generates a forty- to sixty-year economic cycle or "long wave" that not only explains the Great Depression of the 1930s, but also shows that deep economic slumps are a repetitive feature of capitalist economies. At that time, Forrester's model shows that the United States economy is just beginning to rise out of the trough of the latest long wave downturn. Forrester's efforts to extend system dynamics to K-12 education have, in a sense, taken him full circle, as the story begins with his original MIT mentor Gordon Brown. Brown retired from MIT in 1973 and began wintering in Tucson, Arizona. During the late 1980s, Brown introduced system dynamics to teachers in the Tucson school system. The results were remarkable. System dynamics spread, not only through the original junior high in which it was introduced, but through the entire school district. Subjects as diverse as Shakespeare, economics, and physics are today taught in the school district, wholly or in part, via system dynamics. Moreover, the district itself is using system dynamics in an effort to become a learning organization.. - 10 -.
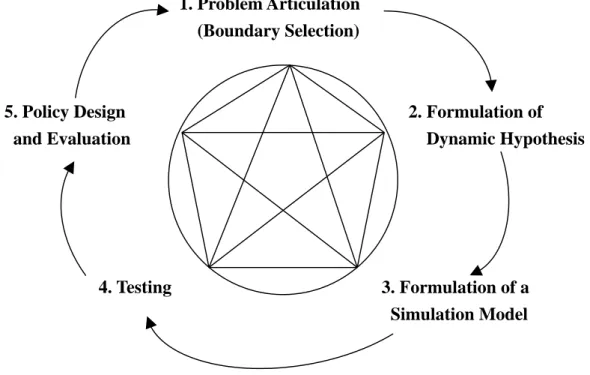
(18) 2.1.2 Modeling Procedure 2.1.2.1 Sterman’s Modeling Process There are 5 steps to construct System Dynamics Model: 1. Problem Articulation (Boundary Selection). 5. Policy Design and Evaluation. 2. Formulation of Dynamic Hypothesis. 4. Testing. 3. Formulation of a Simulation Model. Figure -2.1 Sterman’s Modeling Process Source: Sterman, John, Buainess Dynamics, 2000, p87.. - 11 -.
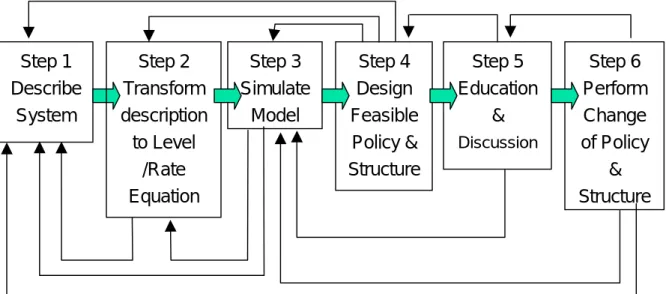
(19) 2.1.2.2 Forrester’s Modeling Procedure There are 6 steps to construct System Dynamics Model:. Step 1 Describe System. Step 2 Transform description to Level /Rate Equation. Step 3 Simulate Model. Step 4 Design Feasible Policy & Structure. Step 5 Education & Discussion. Step 6 Perform Change of Policy & Structure. Figure 2.3 Forrester’s Modeling Procedure Source: Forrester, System dynamics, System thinking, and Soft OR System Dynamics Review, 1994, P245. - 12 -.
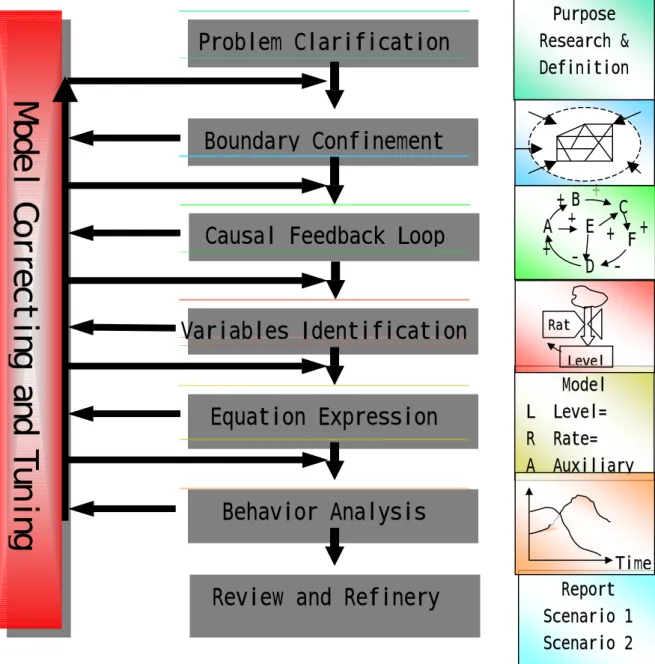
(20) 2.1.2.3 Complete Modeling Procedure There are 8 steps to construct System Dynamics Model:. Purpose Research & Definition. Problem Clarification. Boundary Confinement + +B A + E. Causal Feedback Loop. +. C. + F+ D -. Rat. Variables Identification. Level. Equation Expression. L R A. Model Level= Rate= Auxiliary. Behavior Analysis Time. g n i n u T d n a g n i t c e r r o C l e d o M. Review and Refinery. Report Scenario 1 Scenario 2. Figure -2.2 Complete Modeling Procedure Source: Originated by Forrester, Dr. Tu’s Class Handouts, System Simulation and Dynamics Decision Making, 2003. - 13 -.
(21) 2.2 Corporation Strategies and Performance Evaluation 2.2.1 Performance Evaluation The nature of the performance assessment serves as a function of control in the management activity. If you want to control, then you need to assess. In many researches, the definition of performance assessment is made and concluded as the following statement; It is a system that in order to achieve the enterprises goal, every management and workers must make their the efforts to reach the goal, and the results and any activities have to be assessed and evaluated. The assessment and evaluation are used to be the basis for the rewards and punishments. However, a intact performance assessment, not only examine the staff's performance in the past, but also help the staff to grow up and make progress. So the performance assessment becomes the key criterion of enterprise activity and operation. The staffs, as the member of the organization, know how to behave themselves. Performance, Including the efficiency and effectiveness, is the measurement index of the integral. Performance assessment is the process of reaching the goal to what extent. The performance assessment is to assess resources devoted in the past and how the efficiency and efficiency used. And regard it as the principle of resources allocation for the business activities in the future. So the performance assessment is also used to seek ' the chance ' for the enterprise in the future through ' the afterward control '. It can be divided into staff's performance assessment and organization performance assessment for the whole and individual respectively. The former is feedback systems of staffs, while the latter is the organizational administrative system. 2.2.2 Performance Measurement and KPI, Key Performance Indicators KPI is used to measure the competitive strategy for enterprises, whether the strategy and management performance are really reached. It is also a plan of promoting enterprise to be omni-directional one. KPI is a peculiar idea in the balanced scorecard. No matter how to choose the corresponding KPI in the strategic goals, or goal value, for most enterprises, it is a whole new subject and challenge. Introduce KPI into enterprises should follow the following steps and principles: a. The steps of forming KPI: (1) Find out the perspectives of performance measurement, and set up the individual measurement item. (2) Determine the weight of the individual measurement item. (3) Set up the basic value of the individual measurement item.. - 14 -.
(22) (4) Establish the target value of the individual measurement item. . (5) Finish the scale / ratio of the individual measurement item.. (6) Display and calculate the real index value according to the present performance. b. Assessment basis of KPI: (1) Ensure the enterprises vision link with its strategy. (2) Quantification. (3) Intangibility (4) Easy to understand. (5) Balanced each other. (6) Define clearly. c. The principle and direction of KPI: (1) KPI is in accordance with the principle of importance. It can be a basis of operation, executive's concern or all that happen on ordinary days. (2) KPI is correlated with all working items. (3) The information sources of KPI, can be confirmed by each functional department.. - 15 -.
(23) 2.3 Balance Scorecard 2.3.1 History A new approach to strategic management was developed in the early 1990's by Dr. Robert Kaplan (Harvard Business School) and David Norton. They named this system the 'balanced scorecard'. Recognizing some of the weaknesses and vagueness of previous management approaches, the balanced scorecard approach provides a clear prescription as to what companies should measure in order to 'balance' the financial perspective. The balanced scorecard is a management system (not only a measurement system) that enables organizations to clarify their vision and strategy and translate them into action. It provides feedback around both the internal business processes and external outcomes in order to continuously improve strategic performance and results. When fully deployed, the balanced scorecard transforms strategic planning from an academic exercise into the nerve center of an enterprise. Kaplan and Norton describe the innovation of the balanced scorecard as follows: "The balanced scorecard retains traditional financial measures. But financial measures tell the story of past events, an adequate story for industrial age companies for which investments in long-term capabilities and customer relationships were not critical for success. These financial measures are inadequate, however, for guiding and evaluating the journey that information age companies must make to create future value through investment in customers, suppliers, employees, processes, technology, and innovation." The balanced scorecard suggests that we view the organization from four perspectives, and to develop metrics, collect data and analyze it relative to each of these perspectives:. - 16 -.
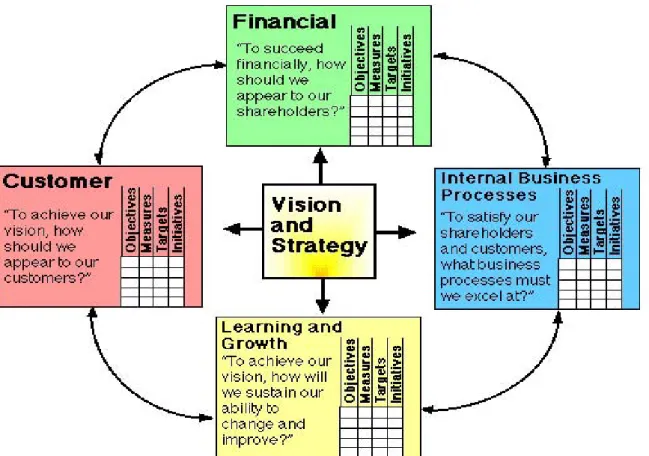
(24) Figure 2.4 The Structure of transforming Strategy to Operation from BSC Source: Kaplan, Robert S., and Norton, David P. The Balanced Scorecard: Translating Strategic Into Action.,1996a. 2.3.2 The Four Perspectives 2.3.2.1 The Financial Perspective Kaplan and Norton do not disregard the traditional need for financial data. Timely and accurate funding data will always be a priority, and managers will do whatever necessary to provide it. In fact, often there is more than enough handling and processing of financial data. With the implementation of a corporate database, it is hoped that more of the processing can be centralized and automated. But the point is that the current emphasis on financials leads to the "unbalanced" situation with regard to other perspectives. There is perhaps a need to include additional financial-related data, such as risk assessment and cost-benefit data, in this category. 2.3.2.2 The Customer Perspective. - 17 -.
(25) Recent management philosophy has shown an increasing realization of the importance of customer focus and customer satisfaction in any business. These are leading indicators: if customers are not satisfied, they will eventually find other suppliers that will meet their needs. Poor performance from this perspective is thus a leading indicator of future decline, even though the current financial picture may look good. In developing metrics for satisfaction, customers should be analyzed in terms of kinds of customers and the kinds of processes for which we are providing a product or service to those customer groups. 2.3.2.3 The Internal Process Perspective This perspective refers to internal business processes. Metrics based on this perspective allow the managers to know how well their business is running, and whether its products and services conform to customer requirements (the mission). These metrics have to be carefully designed by those who know these processes most intimately; with our unique missions these are not something that can be developed by outside consultants. In addition to the strategic management process, two kinds of business processes may be identified: a) mission-oriented processes, and b) support processes. Mission-oriented processes are the special functions of government offices, and many unique problems are encountered in these processes. The support processes are more repetitive in nature, and hence easier to measure and benchmark using generic metrics. 2.3.2.4 The Learning and Growth Perspective This perspective includes employee training and corporate cultural attitudes related to both individual and corporate self-improvement. In a knowledge-worker organization, people -- the only repository of knowledge -- are the main resource. In the current climate of rapid technological change, it is becoming necessary for knowledge workers to be in a continuous learning mode. Government agencies often find themselves unable to hire new technical workers, and at the same time there is a decline in training of existing employees. This is a leading indicator of 'brain drain' that must be reversed. Metrics can be put into place to guide managers in focusing training funds where they can help the most. In any case, learning and growth constitute the essential foundation for success of any knowledge-worker organization. Kaplan and Norton emphasize that 'learning' is more than 'training'; it also includes. - 18 -.
(26) things like mentors and tutors within the organization, as well as that ease of communication among workers that allows them to readily get help on a problem when it is needed. It also includes technological tools; what the Baldrige criteria call "high performance work systems.". - 19 -.
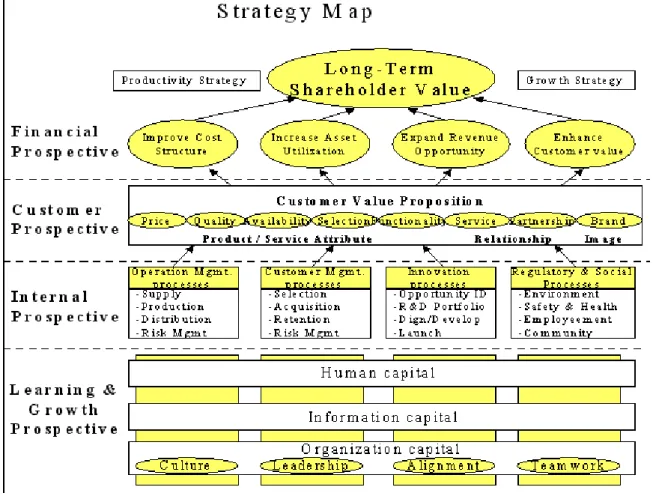
(27) 2.4 Strategic Map 2.4.1 History In the 2001 book "The Strategy-Focused Organization", Kaplan and Norton transform their Balanced Scorecard. In 1992 they introduced the Balanced Scorecard in the Harvard Business Review as system to measure performance; now they change it to a strategic management system. A lot of this transformation was done by further emphasizing the so called Strategy Map. Strategy Maps are diagrams that describes how an organization can create value: by connecting strategic objectives in explicit cause and effect relationship with each other. Via the four Balanced Scorecard perspectives: financial, customer, processes, learning and growth. See the figure below. Strategy Maps are a strategic part of the Balanced Scorecard framework to describe strategies for value creation.. Figure 2.5 Kaplan & Norton’s Strategy Map Source: Kaplan, Robert S., and Norton, David P. Strategy Maps: Converting Intangible Assets Into Tangible Outcomes, 2003. - 20 -.
(28) 2.4.2 Characteristics of Strategy Maps (1) All of the information is contained on one page; this enables relatively easy strategic communication. (2) There are four perspectives: Financial; Customer; Internal; Learning and Growth. (3) The financial perspective looks at creating long-term shareholder value, and uses a productivity strategy of improving cost structure and asset utilization and a growth strategy of expanding opportunities and enhancing customer value. (4) These last four elements of strategic improvement are supported by price, quality, availability, selection, functionality, service, partnerships and brand. (5) From an internal perspective, the operations processes and the customer management processes help to make the product and service attributes. While the innovation, regulatory and social processes help with relationships and image. (6) All of these processes are supported by the allocation of human capital, information capital and organizational capital. Organizational capital is comprised of company culture, leadership, alignment and teamwork. (7) Connecting arrows are describing cause and effect relationships. 2.4.3 Main principles behind Strategy Maps (1) Strategy balances contradictory forces. (2) Strategy is based on a differentiating customer value proposition. (3) Value is added through internal business processes. (4) Strategy consists of simultaneous, complementary themes. (5) Strategic alignment determines the value of intangible assets. 2.4.4 Benefits of Usage of Strategy Maps By connecting such things as shareholder value creation, customer management, process management, quality management, core capabilities, innovation, human resources, information technology, organizational design and learning with one another in one graphical representation, Strategy Maps can help greatly in describing the strategy and to communicate the strategy among executives and to their employees. In this way an alignment can be created around the strategy, which makes a successful implementation of the strategy more easy. No small thing, bearing in mind that often, the implementation of a constructed strategy is the biggest challenge.. - 21 -.
(29) 2.5 GOCO 2.5.1 History Ministry of National Defense (MND) declared that ' if our domestic manufacturer has the ability to support the construction of national armed force, then we will never purchase abroad, including technological transfer and military plant/depot civilization. Based on the principle of the policy, we hope to improve the independency of our domestic industries to support national defense science and techniques. Under the constraint of the national defense budget that may obtain in the future, MND will set the goal of amount of money to plan and promote the following actions: (1) The general military supplies depend on the relevant regulations of ”government's law of purchase”, and all purchase or lease will be done domestically. New arms procurement and newly-increased arms demand will be first processed by Minister of Economic and must be coordinated and resort to all local companies. If it is surely necessary to purchase from outside the country, then it has to be implementing the technology transfer. As to the active served weapon system, MND will first release the non-core and low sensitivity military industries. By promoting the Strategic Commercialization and GOCO to entirely advance the task of committing military assets to privatization. (2) As for the long term ” major privatization project”, the second Air force logistic command (ALC) has already begun to carry out since 2004; Another programs, such as ”light medium-sized carriers”, “Auto-alter frequency radio set” and “ the large-scale guided missile fast boats “ are successively started since 2004 as well. Estimated that the total amount up to about NT$128 billion. (3) The maintenance of all weapon system in the future will be by way of signing the long-term contract and release to the domestic qualified manufacturer. If the purchase abroad is inevitable, then it must be through the industrial cooperative mechanism to introduce the professional technique to our domestic companies in order to establish independent maintenance capacity and improve the equipment readiness effectively. In the last two years, MND has released 24 military items, such as a militants carriers, armor trucks, and some naval vessels, etc. (4) In order to fulfill the GOCO and military factories reforming policy, the Air force has committed the Intermediate-level maintenance work of the existing AT-3 and T-34C trainer flights to AIDC. AIDC is the original design manufacturers of AT-3 model trainer flight and has accumulated long-term maintenance experience. AIDC has been engaging in military airplanes production and cooperating with the government policy for many years. Therefore, AIDC eventually got the five years contract after. - 22 -.
(30) making its efforts to win the public biding procedure and start operating in November 1, 2004. 2.5.2 Scope of Work Maintain the Readiness rate Perform the Planned Maintenance Deal with the Waiting to repair parts Apply Needed Materials Quality Assurance Minimize the Recurrence Failure Manage dismantling and mantling Components Assets transparency Maintenance training Maintenance discipline There are different views and focal point from time to time, from place to place. 2.5.2 Issues that Encounter Weapon system Problem (purchases planning and process incompletely) Manpower is insufficient The specialty does not conform Training is not enough The component / spare shortage (1) Short of budget (2) Lead time too long (3) DMS (4) Configuration amendment (5) Procurement system (6) Organization Reengineering. - 23 -.
(31) 2.6 Airplane Fleet Maintenance Management 2.6.1 Definitions. (1) Scheduled Maintenance: A group of tasks, accomplished at specified intervals, that prevent deterioration of the safety and reliability levels of the aircraft. (2) Unscheduled Maintenance: Resulting from scheduled maintenance, reports of malfunctions, and data analysis, used to restore equipment to acceptable safety and reliability levels. (3) Accountability: For the purposes of this job task, “accountability” refers to the procedures established by the operator to control the issuance and return of completed job cards, non-routine coupons/sheets, and other work forms issued during any maintenance/inspection function. (4) Work Packages: Work packages contain detailed instructions, standards, methods, and techniques for performing a task and may be presented as work forms, job cards, and/or other accepted methods. A work package satisfies accountability and recordkeeping requirements. (5) Readiness: Ready Flights/ Total Fights (6) Reliability: Cumulate Flight Hours/ Total Failure (7) Maintainability: Total Maintenance Hours/ Cumulate Fight Hours (8) Mission Effect: Total Fights Sorties/ Cumulate Planned Fights Sorties (9) Usage Rate: Total Fights Sorties/ Total Flights 2.6.2 Continuous Airworthiness Maintenance Program. (1) Operators operating under Code of Federal Regulations. The total CAMPs must be detailed in the operator’s manual system. The manual(s) must contain specific maintenance and inspection tasks, including methods, standards, and techniques for accomplishing these tasks. (2) There are additional programs required by the regulations, including training programs, continuing analysis and surveillance programs, recordkeeping and reporting systems, etc. These programs are an important part of the total CAMPs and are used to support the maintenance tasks. (3) An approved CAMP establishes the operator as a maintenance entity, and when followed, ensures the continued airworthiness of an aircraft and its equipment. The scheduled maintenance program is derived from the approved requirements stated in the operator’s OpSpecs. The operator must have work forms, job cards, and/or other methods to accomplish the scheduled maintenance program and have manual procedures for implementing each special authorization.. - 24 -.
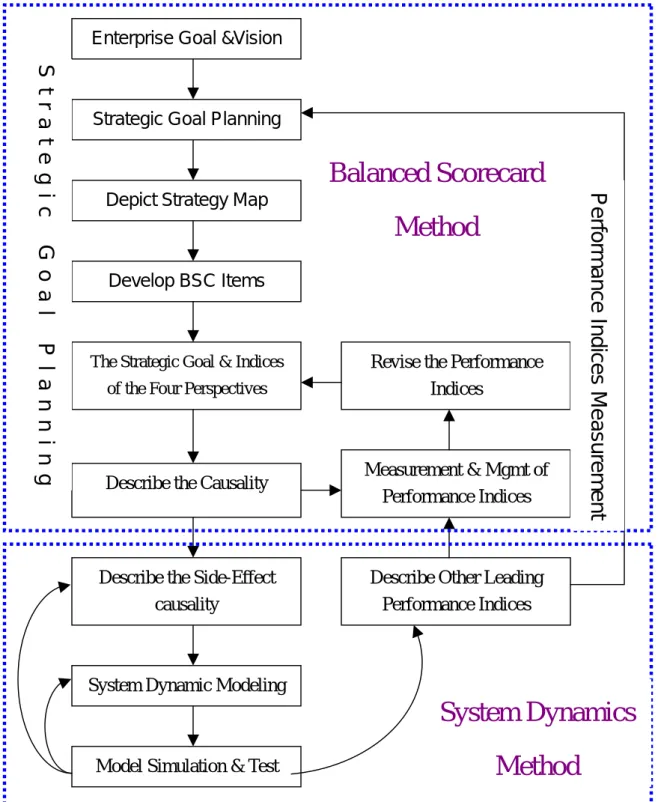
(32) Chapter 3 Construct Strategy Map & Balanced Scorecard This research is attempting to set up a simple procedure and method to help enterprises incorprate the systematic dynamics method into the strategy map and balanced score card. Also hope to find out the main successful factors of driving enterprises grow.. 3.1 The process of planning and measuring on the dynamic corporate strategic goal According to the literautures sorted and extracted in chapter 2, a set of procedure of the planning and design of dynamic enterprise's strategic goals and measurement, depicted in Fig. 3.1, is regarded as the infrastructure of follow-up research of this study. Fig. 3.1 is the infrastructure of the target company applied in this study. The way is to launch the balanced scorecard and find the performance measurement indices from the strategy map, Assist enterprises to set up their own strategy map and describe every step of designing performance measurement indices in balanced scorecard. Then constructing the systematic dynamics model in accordance with the way mentioned above and run the simulation to dynamically test for every performance measurement indices. By constantly observing the result of the simulation, recheck the original model design and tune the corporate strategic plan, and then adjust the performance measurement indices, help the growth of enterprises.. - 25 -.
(33) Enterprise Goal &Vision. Balanced Scorecard Depict Strategy Map. Method G o a l. Develop BSC Items. P l a n n i n g. Revise the Performance Indices. The Strategic Goal & Indices of the Four Perspectives. Describe the Causality. Measurement & Mgmt of Performance Indices. Describe the Side-Effect causality. Describe Other Leading Performance Indices. Performance Indices Measurement. S t r a t e g i c. Strategic Goal Planning. System Dynamic Modeling. System Dynamics Method. Model Simulation & Test. Figure 3.1 The Procedure of enterprise’s Strategic Goals Planning & Measurement Source: Chao-jen Huang, A study on Interaction mechanism between BSC strategy goal and Performance Index, NSYSY, 2005. - 26 -.
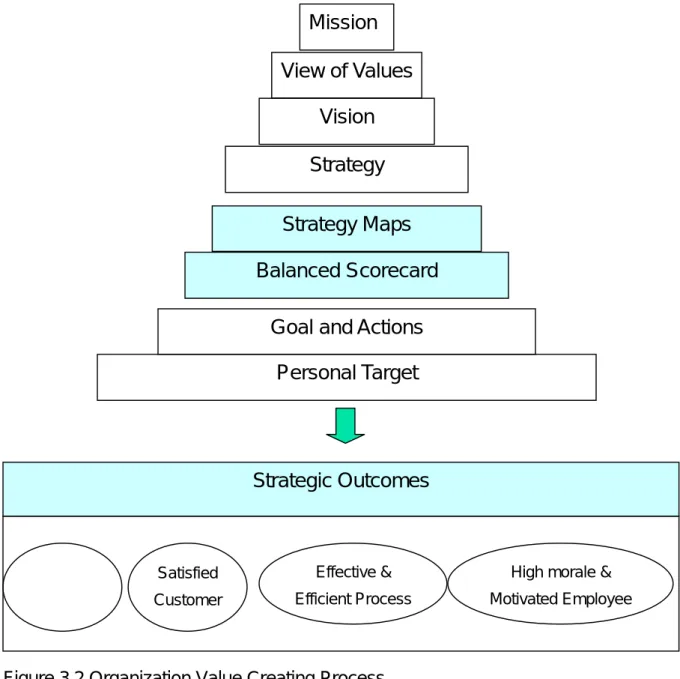
(34) 3.2 Constructing Strategy Map and Balanced Scorecard 3.2.1 Depict the Strategy Map for a corporation. Mission View of Values Vision Strategy Strategy Maps Balanced Scorecard Goal and Actions Personal Target. Strategic Outcomes. Satisfied. Effective &. High morale &. Customer. Efficient Process. Motivated Employee. Figure 3.2 Organization Value Creating Process Source: Kaplan, Robert S., and Norton, David P., Strategy Maps: Converting Intangible Assets Into Tangible Outcomes, 2003. - 27 -.
(35) 3.2.2 Set up the Four Perspectives of Balanced Scorecard Each Perspective has its goals respectively as follows: Financial Perspective Goals (1) Operating Income Improvement and Productivity Promotion (2) Refine Cost Structure (3) Increase Assets Utilization Rate (4) Expand Income Opportunities (5) Reinforce Customer’s Values Customer Perspective Goals (1) Customer Satisfaction (2) Customer Retention (3) Customer Attraction (4) Customer Profitability (5) Market Share (6) Customer Loyalty Internal Process Goals (1) Operation Management Process Improvement (2) Customer Relationship Management Process Improvement (3) Innovative Management Process Improvement (4) Legal Affair & Society Management Process Improvement Learning & Growth Goals – Intangible Assets Protection and Development (1) Human Resource Capital (2) Information Capital (3) Organization Capital. - 28 -.
(36) 3.3 Construction, test, analysis, and adjustment of the Basic System Dynamics Model This research mainly applied the following resources to set up the systematic dynamics model; The first one is the materials in class from Dr.Tu. “the systematic simulation and dynamic decision”. The second one is “Corporate Planning and Policy Design: A System Dynamics Approach”, Lyneis, 1980. The method uesd in this research is to meet and cooperate with the structure of the performance measurement index in balanced scorecard, and then apply the target company into this research. This research uses 4 system dynamics basic flow wire models as the basis of the simulation models, and then carry out the model constructing. (1) The causality of action taken to incorporate the strategic goal and performance measurement indicators to the company policy. (2) The reference model of carrying out the strategic goal and performance measurement indicators to the action taken for company policy. (3) The basic flow wire models according to the four perspectives of balanced scorecard. (4) The feedback loop reference models that include balanced scorecard and the strategic goal and the action taken for company policy. 3.3.1 Setting-up the Foundation of the Systematic Dynamics Model Systematic dynamics is mainly built and constructed in the elements, relationship and their combination. And form the systematic dynamics model through the interactive mechanism. Main elements of the structure of systematic dynamics are: (1) Level : Indicate the thing or material in the real world that accumulate with elapsed time. It represents the system state at the specific time point. It takes shape and has been accumulated by inflow and outflow after a period of time. (2) Rate : Show a certain speed of flow. Namely the flow quatity in unit of time. It directly determines the control point that measures the level state. It is the starting point of making policy and taking action too. (3) Auxiliary variable : Represent three kinds of meanings: Process of information management, some specific environmental parameter values (constant ), systematic test functions or values. The first two can be regarded as a part of quantity of the rate, while the last one is suitable for testing all kinds of situation of the model behaviors.. - 29 -.
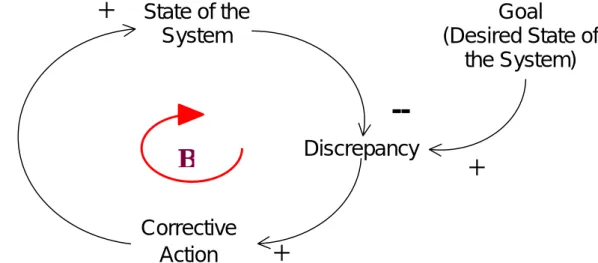
(37) (4) Flow wire: Mean the entity flow or information flow in the whole loop. It is mainly used for transmitting the information in the exchange system and makes the structure of the whole system intact to fulfill the information feedback purpose. In order to meet the cosistency of model constructing, it is necessary to consider the unit of simulation time. it can be second, minute, day, week, month, year. It is not only an important factor for systematic dynamics simulation modeling process, but also important to the result of model analysing and testing. 3.3.2 Basic Systematic Dynamics Model for Balanced Scorecard 3.3.2.1 Fundamental modes of dynamic behavior-- Goal Seeking Mode Change takes many forms, and the variety of dynamics around us is astounding. You might imagine that there must be a correspondingly huge variety of different feedback structures to account for such a rich array of dynamics. In fact, most dynamics are instances of a fairly small number of distinct patterns of behavior, such as exponential growth or oscillation. The most fundamental modes of behavior are exponential growth, goal seeking, and oscillation. Each of these is generated by a simple feedback structure: growth arises from positive feedback, goal seeking arises from negative feedback, and oscillation arises from negative feedback with time delays in the loop. Other common modes of behavior, including S-shaped growth, S-shaped growth with overshoot and oscillation, and overshoot and collapse, arise from nonlinear interactions of the fundamental feedback structures. Positive feedback loops generate growth, amplify deviations, and reinforce change. Negative loops seek balance, equilibrium, and stasis. Negative feedback loops act to bring the state of the system in line with a goal or desired state. They counteract any disturbances that move the state of the system away from the goal. All negative feedback loops have the structure shown in Figure 3.3. The state of the system is compared to the goal. If there is a discrepancy between the desired and actual state, corrective action is initiated to bring the state of the system back in line with the goal. When you are hungry, you eat, satisfying your hunger; when tired, you sleep, restoring your energy and alertness. When a firm’s inventory drops below the stock required to provide good service and selection, production increases until inventory is once again sufficient. Every negative loop includes a process to compare the desired and actual conditions and take corrective action. Sometimes the desired state of the system and corrective action are explicit and under the control of a decision maker (e.g., the desired level of. - 30 -.
(38) inventory). Sometimes the goal is implicit and not under conscious control, or under the control of human agency at all. The amount of sleep you need to feel well rested is a physiological factor not under your conscious control. The equilibrium surface temperature of the earth depends on the flux of solar energy and the concentration of greenhouse gases in the atmosphere, among other physical parameters. And a cup of coffee cools via negative feedback until it reaches room temperature. In most cases, the rate at which the state of the system approaches its goal diminishes as the discrepancy falls. We do not often observe a constant rate of approach that suddenly stops just as the goal is reached. The gradual approach arises because large gaps between desired and actual states tend to generate large responses, while small gaps tend to elicit small responses. The flow of heat from your coffee cup to the air in the room is larger when the temperature gap between them is large and diminishes as the gap falls. When coffee and room temperatures are equal, there is no net heat flow between them. When the relationship between the size of the gap and the corrective action is linear, the rate of adjustment is exactly proportional to the size of the gap and the resulting goal-seeking behavior is exponential decay. As the gap falls, so too does the adjustment rate. And just as exponential growth is characterized by its doubling time, pure exponential decay is characterized by its half life-the time it takes for half the remaining gap to be eliminated. Figure below shows examples of goal-seeking behavior.. +. State of the System. Goal (Desired State of the System). -Discrepancy. B Corrective Action. +. Figure 3.3 System dynamics behavior mode -Goal Seeking Mode Source: Sterman, Business Dynamics, 2003. - 31 -. +.
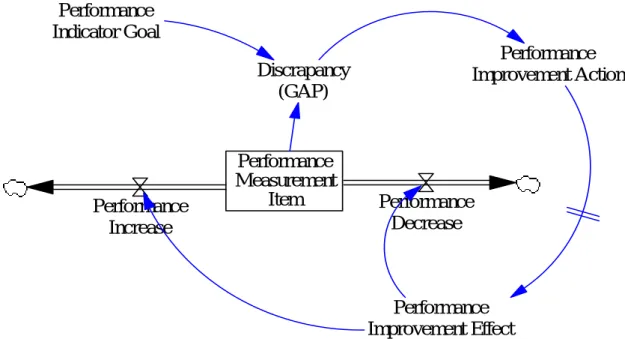
(39) 3.3.2.2 The reference model of strategic goal, Performance Measurement Item and Improvement action Performance measurement Item could be a level variable or a calculated value from an auxiliary variable. By increasing or decreasing the rate variable, adjust the volume of level. As for strategic goal, discrepancy, and policy action, it has to use auxiliary variable to calculate and set up its value. So that it will feedback to rate variable and change the level, the current performance measurement Item condition. The following figure is showing the relationship of these variables.. Performance Indicator Goal Discrapancy (GAP). Performance Increase. Performance Measurement Item. Performance Improvement Action. Performance Decrease. Performance Improvement Effect Figure 3.4 The Reference Model of Strategic Goal, Performance Measurement Item and Policy (Improvement) Action Source: Chao-jen Huang, A study on Interaction mechanism between BSC strategy goal and Performance Index, NSYSY, 2005. - 32 -.
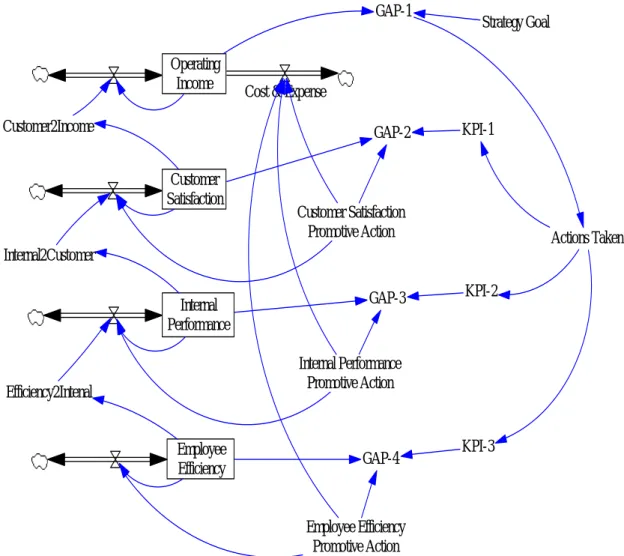
(40) 3.3.2.3 The reference model for BSC with negative feedback loop The following figure indicates the basic system dynamics model for Balanced Scorecard. It could be used to help enterprises construct the basic structure of the model for evaluating performance measurement. GAP-1 Operating Income. Cost & Expense. Customer2Income. GAP-2 Customer Satisfaction. Strategy Goal. KPI-1. Customer Satisfaction Promotive Action. Actions Taken. Internal2Customer GAP-3. Internal Performance. KPI-2. Internal Performance Promotive Action. Efficiency2Intenal. Employee Efficiency. GAP-4. KPI-3. Employee Efficiency Promotive Action. Figure 3.5 The Basic Flow Wire for the Four Perspectives of BSC Source: Chao-jen Huang, A study on Interaction mechanism between BSC strategy goal and Performance Index, NSYSY, 2005. - 33 -.
(41) 3.3.3 Test, Analysis, and Policy Design of the Systematic Dynamics Model Systematic dynamics modelers have developed a wide of variety of specific test to uncover flaws and improve models. Model user must critically assess the model’s boundary, time horizon, and level of aggregation light of their purpose. Therefore, some questions are raised to check the model. What is the purpose of the model? What is the boundary of the model? What is the time horizon relevant to the problem? Does the model include the factors that may change significantly over the time horizon as endogenous elements? Is the level of aggregation with the purpose? Sterman (2000) indicates that the question facing the modelers is never whether a model is true but whether it is useful. The choice is never whether to use the model. The only choice is which model to use. Selecting the appropriate model is always a value judgment to be made by reference to the purpose. Without a clear understanding of the purpose for which the model is to be used, it is impossible to whether you should use it as a basis for action. To avoid the problems with the model, such as violating basic physical law, narrow boundary cutting critical feedbacks, modelers kept the assumption hidden from the readers, and modelers failed to include important stakeholders in the modeling process, you must insist on the highest standard of documentation. The model must be fully replicable and available for critical review. Use the documentation to assess the adequacy of the model boundary and appropriateness of its underlying assumptions about the physical structure of the system and the decision-making behavior of people acting within it. Consider extreme condition tests and sensitivity to alternate assumptions, including assumptions about model boundary and structure, not only sensitivity to variations in parameter values. No one test is adequate. These tests help you understand the robustness and limitations of your model. They involve direct inspection of equations and simulations of the whole model, the assessment of historical fit, and behavior under extreme conditions. Test the robustness of your conclusions to uncertainty in your assumptions. While parametric sensitivity testing is important, model results are usually far more sensitive to assumptions about model boundary, level of aggregation, and representation of decision-making. Testing has been carried on right after the systematic dynamics model constructed. By observing the testing results, analyze and describe the system behavior and consequences. And then discuss the strategic goal design and adjust the relevant performance indicators. The systematic dynamics model must be able to inspect and correct the whole process through repeated simulation. On one hand, it helps top. - 34 -.
(42) management or strategic planners to deeply understand the complicated behavior of the system. On the other hand, it can analyze the procedure and verify the behavior between the results and system structure through rigorous logical reasoning, and then improve the system validity to the certain degree.. - 35 -.
(43) Chapter 4 Case Study – AIDC Commercialized Maintenance Program 4.1 Introduction of the Target Company 4.1.1 Background Aerospace Industrial Development Corporation (AIDC), previously known as the Aero Industry Development Center, was established in 1969 under the authority of Republic of China Air Force, and was later transferred to the Chung-Shan Institute of Science and Technology (CSIST) in 1983. In 1996 in support of national aerospace development objectives, AIDC was transformed from a military establishment into a government-owned company under the authority of the Ministry of Economic Affairs. As a market-oriented commercial entity, AIDC is working in tandem towards commercialization, privatization and globalization. Pursuant with the new company objectives, AIDC's business strategy has turned from products and services for solely military applications to a well-balanced diversified provider to both military and commercial markets. Government's past 30-years support has enabled AIDC to establish a talented human resource base, dedicated to the aviation industry and has equipped AIDC with the expertise and capability in aircraft system integration, aircraft development, parts manufacturing, aircraft assembly and testing. AIDC's excellent achievements have outperformed its competitors in the Asia-Pacific region and have won itself recognition from the global aerospace community as a valuable supplier. When AIDC first became a government-owned company, the major mission was focused on the Indigenous Defensive Fighter (IDF). During the period from years 1996 through 1999, revenues exceeded an annual 25 billion NT dollars. From year 2000, revenues from new commercial activities are expected to increase business to approximately 42.4 billion NT dollars by year 2010. To meet the increasingly competitive environment of the commercial markets, AIDC underwent an organizational restructure in July 2000. This restructuring program divided AIDC into four business units, namely Aerostructures Division, Engine Division, Defense System & Technology Division and Administration Division. Functions are clearly defined, business is strategically oriented, and overall work force is consolidated. AIDC envisions the Asia-Pacific region will play an increasingly vital role in the international aerospace markets in the foreseeable future, and that Taiwan will. - 36 -.
(44) establish itself as a valued partner for international aerospace companies. To assure AIDC's participation, and toward developing self-reliant in defense needs, AIDC recognizes the importance and is actively pursuing development of local industry capability. Following its privatization, AIDC will be well positioned to support and foster the national aerospace development policies. In addition to the core strengths, AIDC shall consolidate its industry capability, and maximize use of existing resources to effectively compete in international aerospace cooperation systems toward achieving a sustainable yet increasing level of participation during which AIDC shall also create an active, optimistic, honest and open business culture in each business segment of AIDC operations. Major Business: (a) Military: Self-development of AT-3 Advanced Jet Trainer, 63A/C. Co-production with Bell Helicopter of UH-1H Helicopter, 118A/C. Self-development of IDF Fighter, 130A/C. (b) Commercial: Co-development with Aero Vodochody of AE-270 Business Jet Wing. Co-development with Sikorsky of S-92 Helicopter Cockpit. Commissioned by Air Bus U.K. of A321 Business Jet 16A barrel. Co-development with Bombardier of Learjet 45 Business Jet Empennage.. - 37 -.
(45) 4.1.2 AIDC/ Commercialized Maintenance Program Organization Chart There are 3 sections below the top management level, and each section has at least 2 subsections. Maintenance Factory dominates the whole population of entire program office.. Program Chairman Program Director. Maintenance Factory. Maintenance Control Subsection AT-3 Aircrafts Maintenance Shop. Quality Assurance Subsection T-34 Aircrafts Maintenance. Supply Mgmt. Section. Program Mgmt. Section. Supply &. Support. Planning. Admin.. Planning. Equipment. Mgmt.. Subsection. Mgmt.. Mgmt.. Subsection. Subsection. Subsection. Inventory. Warehouse. Control Subsection. AT-3 Engine Maintenance Shop. T-34 Engine Maintenance Shop. AT-3 Periodic Maintenance Shop. T-34 Periodic Maintenance Shop. G.S.E Maintenance Shop. Communication & Egress. Maintenance Shop Figure 4.1 Commercialized Maintenance Program Organization Chart. - 38 -.
數據
+7
相關文件
Time constrain - separation from the presentation Focus on students’ application and integration of their knowledge. (Set of questions for written report is used to subsidize
Microphone and 600 ohm line conduits shall be mechanically and electrically connected to receptacle boxes and electrically grounded to the audio system ground point.. Lines in
The algebraic homology functor assigns to a chain complex its sequence of ho- mology groups and to a chain map the induced homomorphisms on homology defines a functor from the
This study represents the concept of balanced scorecard (BSC) with four perspectives (financial, customer, internal business processes, and learning and growth) to build the
Promote project learning, mathematical modeling, and problem-based learning to strengthen the ability to integrate and apply knowledge and skills, and make. calculated
A good way to lead students into reading poetry is to teach them how to write their own poems.. The boys love the musical quality of
A clever and simplifying strategy: pairing up all the rays coming through the slit and then finding what conditions cause the waves of the rays in each pair to cancel each other.
This kind of algorithm has also been a powerful tool for solving many other optimization problems, including symmetric cone complementarity problems [15, 16, 20–22], symmetric
