The impact of the Chi-Chi earthquake on quality of life among elderly survivors
in Taiwan – A before and after study
Mau-Roung Lin1, Wenzheng Huang2, Chingchaw Huang3, Hei-Fen Hwang4, Lung-Wen Tsai1 & Yun-Ning Chiu1
1
Institute of Injury Prevention and Control, Taipei Medical University, Taipei, Taiwan, R.O.C.;2Department of Biostatistics, Harvard School of Public Health, Boston, MA, USA; 3Department of Health Care Management;4Department of Nursing, National Taipei College of Nursing, Taipei, Taiwan, R.O.C.
Accepted in revised form 1 February 2002
Abstract
This paper examines the impact of the Chi-Chi earthquake, which hit central Taiwan on September 21, 1999, on the quality of life among the elderly survivors. The 28-item Taiwanese-adapted brief version of the World Health Organization’s quality of life questionnaire (WHOQOL-BREF) was used to measure quality of life in four domains: physical capacity, psychological well-being, social relationships, and environment. These measures were coincidently collected in a separate study from 368 subjects aged 65 and older in the affected area shortly before the earthquake. Of these subjects, 268 were interviewed in a follow-up as-sessment 12 months after the earthquake. Linear mixed models were applied to investigate how quality of life in each of the four domains changed from the pre-earthquake assessment to 12 months after the earthquake, and how these changes depended on the level of damage to residences. In conclusion, elderly survivors tended to report lower quality of life in physical capacity, psychological well-being, and envi-ronment 12 months after the earthquake than at the assessment prior to the earthquake, regardless of the level of damage to their residences during the earthquake. However, those whose residences completely collapsed during the earthquake reported a higher quality of life in social relationships while others re-ported the opposite.
Key words: Earthquake, Elderly, Epidemiology, Quality of life, Taiwan, WHOQOL-BREF
Abbreviations: WHOQOL-BREF – brief version of the World Health Organization’s quality of life questionnaire; ADL – activities of daily living; GDS – geriatric depression scale; MMSE – mini-mental state examination; CI – confidence interval
Introduction
At 1:47 a.m. on September 21, 1999, an earth-quake rated 7.3 in the Richter scale struck the central region of Taiwan with its epicenter at Chi-Chi, Nantou County, killing 2,437 people [1], and injuring more than 11,305 [2]. It also caused 107,002 houses to collapse and resulted in financial losses of aboutUS$11.5 billion [2].
The elderly were more vulnerable than others during and after the earthquake. The death toll for people aged 65 or older was 645 which comprised 27% of the total deaths due to the earthquake even though the people in this group account for only 8.1% of the total population in Taiwan. Several studies have confirmed that elderly people experi-ence higher mortality rates during earthquakes [3– 5] than do the younger ones. It has also been
de-termined that elderly earthquake survivors are more likely to suffer from acute earthquake-related deaths such as heart disease [6–10] and stroke (11). Further, they are at a greater risk of psychological morbidity [12, 13].
While these epidemiological studies have fo-cused on univariate measures of mortality or morbidity [3–14] resulting from earthquakes, the multidimensional impacts of earthquakes on the quality of life remain little explored. Quality of life is multi-dimensional construct that includes at leastsuch domains as physical capacity, psycho-logical well-being, social relationships, and envi-ronment. The detailed information collected on quality of life measures in these domains is useful in assisting health workers in identifying and meeting the needs of elderly survivors. This is es-pecially important because the elderly survivors tend to report fewer complaints than do younger survivors after experiencing a natural disaster [3, 15]. In addition, there is evidence that a large amount of resources, both domestic and interna-tional, was under-utilized in the efforts to assist the earthquake victims [16], and therefore, knowledge of changes in quality of life over time after an earthquake might help guide health programs to efficiently allocate resources at different times.
This article presents a 12-month follow-up study comparing the before- and after-earthquake quality of life among elderly survivors. The before-earthquake information was coincidentally collected in an initial assessment interview ad-ministered in a separate study shortly before the earthquake hit the area.
Materials and methods
Study subjects
Shin-Sher Township, Taichung County is a rural agricultural area with a high proportion of elderly people. The percentage of residents aged 65 and older is 11.9%, compared to 8.6% in Taiwan as a whole. Outof 13 villages in Shin-Sher Township, two villages that had the largest elderly popula-tions were selected for a fall-related study (Risk Factors for Falls among Rural Elderly People), sponsored by the National Science Council and China Medical College, Republic of China, in
1999. A total of 608 people aged 65 or older in the two villages were on record in the Household Registration Office at Shin-Sher Township when the study started. Household Registration Offices in Taiwan are responsible for collating and dis-seminating demographic information and officially recognizing personal status and relations. Ex-cluding those elderly who were not ambulatory, the study identified 368 subjects who agreed to participate in the initial assessment. This assess-ment was completed during the week of September 13 to 18, 1999, shortly before the Chi-Chi earth-quake hit the area on September 21. A follow-up assessment was conducted 12 months after the earthquake. Of the 368 subjects who participated in the first assessment, only 268 were interviewed in the follow-up assessment. The remaining 100 subjects did not participate because 17 had died, 5 were hospitalized, 15 had moved out of the area, 14 were lost to follow-up, and 49 declined the follow-up interview. Most of the subjects who declined the interview did so because they were weary of the earthquake subject after the terrible disaster.
Of the 368 subjects who participated in the ini-tial assessment, 17 and 28 suffered complete and partial collapse of their residences during the earthquake, respectively. Of the 268 subjects that participated in the follow-up assessment, 6 and 23 suffered complete and partial collapse of their residences during the earthquake, respectively.
The 368 subjects that participated in the initial assessment were found not to statistically differ with respect to the distribution of age, gender, and level of damage to their residences during the earthquake from the remaining 270 elderly that were on record in the House Registration Office when the study started but who did not participate in the study. Pearson v2-statistics for the three variables were 2.1, 0.0, and 1.4, respectively. Fur-ther, the 268 respondents to the follow-up assess-ment were found not to statistically differ with respect to the distribution of age and gender from the 100 non-respondents. Pearson v2-statistics were 2.9 for age and 0.7 for gender, respectively. However, the percentage of subjects whose resi-dences had completely collapsed during the earthquake among the 268 respondents of the follow-up assessment was smaller than that among the 100 non-respondents. The Pearson v2-statistic
was 7.0. In other words, subjects whose residences completely collapsed during the earthquake were less likely to agree to be interviewed at the follow-up assessment than subjects whose residences partially collapsed or remained intact.
Data collection
At the initial assessment, personal interviews with structured questionnaires were conducted at the subjects’ residences by trained interviewers to collect related information. Interview procedures and interviewers’ attitudes were standardized by a 4-hour training course. An interview session lasted approximately 30–50 min.
The major component of the interview was to assess health-related quality of life among the el-derly with respect to what they had experienced during the 2 weeks prior to the interview. The Taiwanese-adapted brief version of the World Health Organization’s quality of life (WHOQOL-BREF) [17, 18] was used for this purpose. This brief version was developed in 1999 in compliance with World Health Organization (WHO) guide-lines [19, 20]. A core team was responsible for translating the definitions of WHOQOL facets (items) from English into Chinese and adding new items (facets) of local importance. The translation was carefully reviewed by a separate group of monolingual and bilingual individuals [21]. The review process included translating the definitions from Chinese back into English and then com-paring that with the original English version. Ex-cellent reliability and validity of this adapted version were reported [17]. As detailed in the Ap-pendix, the Taiwanese-adapted WHOQOL-BREF comprises 26 items translated from the original WHOQOL-BREF [22], plus two additional items of local importance. The first two questions in the Taiwanese-adapted WHOQOL-BREF concern the overall quality of life. According to the WHOQOL group, the remaining 26 items can be appropri-ately grouped into four major domains [17, 18]. More specifically, Q3, Q4, Q10, Q15, Q16, Q17, and Q18 are grouped into the physical domain; Q5, Q6, Q7, Q11, Q19, and Q26 are grouped into the psychological domain; Q20, Q21, Q22, and Q27 are grouped into social relationships; and Q8, Q9, Q12, Q13, Q14, Q23, Q24, Q25, and Q28 are grouped into the environmental domain. Each
question uses a scale that ranges from 1 to 5 with a higher score indicating a higher quality of life. Adding scores across all the items (facets) in one domain generates the raw score for that domain. This raw score is then standardized to a scale ranging from 0 to 100 to represent the score for that domain.
In addition to administering the
Taiwanese-adapted WHOQOL-BREF, interviewers also
collected information on birth date, gender, edu-cational level, residence type (single, one-story, apartment), marital status (spouse present, wid-owed/divorced/single), smoking status, alcohol consumption, regular exercise, insomnia (never, 1– 3, 4 days or more per week), comorbidity, de-pression level, cognitive status, and activities of daily life (ADL). In more details, comorbidity was assessed by a list of 24 comorbid conditions that are likely to affect the elderly. The level of de-pression was assessed by a shortform of the ge-riatric depression scale (GDS) with 15 items [23]. The GDS scores range from 0 to 15. A score higher than 5 points is indicative of a tendency to clinical depression, and a score higher than 10 of severe depression [24]. Cognitive status was assessed by the mini-mental state examination (MMSE) [25]. Commonly used in epidemiological studies, this questionnaire assesses the cognitive status of sub-jects with respect to orientation, registration, and recall of information, attention and calculation, language, and visuospatial construction. Due to the lack of reading ability in a substantial pro-portion of the elderly participants, pro-portions of the MMSE that require reading and writing were not used. A higher score on the MMSE is indicative of better cognitive status. Activities of daily living (ADL) were assessed by eightitems including self-feeding, self-dressing, grooming, walking, trans-ferring, bathing, controlling bladder and bowels, and the presence of another to help with ADL tasks [26].
At the follow-up assessment, the 28 items of the Taiwanese-adapted WHOQOL-BREF were re-as-sessed in a follow-up interview conducted at 12 months after the earthquake. In addition, in-formation on the level of damage to the primary residence of subjects was collected. For this task, we recorded whether the primary residence of a subjecthad partially or completely collapsed dur-ing the earthquake, accorddur-ing to a list from the
local authorities based on assessments by struc-tural architects. Partial or complete collapse of a residence represents additional intensity of expo-sure to the earthquake.
Data analysis
The goal of the analysis was to examine the impact of the earthquake on the quality of life among elderly survivors. Presumably, the intensity of ex-posure to the earthquake, which is reflected by the level of damage to one’s residence in our data, is a key factor affecting the status of one’s quality of life. Therefore, we included the level of damage to one’s residence as a key predictor in our analysis. Survivors can be classified into three groups depending on the level of damage to their resi-dences: no collapse, partial collapse, and complete collapse. To ensure that subjects in these three groups were comparable prior to the earthquake, we first examined whether these three groups were similar with respect to baseline characteristics. To this aim, distributions of baseline characteristics among the three groups were compared using Pearson v2-tests or Fisher’s exact test for cate-gorical characteristics and Mantel–Haenszel v2 -tests for ordinal characteristics.
Using one-way analysis of variance (ANOVA), we investigated how changes in scores of each domain from the initial to the follow-up assess-ment were related to the level of damage to one’s residence and to baseline characteristics. This analysis provides a summary of the marginal re-lationships between changes in domain scores and level of damage to one’s residence or a particular baseline characteristic. However, it neither con-trols for possible confounders, nor takes into account initial scores. To overcome these short-comings, we used a linear mixed model [27, 28] for our primary analysis. This allowed us to investi-gate how quality of life measures changed over time and how this course depended on multiple potential factors. In this analysis, the two overall scores for quality of life and four domain scores were each treated as an outcome variable in the linear mixed model. One dummy variable was created for the follow-up assessment and two dummy variables were created for the elderly whose residences partially or completely collapsed, respectively.
We used a method developed by Kazis et al. [29] to quantify the clinical importance of the changes in quality of life in each of the four domains. By Cohen’s criteria [30], the change in one domain is considered small, moderate, or large if the mean change in scores for that domain from the pre-earthquake assessment to 12 months after the earthquake divided by the standard deviation of the initial score is from 0.2 to 0.5, from 0.5 to 0.8, or greater than 0.8, respectively. Statistical Anal-ysis Software (SAS) version 6.12 was used for all statistical analyses.
Results
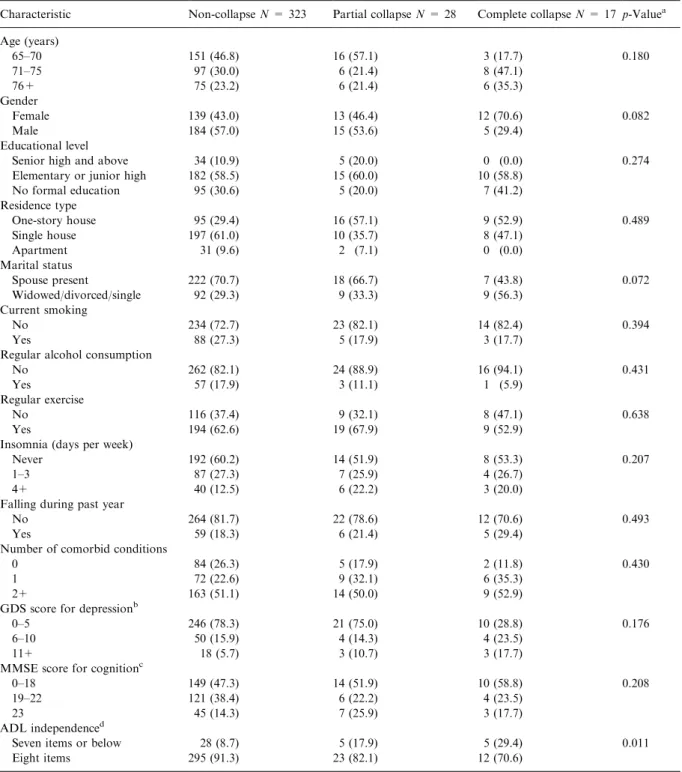
Table 1 summarizes the distributions of baseline characteristics in the three groups classified by level of damage to one’s residence. These three groups are similar with respect to all baseline characteristics except for ADL independence.
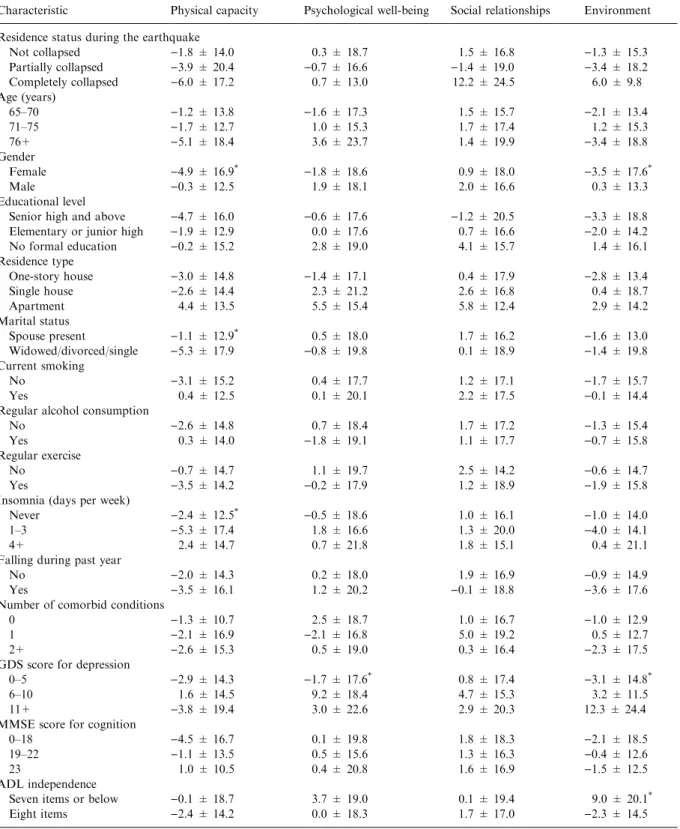
Table 2 shows average score changes of the four domains from the initial to the follow-up assess-mentamong 368 elderly by characteristic. Elderly who were female or widowed/divorced/single, or who suffered insomnia 1–3 days per week re-sponded with higher negative score changes in physical capacity. These who had the lowest baseline GDS scores were associated with higher negative score changes in the psychological do-main. Neither residence status during the earth-quake nor any baseline characteristic was sig-nificantly associated with score changes in social relationships. Elderly who were female, who had the lowest GDS scores, and who performed inde-pendently on eight items of ADL were associated with more negative score changes in the environ-mental domain.
The two overall scores for quality of life and the four domain scores are each treated as outcomes in the linear mixed model. Neither of the two overall scores for quality of life was found to have chan-ged significantly from the initial assessment to 12 months after the earthquake (results not shown). The paths for these two overall scores did not depend on the level of damage to one’s resi-dence either.
The results of the linear mixed model treating each domain score as an outcome variable are shown in Table 3. In summary, scores in all
do-Table 1. Frequency (%) distributions of characteristics measured in the initial assessment among 368 elderly people according to residence status during the Chi-Chi earthquake in Shin-Sher Township, Taichung County, Taiwan
Characteristic Non-collapse N = 323 Partial collapse N = 28 Complete collapse N = 17 p-Valuea
Age (years) 65–70 151 (46.8) 16 (57.1) 3 (17.7) 0.180 71–75 97 (30.0) 6 (21.4) 8 (47.1) 76+ 75 (23.2) 6 (21.4) 6 (35.3) Gender Female 139 (43.0) 13 (46.4) 12 (70.6) 0.082 Male 184 (57.0) 15 (53.6) 5 (29.4) Educational level
Senior high and above 34 (10.9) 5 (20.0) 0 (0.0) 0.274
Elementary or junior high 182 (58.5) 15 (60.0) 10 (58.8)
No formal education 95 (30.6) 5 (20.0) 7 (41.2) Residence type One-story house 95 (29.4) 16 (57.1) 9 (52.9) 0.489 Single house 197 (61.0) 10 (35.7) 8 (47.1) Apartment 31 (9.6) 2 (7.1) 0 (0.0) Marital status Spouse present222 (70.7) 18 (66.7) 7 (43.8) 0.072 Widowed/divorced/single 92 (29.3) 9 (33.3) 9 (56.3) Currentsmoking No 234 (72.7) 23 (82.1) 14 (82.4) 0.394 Yes 88 (27.3) 5 (17.9) 3 (17.7)
Regular alcohol consumption
No 262 (82.1) 24 (88.9) 16 (94.1) 0.431
Yes 57 (17.9) 3 (11.1) 1 (5.9)
Regular exercise
No 116 (37.4) 9 (32.1) 8 (47.1) 0.638
Yes 194 (62.6) 19 (67.9) 9 (52.9)
Insomnia (days per week)
Never 192 (60.2) 14 (51.9) 8 (53.3) 0.207
1–3 87 (27.3) 7 (25.9) 4 (26.7)
4+ 40 (12.5) 6 (22.2) 3 (20.0)
Falling during pastyear
No 264 (81.7) 22 (78.6) 12 (70.6) 0.493
Yes 59 (18.3) 6 (21.4) 5 (29.4)
Number of comorbid conditions
0 84 (26.3) 5 (17.9) 2 (11.8) 0.430
1 72 (22.6) 9 (32.1) 6 (35.3)
2+ 163 (51.1) 14 (50.0) 9 (52.9)
GDS score for depressionb
0–5 246 (78.3) 21 (75.0) 10 (28.8) 0.176
6–10 50 (15.9) 4 (14.3) 4 (23.5)
11+ 18 (5.7) 3 (10.7) 3 (17.7)
MMSE score for cognitionc
0–18 149 (47.3) 14 (51.9) 10 (58.8) 0.208
19–22 121 (38.4) 6 (22.2) 4 (23.5)
23 45 (14.3) 7 (25.9) 3 (17.7)
ADL independenced
Seven items or below 28 (8.7) 5 (17.9) 5 (29.4) 0.011
Eightitems 295 (91.3) 23 (82.1) 12 (70.6)
a
Pearson v2-test or Fisher’s exact test (if expected number less than 5) for categorical variables or Mantel–Haenszel v2-test for trends for ordinal variables.
b
A short form of the GDS: a higher score indicates a higher level of depression.
c
A higher score indicates better cognitive status.
d
ADL were feeding oneself, dressing, grooming, walking, transferring, bathing, controlling bladder and bowels, and the presence of another to help with ADL tasks.
Table 2. Score changes with standard deviation in each domain from pre-earthquake to 12 months after the earthquake according to residence status during the earthquake and baseline characteristics among 368 elderly in Shin-Sher Township, Taichung County, Taiwan
Characteristic Physical capacity Psychological well-being Social relationships Environment
Residence status during the earthquake
Notcollapsed )1.8 ± 14.0 0.3 ± 18.7 1.5 ± 16.8 )1.3 ± 15.3 Partially collapsed )3.9 ± 20.4 )0.7 ± 16.6 )1.4 ± 19.0 )3.4 ± 18.2 Completely collapsed )6.0 ± 17.2 0.7 ± 13.0 12.2 ± 24.5 6.0 ± 9.8 Age (years) 65–70 )1.2 ± 13.8 )1.6 ± 17.3 1.5 ± 15.7 )2.1 ± 13.4 71–75 )1.7 ± 12.7 1.0 ± 15.3 1.7 ± 17.4 1.2 ± 15.3 76+ )5.1 ± 18.4 3.6 ± 23.7 1.4 ± 19.9 )3.4 ± 18.8 Gender Female )4.9 ± 16.9* )1.8 ± 18.6 0.9 ± 18.0 )3.5 ± 17.6* Male )0.3 ± 12.5 1.9 ± 18.1 2.0 ± 16.6 0.3 ± 13.3 Educational level
Senior high and above )4.7 ± 16.0 )0.6 ± 17.6 )1.2 ± 20.5 )3.3 ± 18.8
Elementary or junior high )1.9 ± 12.9 0.0 ± 17.6 0.7 ± 16.6 )2.0 ± 14.2
No formal education )0.2 ± 15.2 2.8 ± 19.0 4.1 ± 15.7 1.4 ± 16.1 Residence type One-story house )3.0 ± 14.8 )1.4 ± 17.1 0.4 ± 17.9 )2.8 ± 13.4 Single house )2.6 ± 14.4 2.3 ± 21.2 2.6 ± 16.8 0.4 ± 18.7 Apartment 4.4 ± 13.5 5.5 ± 15.4 5.8 ± 12.4 2.9 ± 14.2 Marital status Spouse present )1.1 ± 12.9* 0.5 ± 18.0 1.7 ± 16.2 )1.6 ± 13.0 Widowed/divorced/single )5.3 ± 17.9 )0.8 ± 19.8 0.1 ± 18.9 )1.4 ± 19.8 Currentsmoking No )3.1 ± 15.2 0.4 ± 17.7 1.2 ± 17.1 )1.7 ± 15.7 Yes 0.4 ± 12.5 0.1 ± 20.1 2.2 ± 17.5 )0.1 ± 14.4
Regular alcohol consumption
No )2.6 ± 14.8 0.7 ± 18.4 1.7 ± 17.2 )1.3 ± 15.4
Yes 0.3 ± 14.0 )1.8 ± 19.1 1.1 ± 17.7 )0.7 ± 15.8
Regular exercise
No )0.7 ± 14.7 1.1 ± 19.7 2.5 ± 14.2 )0.6 ± 14.7
Yes )3.5 ± 14.2 )0.2 ± 17.9 1.2 ± 18.9 )1.9 ± 15.8
Insomnia (days per week)
Never )2.4 ± 12.5*
)0.5 ± 18.6 1.0 ± 16.1 )1.0 ± 14.0
1–3 )5.3 ± 17.4 1.8 ± 16.6 1.3 ± 20.0 )4.0 ± 14.1
4+ 2.4 ± 14.7 0.7 ± 21.8 1.8 ± 15.1 0.4 ± 21.1
Falling during pastyear
No )2.0 ± 14.3 0.2 ± 18.0 1.9 ± 16.9 )0.9 ± 14.9
Yes )3.5 ± 16.1 1.2 ± 20.2 )0.1 ± 18.8 )3.6 ± 17.6
Number of comorbid conditions
0 )1.3 ± 10.7 2.5 ± 18.7 1.0 ± 16.7 )1.0 ± 12.9
1 )2.1 ± 16.9 )2.1 ± 16.8 5.0 ± 19.2 0.5 ± 12.7
2+ )2.6 ± 15.3 0.5 ± 19.0 0.3 ± 16.4 )2.3 ± 17.5
GDS score for depression
0–5 )2.9 ± 14.3 )1.7 ± 17.6* 0.8 ± 17.4 )3.1 ± 14.8*
6–10 1.6 ± 14.5 9.2 ± 18.4 4.7 ± 15.3 3.2 ± 11.5
11+ )3.8 ± 19.4 3.0 ± 22.6 2.9 ± 20.3 12.3 ± 24.4
MMSE score for cognition
0–18 )4.5 ± 16.7 0.1 ± 19.8 1.8 ± 18.3 )2.1 ± 18.5
19–22 )1.1 ± 13.5 0.5 ± 15.6 1.3 ± 16.3 )0.4 ± 12.6
23 1.0 ± 10.5 0.4 ± 20.8 1.6 ± 16.9 )1.5 ± 12.5
ADL independence
Seven items or below )0.1 ± 18.7 3.7 ± 19.0 0.1 ± 19.4 9.0 ± 20.1*
Eightitems )2.4 ± 14.2 0.0 ± 18.3 1.7 ± 17.0 )2.3 ± 14.5
*
mains declined from the pre-earthquake assess-ment to 12 months after the earthquake except in social relationships and environment among the elderly whose residences completely collapsed. Specifically, with adjustment for gender, regular exercise, insomnia, and interactions of time of as-sessment with these three variables, scores for physical capacity declined by 2.1 (95% confidence interval (CI):)1.5 to 5.7) points among the elderly whose residences did notcollapse during the earthquake. The decline in physical capacity scores was 1.9 (95% CI:)3.8 to 7.7) points larger among the elderly whose residences partially collapsed and 1.0 (95% CI:)8.5 to 10.6) point larger among those whose residences completely collapsed. With adjustment for gender, depression, and interac-tions of time of assessment with the two variables, scores for psychological well-being declined 2.9 (95% CI: 0–5.9) points among the elderly whose residences did not collapse during the earthquake. The decline was 0.3 (95% CI: )6.7 to 7.4) points larger among the elderly whose residences partially collapsed and 1.1 (95% CI: )9.6 to 11.9) points larger among those whose residences completely collapsed. Scores in social relationships increased 1.7 (95% CI: )0.3 to 3.7) points for the elderly whose residences did notcollapse. Compared with the elderly whose residences did not collapse, scores were 2.1 (95% CI: )9.1 to 4.8) points
smaller among the elderly whose residences par-tially collapsed. In contrast, however, scores in social relationship among those whose residences completely collapsed increased by 12.7 (11.0 + 1.7) (95% CI: 2.0 to 23.4) points from the pre-earthquake assessment to 12 months after the earthquake. The difference in changes in social relationships between the elderly whose residences completely collapsed and those whose residences did notcollapse was 11.0 (95% CI: 0.1–21.9). With adjustment for gender, depression, ADL indepen-dence, and interactions of time of assessment with the three variables, scores for the environment declined by 5.5 (95% CI: 3.1 to 8.0) points among the elderly whose residences did not collapse. The decline was 3.1 (95% CI:)2.6 to 8.8) points larger among the elderly whose residences partially col-lapsed. The difference in the changes in environ-ment between the elderly whose residences completely collapsed and those whose residences did notcollapse was 3.7 (95% CI: )5.1 to 12.5).
Using Cohen’s criteria [30], we found that the earthquake had a small effect in reducing the scores for physical capacity (effect size¼)0.27) and environment(effectsize¼)0.29) among the elderly whose residences partially collapsed. The earthquake also had a small effect in reducing the scores for physical capacity (effect size¼)0.22) butmoderate and small effects in increasing scores
Table 3. Results of the linear mixed model analysis: adjusted relative differences (RD) and 95% confidence intervals (CIs) for scores in physical capacity, psychological, social relationships, and environment, respectively, related to time of assessment, residence status during the earthquake, and other factors among 368 elderly in Shin-Sher Township, Taichung County, Taiwan
Characteristic RD [95% CI]
Physical capacitya Psychologicalb Social relationships Environmentc
Time of assessment
Pre-earthquake 0 0 0 0
12 Months later )2.1 [()5.7)–1.5] )2.9 [()5.9)–0.0] 1.7 [()0.3)–3.7] )5.5 [()8.0)–()3.1)]
Residence status during the earthquake
Notcollapsed 0 0 0 0
Partially collapsed )3.6 [()8.7)–1.5] 1.2 [()4.1)–6.5] 2.1 [()3.5)–7.7] 0.3 [()4.1)–4.7]
Completely collapsed )5.9 [()12.5)–0.6] )4.5 [()11.3)–2.2] )9.1 [()16.2)–()2.0)] )3.9 [()9.5)–1.7] Residence status· assessmenttime
Partially collapsed· 12 months later )1.9 [()7.7)–3.8] )0.3 [()7.4)–6.7] )2.1 [()9.1)–4.8] )3.1 [()8.8)–2.6] Completely collapsed· 12 months later )1.0 [()10.6)–8.5] )1.1 [()11.9)–9.6] 11.0 [(0.1)–21.9] 3.7 [()5.1)–12.5]
aAdjusted for gender (male, female), gender
· time, regular exercise (yes, no), regular exercise · time, insomnia (never, 1–3, 4+ days per week), and insomnia· time.
bAdjusted for gender, gender· time, depression level (GDS: 0–5, 6–10, 11+), and depression level · time. c
Adjusted for gender, gender· time, depression level, depression level · time, level of ADL independence, level of ADL independence · time.
for social relationships (effect size¼ 0.69) and environment(effectsize¼ 0.42), respectively, among the elderly whose residences partially col-lapsed.
Discussion
The data collected in this study provide a unique opportunity to do before- and after-earthquake comparisons of health-related quality of life among elderly people. The multidimensional measures of quality of life in four different do-mains presenta more revealing depiction of what the elderly had experienced in the aftermath of the earthquake than do univariate overall measures. This was evidenced in our data. Even though the two overall scores for quality of life were found not to have changed significantly from the initial assessment to 12 months after the earthquake and not to depend on the level of damage to one’s residence during the earthquake, this is not the case with the four domain scores. It was found the impacts of the earthquake on quality of life among elderly people differ over domains and also depend on the level of damage to one’s residence during the earthquake.
More specifically, elderly people tended to re-port a lower quality of life in physical capacity, psychological well-being, and environment12 months after the earthquake than at the initial assessment prior to the earthquake, regardless of the level of damage to their residences during the earthquake. However, those whose residences completely collapsed during the earthquake re-ported a higher quality of life in social relation-ships 12 months after the earthquake than before the earthquake, while others reported a lower quality of life in social relationships.
The improvementin social relationships among the elderly whose residence completely collapsed during the earthquake is both statistically and clinically significant. This improvement may be due to the increased support and care they received from families, relatives, friends, and the commu-nity after the earthquake [31]. However, it is not clearly understood why the elderly whose resi-dences completely collapsed took quite a different path in terms of quality of life in social relation-ships and environment than those whose
resi-dences partially collapsed. A possible speculation is that the elderly whose residences completely collapsed may have received more social support and care than those whose residences partially collapsed. For example, an elderly person whose residence completely collapsed was likely to be provided a temporary accommodation from his/ her relative or friend, especially in the early months after the earthquake. On the other hand, an elderly person whose residence partially col-lapsed may have stayed in his/her original resi-dence. This speculation is indirectly supported by the fact that the elderly whose residences com-pletely collapsed were less likely to be interviewed at or near the original residence locations in the follow-up assessment than those whose residences partially collapsed (6/17 vs. 23/28). In fact, when receiving the second interviews, the subjects with residences collapsed completely lived in the self-built temporary shelters near the original residence locations.
The two overall quality of life items may not be sensitive enough to detect changes in quality of life among the elderly after they experience an earth-quake. In addition, the direction and magnitude of the earthquake’s impact differ not only over do-mains of quality of life, but also over items (facets) within a single domain (results not shown). For example, in the psychological domain, the elderly whose residences did notcollapse increased not only their negative feelings (Q6) but also their feelings aboutlife’s meaningfulness (Q26); fur-thermore, the elderly whose residences partially or completely collapsed had smaller increases in their feelings of life’s meaningfulness as well as in their negative feelings than did those whose residences did not collapse. The heterogeneous effects of the earthquake or its exposure intensity on the score changes in items within a single domain would reduce the sensitivity for detection of change in the domain as a whole. Additionally, this implies that categorization of the 28 items into four domains in the Taiwanese-adapted WHOQOL-BREF based on general population might not be appropriate and should be further validated in elderly popu-lations.
There are several limitations to the study. The first is the issue of selection bias. Elderly subjects interviewed at the initial or follow-up assessment might not be representative of the study
popula-tion. The elderly sample of this study was limited to two of the 13 villages in Shin-Sher Township. Compared with the elderly in the other 11 villages, those in the two villages studied showed no dif-ferences in distributions in gender or level of damage to one’s residence, but they tended to be older. To investigate the impact of selection bias with respect to age and other potentially influential factors such as educational level and residence type on our conclusions, we included these factors as effectmodifiers in the mixed model. However, the effect estimates of the residence status during the earthquake on the changes in each domain scores remained similar when these terms were added in the linear mixed model presented in Ta-ble 3, indicating that the selection bias with respect to these factors may not invalidate our conclu-sions. Furthermore, elderly survivors who were unable to undertake the follow-up interview, es-pecially those who were hospitalized or had moved out of the affected area after the earthquake, would have more likely reported a decreased quality of life. Therefore, the negative effect of the earthquake on quality of life in this study may have been underestimated. Second, acute impacts of the earthquake on the quality of life in elderly people might not have been captured by the post-earthquake assessment administered 12 months after the earthquake. If the impact of the earth-quake on quality of life diminished over time, then the maximum impact on each domain of quality of life may have been underestimated. However, an attempt to collect earlier information on elderly survivors was hampered by the authorities who discouraged any activities other than those de-voted to rescuing and reconstruction efforts, the earthquake-induced inaccessibility of the affected community, and the persistence of numerous af-tershocks. The third and a major limitation of our study is that all subjects in the study experienced the earthquake, and they were not compared to any controls from non-earthquake areas. There-fore, itis impossible to distinguish changes in quality of life due to the earthquake from those due to a natural time trend. However, it may be reasonable to assume that the quality of life among the elderly would have remained relatively un-changed over 12 months if there had been no earthquake, so the changes in quality of life can be attributed to the earthquake.
Acknowledgements
This work was partly supported by grant NSC 89-2314-B-039-033-M56 from the National Science Council, Republic of China, and partly supported by grantCMC88-PH-02 from the China Medical College, Republic of China.
Appendix
WHOQOL-BREF: Taiwanese-adapted version
Q1. How would you rate your quality of life? Q2. How satisfied are you with your health? Q3. To what extent do you feel that physical
pain prevents you from doing what you need to do?
Q4. How much medical treatment do you need to function in your daily life?
Q5. How much do you enjoy life?
Q6. To what extent do you feel your life to be meaningful?
Q7. How well are you able to concentrate? Q8. How safe do you feel in your daily life? Q9. How healthy is your physical environment? Q10. Do you have enough energy for everyday
life?
Q11. Are you able to accept your bodily appear-ance?
Q12. Do you have enough money to meet your needs?
Q13. How available to you is the information that you need in your day-to-day life?
Q14. To what extent do you have the opportunity for leisure activities?
Q15. How well are you able to get around? Q16. How satisfied are you with your sleep? Q17. How satisfied are you with your ability to
perform your daily living activities?
Q18. How satisfied are you with your capacity for work?
Q19. How satisfied are you with yourself? Q20. How satisfied are you with your personal
relationships?
Q21. How satisfied are you with your sex life? Q22. How satisfied are you with the support you
getfrom your friends?
Q23. How satisfied are you with the conditions of your living place?
Q24. How satisfied are you with your access to health services?
Q25. How satisfied are you with your transport? Q26. How often do you have negative feelings
such as a blue mood, despair, anxiety, or depression?
Q27. Do you feel respected by others?
Q28. Are you usually able to get the things you like to eat?
References
1. Department of Health. Statistical Yearbook of the Re-public of China in 1999. Taipei: Executive Yuan, ReRe-public of China, 2000.
2. Directorate-General of Budget Accounting and Statistics. Statistical Yearbook of the Republic of China in 1999. Taipei: Executive Yuan, Republic of China, 2000. 3. Tanida N. What happened to elderly people in the great
Hanshin earthquake? Br Med J 1996; 313: 1133–1135. 4. Peek-Asa C, Kraus JF, Bourque LB, etal. Fatal and
hos-pitalized injuries resulting from the 1994 Northridge earthquake. Int J Epidemiol 1998; 27: 459–465.
5. Armenian HK, Melkonian AK, Noji EK, Hovanesian AP. Deaths and injuries due to the earthquake in Armenia: A cohortapproach. IntJ Epidemiol 1998; 27: 459–465. 6. Abdo T, Al-Dorzi H, Jabr F, Zaghloul N. Earthquakes:
Health outcomes and implications in Lebanon. Lebanese Med J 1997; 45(4): 197–200.
7. Kario K, Matsuo T, Kobayashi H, Yamamoto K, Shimada K. Earthquake-induced potentiation of acute risk factors in hypertentive elderly patients: Possible triggering of cardio-vascular events after a major earthquake. J Am College Cardiol 1997; 29(5): 926–933.
8. Kloner RA, Leor J, Poole WK, Perritt R. Population-based analysis of the effect of the Northridge earthquake on cardiac deaths in Los Angeles County, California. J Am College Cardiol 1997; 30(5): 1174–1180.
9. Armenian HK, Melkonian AK, Hovanesianss AP. Long-term mortality and morbidity related to degree of damage following the 1988 earthquake in Armenia. Am J Epidemiol 1998; 148: 1077–1084.
10. Suzuki S, Sakamoto S, Koide M, et al. Hanshin-Awaji earthquake as a trigger for acute myocardial infarction. Am HeartJ 1997; 134(5): 974–977.
11. Kario K, Ohashi T. After a major earthquake, stroke death occurs more frequently than coronary heart disease death in very old subjects. J Am Geriatr Soc 1998; 46(4): 537–538. 12. Carr VJ, Lewin TJ, Webster RA, Hazell PL, Kenardy JA,
Carter GL. Psychosocial sequelae of the 1989 Newcastle earthquake: I. Community disaster experiences and psy-chological morbidity 6 months post-disaster. Psychol Med 1995; 25(3): 539–555.
13. Lewin TJ, Carr VJ, Webster RA. Recovery from post-earthquake psychological morbidity: Who suffers and who recovers? AustNZ J Psychiat1998; 32(1): 15–20.
14. Roces MC, White ME, Dayrit MM, et al. Risk factors for injuries due to the 1990 earthquake in Luzon, Philippines. Bull World Health Organ 1992; 70: 509–514.
15. Huerta F, Horton R. Coping behavior of elderly flood victims. Gerontologist 1978; 15: 357–361.
16. Noji E. Disaster epidemiology. Emerg Med Clinics North Am 1996; 14: 289–300.
17. The WHOQOL-Taiwan Group. Manual of Taiwanese version of WHOQOL-BREF. Taipei: Taiwan WHOQOL Group, 2000.
18. The WHOQOL-Taiwan Group. Introduction to the devel-opmentof the WHOQOL-Taiwan version. Chin J Public Health (Taipei): 2000; 19(4): 315–324.
19. World Health Organization. WHOQOL study protocol. Geneva: WHO (MNH/PSF/93.9), 1993.
20. World Health Organization. WHOQOL protocol for new centers. Geneva: WHO (MNH/PSF/94.4), 1994.
21. Sartorius N, Kuyken W. Translation of health status in-struments. In: Orley J, Kuyken W (eds), Quality of Life Assessment: International Perspectives. New York: Springer-Verlag, 1994; 3–18.
22. The WHOQOL Group. Development of the World Health Organization WHOQOL-BREF quality of life assessment. Psychol Med 1998; 28: 551–558.
23. Sheikh JA, Yessavage JA. Geriatric depression scale (GDS): Recentfindings and developmentof a shorter ver-sion. In: Brink TL (ed.). Clinical Gerontology: A Guide to Assessment and Intervention. New York: Howarth Press, 1986.
24. Lyness JM, Noel TK, Cox C, etal. Screening for depression in elderly primary care patients. A comparison of the Center for epidemiologic studies-depression scale and the geriatric depression scale. Arch Intern Med 1997; 157(4): 449–454. 25. Folstein MF, Folstein SE, McHugh PR. Mini-mental state:
A practical method for grading the cognitive state of pa-tients for the clinician. J Psychiatr Res 1975; 12: 189–198. 26. Fillenbaum GG, Smyer MA. The development, validity,
and reliability of the OARS multidimensional functional assessment questionnaire. J Gerontol 1981; 36: 428–434. 27. Diggle PJ, Liang KY, Zeger SL. The analysis of
longitu-dinal data. New York: Oxford University Press, 1994. 28. Cnaan A, Laird NM, Slasor P. Using the general linear
mixed model to analyse unbalanced repeated measures and longitudinal data. Stat Med 1997; 16: 2349–2380. 29. Kazis LE, Anderson JJ, Meenan RF. Effectsizes for
in-terpreting changes in health status. Med Care 1989; 27: S178–S189.
30. Cohen J. Statistical power analysis for the behavioral sci-ences. New York: Academic Press, 1977.
31. Wang XD, Gao L, Shinfuku N, et al. Longitudinal study of earthquake-related PTSD in a randomly selected commu-nity sample in North China. Am J Psychiatry 2000; 157: 1260–1266.
Address for correspondence: Mau-Roung Lin, Institute of Injury Prevention and Control, Taipei Medical University, 250 Wu-Hsing Street, Taipei 110, Taiwan, R.O.C.
Phone: +886-2-27390217; Fax: +886-2-27390387 E-mail: [email protected]