Environmental Health Risk Perception of a Nationwide Sample of Taiwan
College Students Majoring in Engineering and Health Sciences
ABSTRACT
The present study aims to characterize Taiwan college students’ risk perception on 26 environmental health hazards, and to identify influential factors contributing to their perceived risk. A total of 1,218 nationwide college students and 35 professors participated in the study. Despite their varying demographic background, the students on average show very similar perceived relative risks, particularly for hazards of high-rank risk. Aggregate-level data analyses show that the perceived risk of a hazard increases with its increasing dreadfulness, but decreases with its increasing unknown. On the other hand, the factors contributing to the perceived risk by an individual are more complex. The dread component is the dominant factor affecting both the students’ and professors’ perceived risk. However, unlike the students, the professors’ perceived risk is also strongly driven by considerations for the exposure characteristics, the uncontrollable nature and newness of a hazard. It is notable that, for certain hazards, the perception gaps between the students and professors are substantial and thus highlighting areas of interest for additional risk communication efforts.
Keywords: risk perception, environmental health hazard, psychometric paradigm, hazard-focus, participant-focus 1 2 3 4 5 6 7 8 9 10 11 12 13 14 15 16 17 18 19 20
INTRODUCTION
Risk is commonly defined as a function of the occurrence probability and the magnitude of consequences of a specific adverse outcome. This “objective” or “quantitative” concept of risk has been the corner stone of risk assessment that allows the scientific community to quantify risk and subsequently set priority for intervention (Wilson and Crouch 1987). On one extreme, hazards associated with high incidence rate and severe consequences are considered of high risk. On the other extreme, ones with low incidence rate and negligible consequences are of low risk. Most hazards, however, are not as clear-cut as the two extremes, and thus the perceived riskiness is expected to vary considerably. In addition, many people apparently do not perceive risk by simply following such technical definition (Bostrom 1997). The resultant conflicting views are exemplified by the observed discrepancies between expert assessments and laypersons’ perceptions of risk, giving rise to the so-called “objective-perceived risk dichotomy”. For example, results from an US EPA study and public poll show that experts’ perceived risk of indoor radon and occupational exposure to chemicals was considerably higher than that of the laypeople, who on the other hand perceive chemical waste disposal and water pollution more risky (Roberts 1990; USEPA 1987). This discrepancy was attributed to the differences in how one defines or judges risk. Technical experts are more inclined to define risk following the “quantitative” concept of risk. In addition, they are more likely to have knowledge about hazards not available to the laypersons (Siegrist and Cvetkovich 2000). Laypersons, on the other hand, have a much broader definition of risk that is affected by one’s beliefs, attitudes, judgments, feeling, and social or cultural values (Pidgeon et al. 1992). Therefore, risk perception is one’s “subjective” assessment of the probability of a specified type of accident happening and how concerned we are with the consequences (Sjöberg et al. 2004). This highlights the subjective and multidimensional nature, and hence the challenges to finding the key determinants of risk perception. An improved understanding of those key determinants, in turn, provides the necessary foundation for effective risk communication, management, and education.
The “psychometric paradigm” developed by Slovic, Fischhoff, and Lichtenstein has been widely used to identify factors contributing to people’s perceptions about risk (Fischhoff et al. 1978; Slovic et al. 1980). In these studies, the participants were asked to evaluate a set of 1 2 3 4 5 6 7 8 9 10 11 12 13 14 15 16 17 18 19 20 21 22 23 24 25 26 27 28 29 30
hazards with respect to a number of risk attributes over a discrete rating scale. The correlations among the rated scores are computed for subsequent principal component analysis in order to obtain representative higher-order components. Typically, two major components are identified and given interpretive names as “dread” and “unknown”; additionally, a third component of less influence “exposure” may also be identified (Slovic 1987). The dread component is highly correlated with a number of risk attributes such as lack of control, dread potential, fatal consequence, catastrophic potential, high risk to future generation, and involuntary. The unknown component, on the other hand, is highly correlated with unobservable effect, unknown to those exposed, delayed effect, new risk, and risks unknown to science. This two-component solution has been successfully replicated in numerous studies and, despite cultural differences, in a number of countries (Boholm 1998).
In addition to the hazard characteristics or profiles, it is important to note that social, political, cultural, economic, personality factors, and media coverage also influence one’s risk perception (Bickerstaff 2004; Bouyer et al. 2001; Chauvin et al. 2007; Rohrmann 1994; Kpanake et al. 2008). For example, poverty has been identified as an important variable associated with higher perceived risk (Vaughan and Nordenstam 1991). Women were found to be more sensitive to risks than men, particularly with regard to technological and environmental hazards (Davidson and Freudenburg 1996; Finucane et al. 2000; Flynn et al. 1994; Sjöberg 1996). People with more power, control, and benefit were found to have lower perceived risks (Bickerstaff and Walker 2001; Flynn et al. 1994). The lack of trust was linked to higher perceived risk (Slovic et al. 1991). A number of personality facets were related to risk perception; for example, higher perceived risk for pollutant activities was negatively associated with rationality and tranquility facets while positively associated with imagination facet (Chauvin et al. 2007). In another study, risk perception was negatively associated with emotional stability (Sjöberg 2003). The above studies underscore that one’s perception, in this case, risk perception is a result of complex and subjective psychological and mental processes; therefore, the study of risk perception truly requires collaboration across various disciplines.
Willis et al. (2005) systematically studied the methodological issues in psychometric studies and categorized the data analysis methods by the focus of analysis and the level of analysis. The hazard-focused approach, in which the data matrix of interest is hazardattribute, 1 2 3 4 5 6 7 8 9 10 11 12 13 14 15 16 17 18 19 20 21 22 23 24 25 26 27 28 29 30
focuses on understanding how a hazard is perceived differently from the others. The participant-focused approach, in which the data matrix of interest is participantattribute, aims at identifying how a person perceives risk differently from the others. Aggregate-level refers to averaging the response scores prior to analysis, whereas the disaggregate-level involves directly analyzing the raw data. Many early psychometric studies fall in the category of aggregate-level hazard-focused analysis, as they analyze the mean response values taken across participants. In general, the explanatory power of the participant-focused or disaggregate-level analysis is typically lower than that of the hazard-focused or aggregate-level analysis. In some instances, studies have shown the classic psychometric factor space diagram of “dread” and “unknown” is mostly valid at the individual level and argued that the conventional aggregate-level approach can still provide useful information (Kraus and Slovic 1988; Marris et al. 1997). As an alternative, Willis et al. (2005) have proposed an approach that provides a fine balance between aggregate and disaggregate-level analysis. The authors presented a hybrid analysis that uses the aggregate-level factor scores to predict individuals’ riskiness judgments. This allows us to assess the differences among individual participants while retaining the interpretability
associated with the factors obtained from aggregate-level analysis.
There have been a number of risk perception studies in Asia countries, such as China, Japan and Korea. Some focused on cross-cultural differences (Keown 1989; Cha 2000; Neto and Mullet 2001; Zhai and Suzuki 2009), whereas some on environmental risks (Lai and Tao 2003; Zhang et al. 2013). In comparison, there have been relatively little risk perception studies that compare perceived risks over a wide variety of public and environmental health issues in Taiwan. Based on the psychometric model, Yen and Tsai (2007) evaluated the perceived risk characteristics, magnitude and altitude of 112 Taiwan college students toward 80 natural and man-made hazards. The selected hazards, however, were not strictly related to environmental health, but included warfare, disasters, weapons, and specific diseases. Nonetheless, the study
provided important implications in students’ perceived risk and in risk management.
As part of a larger project of developing a textbook for general education on environmental health risk, the purpose of the present study is to characterize college students’ perceived risk on a number of common hazards and the factors contributing to their perceived risk. A large number of Taiwan college students, in addition to a small number of college 1 2 3 4 5 6 7 8 9 10 11 12 13 14 15 16 17 18 19 20 21 22 23 24 25 26 27 28 29 30
professors, across the nation with various backgrounds were asked to judge the risk characteristics and magnitude of selected environmental health hazards. The collected aggregate-level data were analyzed by hazard-focused and participant-focused approach aiming to identify risk attributes responsible for observed risk perception differences among hazards and individuals.
METHOD Participants
A total of 13 colleges were selected from the four major geographical regions of Taiwan, with 5 colleges selected from the northern region, 3 from the central, 4 from the south, and 1 from the east. The number of selected colleges within a region reflects the college spatial-number distribution in the nation. The students were given the questionnaire in the classroom during class by the lecturing professor. A total of 1,348 students (out of 1,525) responded to the questionnaire, resulting in a recovery rate of 88%. After reviewing the recovered questionnaires, the number of valid samples was determined to be 1,218 (80%), in which 378 students were from the north, 312 from the central, 425 from the south, and 103 from the east. Invalid ones are those with identical responses or no responses to nearly all questions. At the time of study, the students were either in their sophomore (41%), junior (29%), or freshmen year (20%), with a mean age of 21 (s.d.=1) and male-to-female ratio of about 3:2. The participated students come from a total of 57 departments, with the majority (90%) majoring in the field of engineering or health sciences.
For comparison, 35 college professors were selected to respond to the same questionnaire, many of whom assisted in administering the questionnaires to the students. Three of them are from the northern region of Taiwan, 26 from the central, 4 from the south, and 2 from the east. Twenty-nine were male, and all but one have doctoral degree. The majority of the professors teaches courses and conducts research in the field of public health, with their affiliating departments of public health, health risk management, and occupational safety and health. It is therefore reasonable to assume the participated professors as “the expert group” in the context of this study.
1 2 3 4 5 6 7 8 9 10 11 12 13 14 15 16 17 18 19 20 21 22 23 24 25 26 27 28 29 30
Questionnaire
Based on earlier risk perception studies and the “psychometric paradigm”, we structured a questionnaire that aims to understand how college students and professors perceive the mortality risk and the risk attributes of 26 environmental health hazards. The hazards could be an environmental problem, an activity, a substance, or a technology (Table 1). As shown, many of the hazards are common environmental problems around the globe, while some are new emerging public health issues, such as products of nanotechnology, genetic modified organisms, electromagnetic radiation, and virus infectious disease. In the questionnaire, the participants were asked to rate the risk magnitude and 13 risk attributes of each hazard, and to provide socio-demographic information. Judgments of perceived risk were made on a bipolar 5-point Likert scale, from very little risk (1) to very high risk (5). The participants were instructed to rate the perceived risk of each hazard to the public as a whole and to consider the mortality
risk as a consequence of the hazard (Keown 1989). An exception is one question that asks “how
frequently are you, personally, exposed to the presented hazards?” The questions with regard to the risk attributes were taken directly from Slovic et al. (1980) and translated into Chinese.
Eight panelists, all of whom are professors in the field of public health, were involved in evaluating the validity of the questionnaire. After learning the study objectives, the panelists were asked to evaluate whether the questions are clearly and concisely stated, easy to understand, and relevant to the present work. Accordingly, they rated the overall appropriateness for each question, on a scale of highly inappropriate (1) to highly appropriate (4). In addition, the panelists were allowed to provide comments and revision suggestions to the questionnaire. The response data were analyzed using the content validity index (CVI) method, which is a measure of degree to which a sample of items constitutes an adequate operational definition of a construct (Polit and Beck 2006). The resulting item and scale CVI (I-CVI and S-CVI) both averaged 0.97, indicating good content validity. In addition, a total of 42 students, half of them from environmental-related fields and the other half not, were involved in assessing the reliability of the questionnaire. These students were asked to answer the same questionnaire twice within a period of about two weeks. The resulting Cronbach α coefficient
averaged 0.96, while the split-half reliability coefficient ranged from 0.92 to 0.94. 1 2 3 4 5 6 7 8 9 10 11 12 13 14 15 16 17 18 19 20 21 22 23 24 25 26 27 28 29 30
Aggregate-Level Data Analysis
The collected data were analyzed by two focuses (modes) of analysis: hazard-focused and participant-focused approach, as presented by earlier studies (Bronfman et al. 2008; Willis
et al. 2005). In the former, the aggregate-level analysis involves averaging the responses over
all participants, resulting in a hazardattribute matrix. The latter involves averaging the responses over all hazards, resulting in a participantattribute matrix. The two matrices were analyzed using the principal component analysis, where the number of extracted components was determined using the scree-plot with a cut-off eigenvalue of unity. The resulting component patterns were then rotated using the orthogonal varimax method. For easier reference, the components were given interpretive names based on the associated risk attributes. Following the proposed hybrid analysis by Willis et al. (2005), each hazard’s and participant’s risk ratings were regressed onto the component scores from the respective aggregate-level analysis, separately for the students and professors groups. In the hazard-focused analysis, the regression allows us to evaluate the explanatory power of the extracted components. In the participant-focused analysis, it allows us to use of a common set of
independent variables that leads to more interpretable results.
RESULTS
Mean Risk Ratings Students and professors
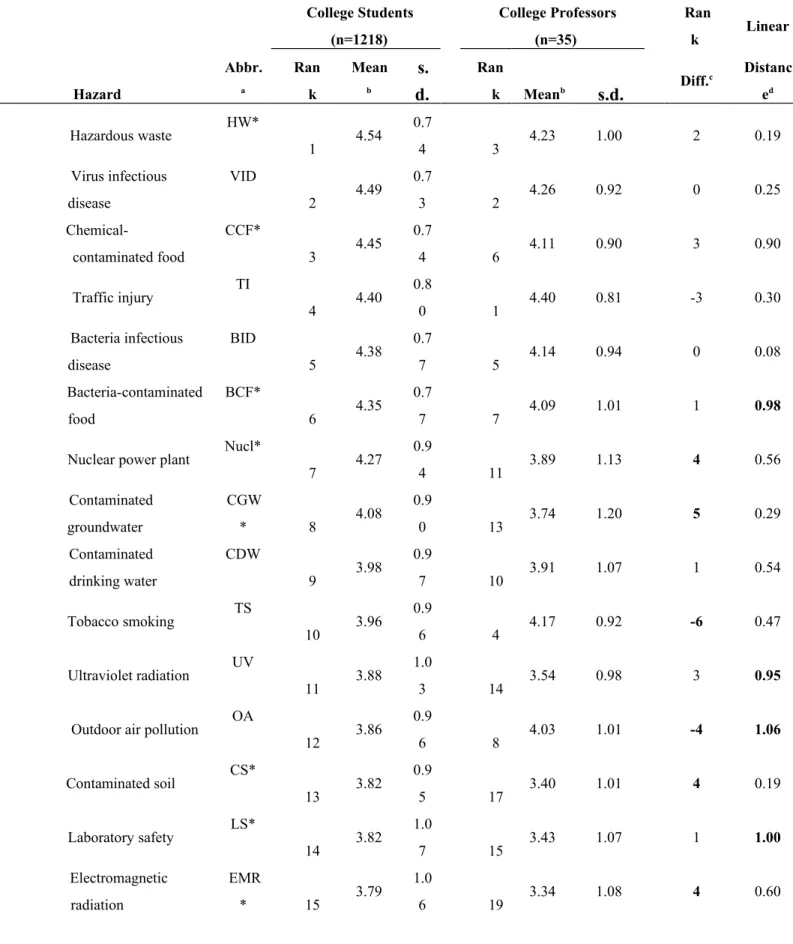
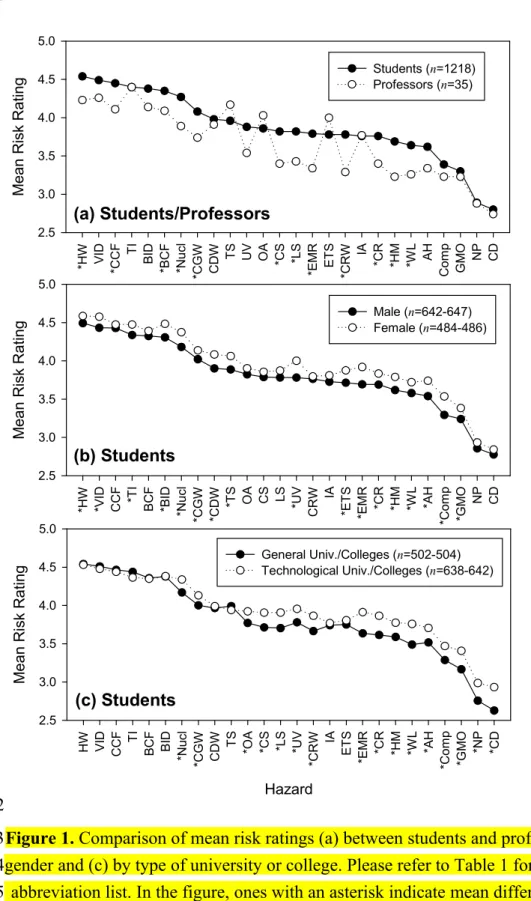
Mean risk ratings of 1,218 college students and 35 college professors on the presented 26 environmental health hazards are given in Table 1 and Figure 1a. The hazards were ranked according to the mean risk ratings of students. In the abbreviation column, ones with an asterisk indicate the mean scores between the two groups are of statistical significance (p < 0.05). The rank differences between the mean risk ratings of two groups are also provided. The results show, in both groups, the mean risk ratings of hazards are all above 3, except for nano-products (NP) and caffeinated drink (CD). In addition, the students’ mean risk ratings on 12 out of the 26 hazards were statistically higher than the professors’, including hazardous waste (HW), chemically- and bacteria-contaminated food (CCF and BCF), nuclear power plant (Nucl), contaminated groundwater, drinking water and soil (CGW, CDW and CS), laboratory safety 1 2 3 4 5 6 7 8 9 10 11 12 13 14 15 16 17 18 19 20 21 22 23 24 25 26 27 28 29 30
(LS), electromagnetic radiation (EMR), contaminated recreation water (CRW), and waste landfill (WL). Although not statistically significant, only 4 hazards did the professors perceive higher risk than the students, i.e., tobacco smoking (TS), outdoor/indoor air pollution (OA/IA) and environmental tobacco smoke (ETS). The ranges of standard deviation (s.d.) for the students and professors are 0.73–1.12 and 0.81–1.20, respectively. In light of the considerably larger sample size, the students have a rather more consistent view of riskiness than the professors. For example, the top 6 risky hazards in the view of those students all have s.d. of less than 0.80.
The rank differences between the two groups exceeding 4 or -4 are shown as bold numbers in Table 1, where positive values indicate the students perceived the hazard more risky than the professors and negative values vice versa, among the given hazards. The professors perceived ETS, TS, IA, OA, and alcohol hazard (AH) of higher risk than the students. On the other hand, the students perceived CGW, Nucl, CS, and EMR of higher risk than the professors (p<0.05). It is interesting to note that the students ranked HW as the most risky hazard among the 26 hazards, of which it was also ranked as the top US public concern with regard to environmental problems polled in 1990 (Roberts 1990). The professors also ranked HW of high risk (3rd), but ranked traffic injury (TI) as the most risky hazard. In addition, both groups ranked virus infectious disease (VID) as the second risky hazard.
Demographic influence on students perceived risk
The students’ mean risk ratings were stratified and computed with respect to collected demographic information, such as gender, type of university, geographical region, and family income. In the following, only gender and type of university are presented because they appear to show statistically significant effect on perceived risk. Although statistically significant, the role of geographical region in perceived risk is not presented due to potential selection bias, where the selected students in the east region are all from technological universities. It is noted that the students from the east region make up only 8% of the total sample size, and hence the bias would not change the overall results.
Among the college students, the mean risk ratings of male (n=647) and female (n=482) students are shown in Figure 1b. Female students, on average, gave higher risk ratings than 1 2 3 4 5 6 7 8 9 10 11 12 13 14 15 16 17 18 19 20 21 22 23 24 25 26 27 28 29 30
male students for all the hazards; ones of statistical significance are highlighted with an asterisk preceding the hazard abbreviation on the x-axis in Figure 1. The largest mean risk rating differences (≥ 0.20) were observed for hazards such as long hours of computer work (Comp), EMR, ultraviolet radiation (UV), and AH. A similar figure was plotted according to the type of university or college the participated students were attending (Figure 1c). As shown, students from technological universities or colleges gave higher risk ratings than students from general universities or colleges, with which exceptions include CCF, BCF, HW, TI, TS, and VID. Similarly, mean risk ratings differences of statistical significance are highlighted with an
asterisk on the x-axis in Figure 1.
With respect to risk ranking, it is interesting to note the consistency between male and female students; the differences in rank for 20 out of the 26 hazards are less than 3 (considered to be similar), except for EMR, CRW, CS, UV, BID, and ETS. An even more consistent risk ranking was observed between students from general universities and from technological universities; 23 out of the 26 hazards have a rank difference of less than 2.
Aggregate-Level Hazard-Focused Principal Component Analysis
The rotated component patterns for the students and professors are presented in Table 2. For the students, Component 1 consists of high positive loadings (> 0.6) of risk attributes of uncontrollable, involuntary, dread, high risk to future generation, fatal consequence, high catastrophic potential, and little preventable measures, and a high negative loading (< -0.6) of delayed effect. This component accounts for 49% of the total variance. Following the interpretation by Slovic et al. (1980), we refer to this Component 1 as the “dread” component. Component 2 consists of high positive loadings of unobservable effect, unknown risk, new risk, and little preventable measures, and little preventable measures, and a high negative loading of many people exposed. This component accounts for 28% of the total variance. We refer to this component as the “unknown” component. Unlike many earlier studies, the delayed effect here is not associated with the “unknown” component. Component 3 consists of high positive loadings of frequently exposed and many people exposed, and accounts for 11% of the total variance. We refer to this component as the “exposure” component. The three components, as a whole, account for 89% of the total variance. It is noted that many people exposed and little 1 2 3 4 5 6 7 8 9 10 11 12 13 14 15 16 17 18 19 20 21 22 23 24 25 26 27 28 29 30
preventable measures both have moderate loadings across Components 1 and 2, showing dual contributions to risk components.
For the professors, Component 1 consists of high positive loadings of unknown risk, unobservable effect, new risk, little preventable measures, delayed effect, and high negative loadings of fatal consequence and high catastrophic potential. This component accounts for 51% of the total variance. We refer to this component as the “unknown” component. Component 2 consists of high positive loadings of uncontrollable, involuntary, dread, high risk to future generation, and high catastrophic potential, accounting for 19% of the total variance. We refer to this component as the “dread” component. Component 3 consists of high positive loadings of many people exposed and frequently exposed, and accounts for 13% of the total variance. We refer to this component as the “exposure” component. The three components, together, account for 82% of the total variance. It is noted that high catastrophic potential has
high loadings across Components 1 and 2.
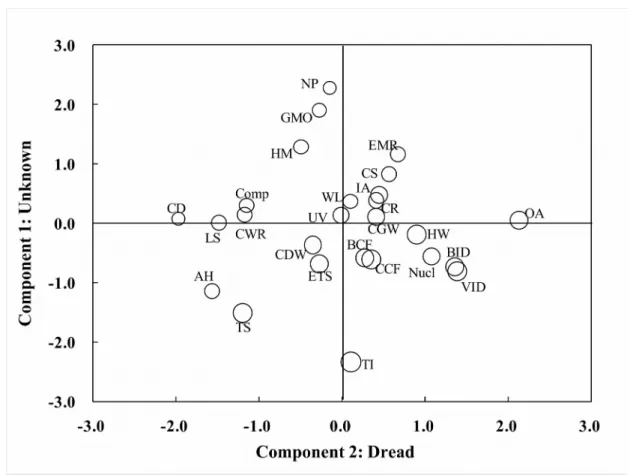
The component scores of all the 26 hazards are plotted on the psychometric space constructed by the two major components “dread” and “unknown” in Figure 2 and Figure 3 for the students and professors, respectively. The size of the circle indicates the mean risk rating; larger circles represent higher perceived risk. Due to the homogenous nature of the presented hazard (i.e., pollutants) and the narrow rating scale (1-5), the risk rating scores (circle sizes) are rather similar and confines within a small range (refer to Table 1), and hence visually shows little obvious trend in the psychometric space. Nevertheless, such data presentation is informative in visualizing the risk attributes of each hazard, relatively to the others. By superimposing Figure 2 onto Figure 3, one can determine how far apart a hazard is located in relation to the students’ and professors’ two-dimensional psychometric space (in this case, dread vs. unknown). A linear distance is therefore calculated between each pair of hazard (last column, Table 1). A large distance is indicative of a larger difference in the perceived risk attributes between the students and professors. The results show that the average linear distance of the 26 hazards is 0.54, with s.d. of 0.34. The hazards with the largest distances (≥ 0.95) include NP, OA, LS, BCF, and UV, whereas the smallest distances (≤ 0.25) include BID, HM, AH, CS, HW, VID, CR, and WL.
1 2 3 4 5 6 7 8 9 10 11 12 13 14 15 16 17 18 19 20 21 22 23 24 25 26 27 28 29 30
Aggregate-Level Participant-Focused Principal Component Analysis
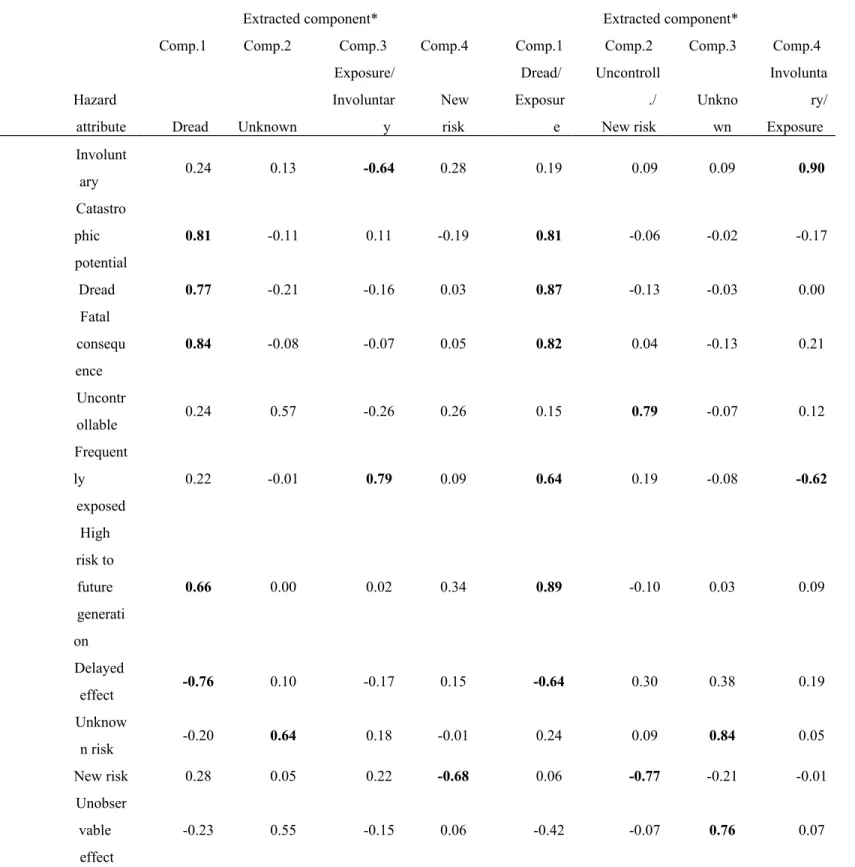
The rotated component patterns for the students and professors are presented in Table 3. For the students, Component 1 consists of high positive loadings of high catastrophic potential, fatal consequence, dread, high risk to future generation, and a high negative loading of delayed effect. This component accounts for 29% of the total variance. We refer to this component as the “dread” component. Component 2 consists of high positive loadings of unknown risk and little preventable measures, as a whole accounts for 13% of the total variance. We refer to this component as the “unknown” component. Component 3 consists of a high positive loading of frequently exposed and a high negative loading of involuntary, and accounts for 10% of the total variance. We refer to this as the “exposure/involuntary” component. Component 4 consists of a high negative loading of new risk, and accounts for 8% of the total variance. We refer to this as the “new risk” component. The four components, together, account for 60% of the total variance. It is noted that three attributes uncontrollable, unobservable effect, and number of
people exposed do not have high loadings on any of the component.
For the professors, Component 1 consists of attributes same as those for the students, except that additional attributes such as the number of people exposed and frequently exposed both have high positive loadings on this component. This component accounts for 37% of the total variance. We refer to this as the “dread/exposure” component. Component 2 consists of a high positive loading of uncontrollable and a high negative loading of new risk, as a whole accounts for 14% of the total variance. We refer to this as the “uncontrollable/new risk” component. Component 3 consists of high positive loadings of unknown risk and unobservable effect, and accounts for 11% of the total variance. We refer to this as the “unknown” component. Component 4 consists of a high positive loading of involuntary and a high negative loading of frequently exposed, and accounts for 10% of the total variance. We refer to this as the “involuntary/exposure” component. The four components, together, account for 71% of the total variance. It is noted that little preventable measures does not have a high loading on any of
the component.
Hybrid Aggregate-Level Regression Analysis
To explore the explanatory power of the components, the mean risk ratings were 1 2 3 4 5 6 7 8 9 10 11 12 13 14 15 16 17 18 19 20 21 22 23 24 25 26 27 28 29 30
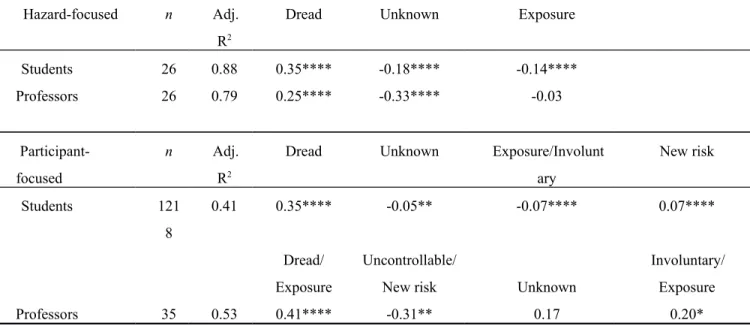
regressed onto the resolved components from the aggregate-level hazard-focused and participant-focused factor analyses (Table 6). In the hazard-focused analysis, the three resolved components predicted the hazards’ mean risk ratings very well for both the students and the professors, with the adjusted R2 of 0.88 and 0.79, respectively. In the case of students, the
hazards’ perceived mean risk ratings increase with increasing dreadfulness, but decrease with increasing unknown and exposure. The same trends were observed for the professors, except that the unknown component plays a more substantial role than the dread component, and that
the exposure component shows very little influence on the perceived risk.
In the participant-focused analysis, the four resolved components predicted the participants’ mean risk ratings relatively poor for both the students and the professors, with the adjusted R2 of 0.41 and 0.53, respectively. The students’ perceived riskiness is strongly affected
by the dread component, whereas the unknown, exposure/voluntary, and oldness components play a relatively minor role in their perceived riskiness. The professors’ perceived riskiness, on the other hand, is strongly affected by the dread/exposure and uncontrollable/new risk components, whereas the exposure/voluntary component plays a relatively minor role. The regression coefficient for the unknown component is not statistical significance, showing its role in perceived risk drops substantially from hazard-focused to participant-focused analysis.
DISCUSSION
Mean risk rating is one of the most common parameters in assessing risk perception. However, different ways of comparing the mean risk ratings, i.e. by absolute scores or ranking, between participant groups provide different implications. In this study, the results show that Taiwan college students and professors perceive above midpoint risk (rating score > 3.0) towards the presented environmental health hazards, except for nano-products and caffeinated drinks. The mean risk ratings of Taiwan college students are generally higher than that of the professors, in which 12 out of 26 are of statistical significance (Figure 1a). Female and technological university students generally give higher risk ratings than male and general university students, respectively (Figure 1b and 1c). This suggests that, in general, the students perceive stronger magnitude of risks than the professors, as do certain sub-group of students. The above results are consistent with previous studies that have shown marked differences 1 2 3 4 5 6 7 8 9 10 11 12 13 14 15 16 17 18 19 20 21 22 23 24 25 26 27 28 29 30
between experts’ and laypeople’s judgments of risk (Siegrist et al. 2007; Slovic et al. 1980). In addition, studies have shown females are more sensitive to risks, particularly to those associated with technology and environmental pollution (Davidson and Freudenburg 1996; Flynn et al. 1994).
Risk ranking, on the other hand, provides information about the relative riskiness among the hazards, and its differences between different participant groups are indicative of potential risk perception gaps. The interpretation of rank difference, however, needed to be exercised with caution, especially when the differences in rank and/or mean risk ratings are small. In this study, we identified a number of risk perception similarities as well as gaps between the students and professors. Amongst, a notable similarity is that both groups ranked virus and bacteria infectious diseases as the second and fifth risky hazards, while they ranked nano-products and caffeinated drinks as the least risky hazards. The high perceived risk of infectious diseases may due in part by the severe acute respiratory syndrome (SARS) epidemic in 2003, resulting in 346 cases and 37 deaths in Taiwan (WHO, 2004). A phone-interview study of 1,028 Taiwan residents showed that 75.1 % of the respondents consider SARS of high or very high fatal risk (Liu et al. 2005). Perception gaps, on the other hand, are of special interests from educational and research perspectives. For example, the students perceive contaminated groundwater, nuclear power plant, contaminated soil, and electromagnetic radiation of significantly higher risk (by mean risk rating and by risk rank) than the professors; on the other hand, they perceive environmental tobacco smoke, tobacco smoking, indoor air pollution, outdoor air pollution, and alcohol hazard of lower relative risk (only by rank) than the professors. In the latter case, the perception gaps may be larger than the data indicated considering the students are generally more sensitive to the hazards. These gaps highlight areas of interest for additional educational and risk communication efforts. More specifically, the students should be informed that certain hazards existed in their daily chronic exposure may be more risky than they perceive, while others do not.
It is interesting to note in Table 1 that large risk-ranking differences do not necessarily correspond to large risk-rating differences between the two groups, and vice versa. Furthermore, the differences in risk perception by mean risk ratings and rank provide little information with regard to why one hazard is perceived more risky than the other, as evident 1 2 3 4 5 6 7 8 9 10 11 12 13 14 15 16 17 18 19 20 21 22 23 24 25 26 27 28 29 30
from the results of the linear distances between the hazard component scores of the students and the professors (last column, Table 1). Taking hazardous waste as an example, the mean risk ratings are statistically different between the two groups, but the linear distance is small, indicating the extent of dread or unknown perceived by the two groups are rather similar. Another example, the differences in mean risk ratings and rank for nano-products are negligible between the students and the professors, but the extent of dread or unknown perceived by the two groups are very different. This underscores the fact that two individuals could give identical risk ratings for a hazard, but the extent to which their respective perceived risk is affected by, for example, dread and unknown could be drastically different.
The students’ judgments on the 13 attributes of certain hazards might shed some light on their lower than expected perceived risk, such as tobacco and air pollution. Students strongly feel there are little preventive measures to reduce risk from both tobacco smoking (rating = 3.74; ranked the highest among all the hazards) and environmental tobacco smoke (ETS) (3.65; ranked second), both of which are perceived as well-known and old or common risks. In the case of outdoor air pollution, the students strongly feel the associated risk is uncontrollable (3.71; ranked third). According to the classic psychometric paradigm, a hazard with little preventive measures and uncontrollable is expected to be perceived more risky (Slovic et al. 1980). However, this is not the case for the students, thus indicating that other risk attributes may play a more influential role in students’ perceived risks of tobacco and air pollution. For example, the students indicated that they are predominantly non-smokers and that the risk from passive exposure to ETS is delayed.
In the aggregate-level principal component analysis, three underlying components were identified for the students and professors, namely dread, unknown, and exposure. However, the relative importance of each component is different between the two groups. The dread and unknown of a hazard are key determinants to the students’ risk perception (Table 2). On the other hand, instead of dread, the unknown component drives the perceived risk of the professors. This suggests the professors have a tendency of weighing more heavily on the unknown than on the dread when assessing risk, agreeing with the general consensus that the risk perception of technical experts is less likely being affected by subjective feelings. Consistent with previous studies, the three components show strong explanatory power when 1 2 3 4 5 6 7 8 9 10 11 12 13 14 15 16 17 18 19 20 21 22 23 24 25 26 27 28 29 30
the focus is the hazards but not so when the focus is the participants, the explained total variance dropped from above 80% to below 70% (Table 3). In addition, the resolved three components expanded into four components when individual differences were taken into account. The conventional dread, unknown, and exposure components are still valid at the individual level, where an additional component related to frequently-exposed and involuntariness emerges for the students, and uncontrollable and new risk emerges for the professors. It is important to note these abstract naming of components becomes inappropriate as the risk attributes related to a certain component may be very different between different subject groups. For example, the professors’ dread component includes high positive loadings on the number of people exposed and frequently exposed, both of which are not included in the students’ dread component. This again stresses that the professors tend to follow the technical
definition of risk and accordingly weigh more on the exposure factor when assessing risk. In the hazard-focused regression analysis, the three components (dead, unknown, and exposure) are shown to be good predictors of how hazards differ from each other and their corresponding perceived risk (Table 2). In the case of the students, the perceived risk of a hazard increases moderately with increasing dreadfulness, and decreases slightly with increasing unknown and exposure. The positive relationship between perceived risk magnitude and dread is consistent with a recent risk perception study of 112 Taiwan college students (Yen and Tsai 2007). In the case of the professors, the perceived risk of a hazard increases moderately with increasing dreadfulness, decreases moderately with increasing unknown, and shows very little dependence on the exposure component. It is noted the perceived risk of the two groups is negatively associated with the unknown component. This indicates the more unknown about a hazard the lower it is perceived as risky. Although contrary to previous studies, such observation may in part because the results could be sensitive to hazards and attributes selected in the study. Nevertheless, a similar inverse relationship had been observed by an earlier study in Hong Kong. Lai and Tao (2003) showed that Hong Kong Chinese tend to perceive higher threat from hazards judged to be “known and old” or “controllable.” Furthermore, Zhai and Suzuki (2009) found that Mainland Chinese tend to be more tolerant of risk than Japanese and South Koreans. The two studies attributed the discrepancy to socioeconomic status and development, environmental conditions, lack of information, 1 2 3 4 5 6 7 8 9 10 11 12 13 14 15 16 17 18 19 20 21 22 23 24 25 26 27 28 29 30
historical and in particularly cultural background (e.g., Confucian teachings). Although sharing similarities, Taiwanese in a number of ways are different from Mainland or HK Chinese. A different study design is required to fully elucidate the underlying reasons to the inverse relationship between risk and unknown.
In the participant-focused regression analysis, the four components are shown to be relative poor predictors of how participants differ from each other in their perceived riskiness. The students’ perceived risk of a hazard increases moderately with increasing dreadfulness, while other components show very small explanatory power. The professors’ perceived risk of a hazard increases moderately with increasing dreadfulness and exposure, decreases moderately with increasing uncontrollable and new risk, and again increases slightly with increasing involuntariness and exposure. The unknown component, on the other hand, is positively related to the perceive risk, though the relationship is not statistical significant. As shown above, the negative association between perceived risk and unknown component becomes less prominent when considering individual differences. This highlights the shortcoming of hazard-focused approach in accounting for the inherent differences that exist among individuals.
CONCLUSION
A questionnaire study, based on the “psychometric paradigm”, was used to explore the relationships between risk characteristics and risk perception of 1,218 college students and 35 college professors in Taiwan. The perceived risk for 26 environmental health hazards and its relationships with 13 risk attributes were investigated. The results show that the college students under study do perceive risk differently than the professors. In some cases, the differences are substantial. For example, with respect to the risk rank, the students perceive contaminated groundwater, nuclear power plant, contaminated soil, and electromagnetic radiation of significantly higher risk than the professors; on the other hand, they perceive environmental tobacco smoke, tobacco smoking, indoor air pollution, outdoor air pollution, and alcohol hazard of lower relative risk than the professors. Despite the various fields of studies, the students show quite similar perceived relative risk, in which female students’ perceived risk magnitude is typically stronger than male students.
The results from the aggregate-level principle component analyses show that the 1 2 3 4 5 6 7 8 9 10 11 12 13 14 15 16 17 18 19 20 21 22 23 24 25 26 27 28 29 30
presented 13 risk attributes can be further condensed into three or four components. Although the extracted components are similar, a noticeable amount of explained variance and explanatory power dropped when the focus changes from hazards to participants. A follow-up hybrid regression analysis shows that, with respect to hazards, the perceived risk increases with increasing dreadfulness, but decreases with increasing unknown. With respect to individuals, the dread component is the dominant factor driving the students’ perceived risk, of which it is positively correlated with uncontrollable, involuntary, high risk to future generation, fatal, catastrophic, and little preventive measures, and negatively associated with delayed effect. Unlike the students, the professors’ perceived risk is not only driven by dread, but also exposure characteristics, uncontrollable, and new risk.
The present study provides valuable information on environmental health risk perception of Taiwan college students. As the primary goal is to characterize the risk perception and the perceived risk attributes with respect to a wide variety of hazards, a detailed discussion on each and every hazard is beyond the scope of the present study. This study identified influential factors of risk perception and potential perception gaps between students and professors. These results could be used to generate a number of hypotheses and serve as a starting point for subsequent in-depth studies of specific hazards, aiming for effective risk education and
communication.
ACKNOWLEDGMENT
The authors appreciate the financial support from the Taiwan Ministry of Education (Contract #0960011818), and the assistance in questionnaire survey and data compilation by Wei-Hsiang Chang and Chia-Jung Lin.
REFERENCES
Bickerstaff K. 2004. Risk perception research: socio-cultural perspectives on the public experience of air pollution. Environ Int 30:827-40.
Bickerstaff K and Walker G. 2001. Public understandings of air pollution: the 'localisation' of environmental risk. Global Environ Chang 11:133-45.
Boholm A. 1998. Comparative studies of risk perception: A review of twenty years of research. J Risk Res
1:135-1 2 3 4 5 6 7 8 9 10 11 12 13 14 15 16 17 18 19 20 21 22 23 24 25 26 27 28 29 30
63.
Bostrom A. 1997. Risk perceptions: "Experts" vs. "Lay People". Duke Enviro Law & Policy Forum 8:101-13. Bouyer M, Bagdassarian S, Chaabanne S, et al. 2001. Personality correlates of risk perception. Risk Anal
21:457-65.
Bronfman NC, Cifuentes LA and Gutierrez VV. 2008. Participant-focused analysis: explanatory power of the classic psychometric paradigm in risk perception. J Risk Res 11:735-53.
Cha YJ. 2000. Risk perception in Korea: a comparison with Japan and the United States. J Risk Res 3:321-32. Chauvin B, Hermand D and Mullet E. 2007. Risk perception and personality facets. Risk Anal 27:171-85. Davidson DJ and Freudenburg WR. 1996. Gender and environmental risk concerns - A review and analysis of
available research. Environ Behav 28:302-39.
Finucane ML, Slovic P, Mertz CK, et al. 2000. Gender, race, and perceived risk: the 'white male' effect. Health Risk Soc 2:159-72.
Fischhoff B, Slovic P, Lichtenstein S, et al. 1978. How safe is safe enough? A psychometric study of altitudes towards technical risks and benefits. Policy Sci 9:127-52.
Flynn J, Slovic P and Mertz CK. 1994. Gender, race and perception of environmental health risks. Risk Anal 12:417-29.
Keown CF. 1989. Risk perceptions of Hong Kongese vs. Americans. Risk Anal 9:401-5.
Kpanake L, Chauvin B and Mullet E. 2008. Societal risk perception among African villagers without access to the media. Risk Anal 28:193-202.
Kraus NN and Slovic P. 1988. Taxonomic analysis of perceived risk - Modeling individual and group perceptions within homogeneous hazard domains. Risk Anal 8:435-55.
Lai C and Tao J. 2003. Perception of environmental hazards in Hong Kong Chinese. Risk Anal 23:669-84. Liu JT, Hammitt JK, Wang JD, et al. 2005. Valuation of the risk of SARS in Taiwan. Health Econ 14:83-91.
Marris C, Langford I, Saunderson T, et al. 1997. Exploring the ''psychometric paradigm'': Comparisons between aggregate and individual analyses. Risk Anal 17:303-12.
Neto F and Mullet E. 2001. Societal risks as seen by Chinese students living in Macao. J Risk Res 4:63-73. Pidgeon NF, Hood C, Jones D, et al. 1992. Risk analysis, perception and management. Royal Society Study
Group, London, UK.
Polit DF and Beck CT. 2006. The content validity index: are you sure you know what's being reported? Critique and recommendations. Res Nurs Health 29:489-97.
Roberts L. 1990. Counting on science at EPA. Science 249: 616-8.
1 2 3 4 5 6 7 8 9 10 11 12 13 14 15 16 17 18 19 20 21 22 23 24 25 26 27 28 29 30 31
Rohrmann B. 1994. Risk perception of different societal groups - Australian findings and crossnational comparisons. Aust J Psychol 46:150-63.
Siegrist M and Cvetkovich G. 2000. Perception of hazards: the role of social trust and knowledge. Risk Anal 20:713-9.
Siegrist M, Keller C, Kastenholz H, et al. 2007. Laypeople's and experts' perception of nanotechnology hazards. Risk Anal 27:59-69.
Sjöberg L. 1996. A discussion of the limitations of the psychometric and cultural theory approaches to risk perception. Radiat Protect Dosim 68:219-25.
Sjöberg L. 2003. Distal factors in risk perception. J Risk Res 6:187-211.
Sjöberg L, Moen B and Rundmo T. 2004. Explaining risk perception: An evaluation of the psychometric paradigm in risk perception study. Norwegian University of Science and Technology, Trondheim, Norway.
Slovic P. 1987. Perception of risk. Science 236:280-5.
Slovic P, Fischhoff B and Lichtenstein S. 1980. Societal risk assessment: how safe is safe enough? Plenum, New York, USA.
Slovic P, Flynn JH and Layman M. 1991. Perceived Risk, trust, and the politics of nuclear waste. Science 254:1603-7.
USEPA (US Environmental Protection Agency). 1987. Unfinished business: A comparative assessment of environmental problems. Office of Policy Analysis, Washington, DC, USA.
Vaughan E and Nordenstam B. 1991. The perception of environmental risks among ethnically diverse groups. J Cross Cult Psychol 22:29-60.
WHO (World Health Organization). 2004. Cumulative number of reported probable cases of severe acute respiratory syndrome (SARS). Available at http://www.who.int/csr/sars/country/table2004_04_21/en/. Accessed March 2014.
Willis HH, DeKay ML, Fischhoff B, et al. 2005. Aggregate, disaggregate, and hybrid analyses of ecological risk perceptions. Risk Anal 25:405-28.
Wilson R and Crouch EAC. 1987. Risk assessment and comparisons - An introduction. Science 236:267-70. Yen NS and Tsai FC. 2007. Risk perception in Taiwan. Asian J Soc Psychol 10:77-84.
Zhai G and Suzuki T. 2009. Risk perception in Northeast Asia. Environ Monit and Assess 157:151-67. Zhang L, He G, Mol A, et al. 2013. Public perceptions of environmental risk in China. J Risk Res 16:195-209. 1 2 3 4 5 6 7 8 9 10 11 12 13 14 15 16 17 18 19 20 21 22 23 24 25 26 27 28 29 30
Table 1. College students' and professors' mean risk ratings on the 26 hazards. College Students (n=1218) College Professors (n=35) Ran k Linear Hazard Abbr. a Ran k Mean b s. d. Ran k Meanb s.d. Diff. c Distanc ed Hazardous waste HW* 1 4.54 0.7 4 3 4.23 1.00 2 0.19 Virus infectious disease VID 2 4.49 0.7 3 2 4.26 0.92 0 0.25 Chemical-contaminated food CCF* 3 4.45 0.7 4 6 4.11 0.90 3 0.90 Traffic injury TI 4 4.40 0.8 0 1 4.40 0.81 -3 0.30 Bacteria infectious disease BID 5 4.38 0.7 7 5 4.14 0.94 0 0.08 Bacteria-contaminated food BCF* 6 4.35 0.7 7 7 4.09 1.01 1 0.98
Nuclear power plant Nucl*
7 4.27 0.9 4 11 3.89 1.13 4 0.56 Contaminated groundwater CGW * 8 4.08 0.9 0 13 3.74 1.20 5 0.29 Contaminated drinking water CDW 9 3.98 0.9 7 10 3.91 1.07 1 0.54 Tobacco smoking TS 10 3.96 0.9 6 4 4.17 0.92 -6 0.47 Ultraviolet radiation UV 11 3.88 1.0 3 14 3.54 0.98 3 0.95
Outdoor air pollution OA
12 3.86 0.9 6 8 4.03 1.01 -4 1.06 Contaminated soil CS* 13 3.82 0.9 5 17 3.40 1.01 4 0.19 Laboratory safety LS* 14 3.82 1.0 7 15 3.43 1.07 1 1.00 Electromagnetic radiation EMR * 15 3.79 1.0 6 19 3.34 1.08 4 0.60
Environmental tobacco smoke ETS 16 3.78 1.0 6 9 4.00 1.03 -7 0.67 Contaminated recreation water CRW * 17 3.78 0.9 9 20 3.29 1.07 3 0.73
Indoor air pollution IA
18 3.76 1.0 3 12 3.77 1.00 -6 0.79 Contaminated river CR* 19 3.76 1.0 1 16 3.40 1.19 -3 0.25
Hazardous mist during shower HM* 20 3.69 1.1 2 22 3.23 1.11 2 0.08 Waste landfill WL* 21 3.64 1.0 2 21 3.26 1.07 0 0.22 Alcohol hazard AH 22 3.62 1.0 6 18 3.34 1.11 -4 0.12 Long hours of computer work Comp 23 3.39 1.0 4 24 3.23 1.03 1 0.46 Genetic modified organisms GMO 24 3.30 1.1 1 23 3.23 0.91 -1 0.67 Nano-products NP 25 2.89 1.1 5 25 2.88 0.99 0 1.32 Caffeinated drinks CD 26 2.80 1.0 7 26 2.74 1.01 0 0.48
aAbbreviation: Ones with an asterisk indicate mean differences with p <
0.05.
bOn a scale from very little risk(1) to very great risk(5).
cBold numbers indicate the rank differences between students and professors are greater than 4 or smaller than -4. dThe linear distance between hazard component scores of the students and the professors in the dread-unknown
psychometric space. 1 2 3 4 5 6
Table 2. College students' and professors' rotated component patterns for the aggregate-level hazard-focused analysis.
Students (n=1218) Professors (n=35) Extracted component* Extracted component* Comp.
1 Comp.2 Comp.3 Comp.1
Comp .2
Comp. 3
Risk attribute Dread
Unknow n Exposur e Unkno wn Dread Exposu re Involuntary 0.91 -0.02 -0.05 -0.09 0.78 -0.37 Catastrophic potential 0.73 -0.40 -0.49 -0.60 0.60 -0.39 Dread 0.91 -0.25 -0.27 -0.53 0.74 -0.32 Fatal consequence 0.78 -0.49 -0.33 -0.75 0.54 -0.31 Uncontrollable 0.97 0.07 0.03 -0.02 0.89 0.23 Frequently exposed -0.06 -0.10 0.90 0.24 -0.15 0.78
High risk to future generation 0.85 0.00 0.00 -0.11 0.74 -0.13
Delayed effect -0.68 0.37 0.52 0.65 -0.43 0.36
Unknown risk -0.33 0.91 -0.04 0.94 -0.23 -0.10
New risk -0.12 0.80 -0.12 0.84 -0.11 0.05
Unobservable effect -0.13 0.97 0.06 0.94 -0.20 -0.05
No. of people exposed -0.18 -0.62 0.71 -0.14 -0.06 0.95
Little preventable measures 0.62 0.76 -0.13 0.83 0.39 0.14
Fraction of variance explained 0.49 0.28 0.11 0.51 0.19 0.13
Sum of fraction explained 0.89 0.82
*Loadings greater than 0.6 or smaller than -0.6 are in boldface.
Table 3. College students' and professors' rotated component patterns for the aggregate-level participant-focused analysis
Students (n=1218) Professors (n=35)
Extracted component* Extracted component*
Comp.1 Comp.2 Comp.3 Comp.4 Comp.1 Comp.2 Comp.3 Comp.4
Hazard
attribute Dread Unknown
Exposure/ Involuntar y New risk Dread/ Exposur e Uncontroll ./ New risk Unkno wn Involunta ry/ Exposure Involunt ary 0.24 0.13 -0.64 0.28 0.19 0.09 0.09 0.90 Catastro phic potential 0.81 -0.11 0.11 -0.19 0.81 -0.06 -0.02 -0.17 Dread 0.77 -0.21 -0.16 0.03 0.87 -0.13 -0.03 0.00 Fatal consequ ence 0.84 -0.08 -0.07 0.05 0.82 0.04 -0.13 0.21 Uncontr ollable 0.24 0.57 -0.26 0.26 0.15 0.79 -0.07 0.12 Frequent ly exposed 0.22 -0.01 0.79 0.09 0.64 0.19 -0.08 -0.62 High risk to future generati on 0.66 0.00 0.02 0.34 0.89 -0.10 0.03 0.09 Delayed effect -0.76 0.10 -0.17 0.15 -0.64 0.30 0.38 0.19 Unknow n risk -0.20 0.64 0.18 -0.01 0.24 0.09 0.84 0.05 New risk 0.28 0.05 0.22 -0.68 0.06 -0.77 -0.21 -0.01 Unobser vable effect -0.23 0.55 -0.15 0.06 -0.42 -0.07 0.76 0.07
No. of people exposed 0.49 -0.03 0.34 0.56 0.79 0.08 0.10 0.16 Little preventa ble measure s -0.06 0.70 -0.04 -0.23 -0.27 0.43 -0.09 -0.12 Fraction of variance explaine d 0.29 0.13 0.10 0.08 0.37 0.14 0.11 0.09 Sum of fraction explaine d 0.59 0.70
*Loadings greater than 0.6 or smaller than -0.6 are in boldface.
1 2
Table 4. Regression coefficients for predicting the perceived risk using the aggregate-level hazard-focused and participant-hazard-focused factor scores.
Hazard-focused n Adj. R2
Dread Unknown Exposure
Students 26 0.88 0.35**** -0.18**** -0.14**** Professors 26 0.79 0.25**** -0.33**** -0.03 Participant-focused n Adj. R2
Dread Unknown Exposure/Involunt ary New risk Students 121 8 0.41 0.35**** -0.05** -0.07**** 0.07**** Dread/ Exposure Uncontrollable/
New risk Unknown
Involuntary/ Exposure Professors 35 0.53 0.41**** -0.31** 0.17 0.20* ****p < 0.001; ***p < 0.005; **p < 0.01; *p < 0.05 1 2
Hazard *H W *V ID C C F *T I B C F *B ID *N u cl *C G W *C D W *T S O A C S LS *U V C R W IA *E T S *E M R *C R *H M *W L *A H *C om p *G M O N P C D M ea n R is k R at in g 2.5 3.0 3.5 4.0 4.5 5.0 Male (n=642-647) Female (n=484-486) Hazard H W V ID C C F TI B C F B ID *N uc l *C G W C D W TS *O A *C S *L S *U V *C R W IA E T S *E M R *C R *H M *W L *A H *C o m p *G M O *N P *C D M ea n R is k R at in g 2.5 3.0 3.5 4.0 4.5 5.0 General Univ./Colleges (n=502-504) Technological Univ./Colleges (n=638-642) (b) Students (c) Students *H W V ID *C C F TI B ID *B C F *N u cl *C G W C D W TS UV OA *C S *L S *E M R E T S *C R W IA *C R *H M *W L A H C om p G M O N P C D M ea n R is k R at in g 2.5 3.0 3.5 4.0 4.5 5.0 Students (n=1218) Professors (n=35) (a) Students/Professors
Figure 1. Comparison of mean risk ratings (a) between students and professors, (b) by
gender and (c) by type of university or college. Please refer to Table 1 for the hazard abbreviation list. In the figure, ones with an asterisk indicate mean differences with p < 0.05. 1 2 3 4 5 6
Figure 2. Students’ aggregate-level hazard-focused component scores of 26
environmental health hazards on Component 1 (dread) and Component 2 (unknown) psychometric space. The abbreviations of the hazards are listed in Table 1. The size of the circle indicates the mean risk rating, on a 1-5 scale, where larger circles are perceived
more risky relative to other hazards. 1 2 3 4 5 6 7
Figure 3. Professors’ aggregate-level hazard-focused component scores of 26
environmental health hazards on Component 2 (dread) and Component 1 (unknown) psychometric space. Note the components for the professors are swapped in order to be consistent with the students’ psychometric map representation. The abbreviations of the hazards are listed in Table 1. The size of the circle indicates the mean risk rating, on a 1-5 scale, where larger circles are perceived more risky relative to other hazards.
1 2 3 4 5 6 7 8