* Author for correspondence. Tel: +886-2-2363-0231 ext. 3813; Fax: +886-2-2362-7044; E-mail: [email protected]
Development and Application of a Nested Polymerase Chain
Reaction Method for the Detection of Genetically Modified
Soybean in Chinese Traditional Fermented Soy Food-sufu
CHIA-CHIA HUANG, TSUNG-WEI SHIH AND TZU-MING PAN*
Institute of Microbiology and Biochemistry, National Taiwan University, 1, Sec. 4, Roosevelt Rd., Taipei 106, Taiwan, R.O.C.
(Received: March 12, 2004; Accepted: June 2, 2004)
ABSTRACT
A nested PCR method has been developed to distinguish traditional soybean from transgenic Roundup Ready soybeans (RRS). Comparing with the standard PCR method, the nested PCR method increases the sensitivity by 200 to 1000-fold. One copy of RRS genome can be detected by the nested PCR. Sufu, a traditional fermented soybean curd, is a very important Chinese condiment and it is a highly processed food. We have used the nested PCR to detect seven time points of sufu throughout the aging period. The nested PCR method showed positive results for sufu made up of 100% RRS at all seven time points from 0th day to 180th day. This work describes the development and application of a sensitive and specific detection method for sufu made from RRS using a nested PCR system.
Key words: genetically modified organism (GMO), Roundup Ready soybean (RRS), sufu, fermented food, detection, polymerase chain reaction (PCR), nested PCR
INTRODUCTION
Due to the great advances in agricultural biotechnolo-gy, scientists are able to use artificial genetic manipulations successfully to transfer herbicide-tolerant, insect-resistant genes into traditional crops. Since 1996, many transgenic plants were grown widely and sold in the global market. In addition, people paying more attention to the impacts on the environmental, ethical issues, global trade and food safety. The most important of all is food safety, so every country needs to set up regulations to restrict the technology or sale of food products derived from biotech while taking both biotechnology development and the right of the consumers into account. The development and application of reliable detection and quantitative analytical methods is essential for the implementation of labeling requirements. Therefore, several laboratories have developed methods, detecting of GM-soybean (Roundup ReadyTM soybean, RRS) which covers the most output in the world, based either on DNA detection using the polymerase chain reaction (PCR)(1,2)or on protein detection using enzyme linked immunosorbent assays methods (ELISA)(2,3,4), micro fabricated devices, DNA chip technology and nano scale genetically modified organism (GMO) analysis(5,6)are also widely used.
Nested PCR consists of primary and secondary PCR. Secondary PCR is used to amplify the primary PCR product, as well as determine if the primary PCR product contains certain sequences. Therefore, the nested PCR has better specificity and sensitivity than standard PCR proce-dures that uses a single primer pair. Use of the nested PCR
can effectively eliminate false-positive and false-negative results in the detection of GMOs in food(7-10).
The genetically modified (GM) food can be whole foods containing new genetic materials (e.g. Roundup Ready GM soybean), processed foods containing ingredi-ents of new genetic materials (e.g. tofu produced from GM soybean) or highly refined foods derived from GM organ-isms but containing little or no new genetic materials (e.g. soybean oil). Sufu, a traditional Chinese fermented soybean curd, is a soft cheese-like product made from cubes of soybean curd (tofu). Also known as to-fo-zu or Chinese cheese, sufu possesses a characteristic flavor and high protein content and is widely consumed by the Chinese people as a condiment for centuries(11). Sufu, a highly processed food, with a low DNA content, results in PCR not working well(12). In the previous study, when nested PCR was applied in miso, also a well-known traditional Chinese fermented condiment, the results were indeed better than the traditional PCR. Unfortunately, PCR and nested PCR cannot give positive results to the detection of the transgenic components in miso(13). Since the PCR system failed to detect RRS in sufu, we did a serial detection of RRS during the aging period of sufu by nested PCR to validate the appli-cation of nested PCR to detect RRS in sufu.
MATERIALS AND METHODS
I. Materials
Maize powder of certified reference material IRMM-411 (Bt176) contained 0%, 0.1%, 0.5%, 1%, 2%, 5%
GM-maize were purchased from Sigma (St. Louis, MO, USA). Traditional soybean (MT21) and RRS (Monsanto, St. Louis, MO, USA) were provided by the American Soybean Association. Seeds of three lines of GM-maize, i.e. the insect-resistant MON810, glyphosate-tolerant GA21 and NK603, were developed and provided by Monsanto Company. Tainung No. 2 maize (non-GMO) was provided by Dr. Hwang, Wen-Dar (Instructor, Department of Agoronomy, National Taiwan University). Japonica rice, long-grain glutinous rice and round-grain glutinous rice were provided by Dr. Lai, Hsi-Mei (Assistant Professor, Department of Agricultural Chemistry, National Taiwan University). Other cereals were purchased from a seed store in Taipei County.
Sufu samples were manufactured in our laboratory(14). GMO and non-GMO sufu samples were made of 100% RRS and 100% MT21, respectively. The mold used in the sufu fermentation is Actinomucor taiwanesis BCRC 31159, which is widely used in Taiwan and Hong Kong.
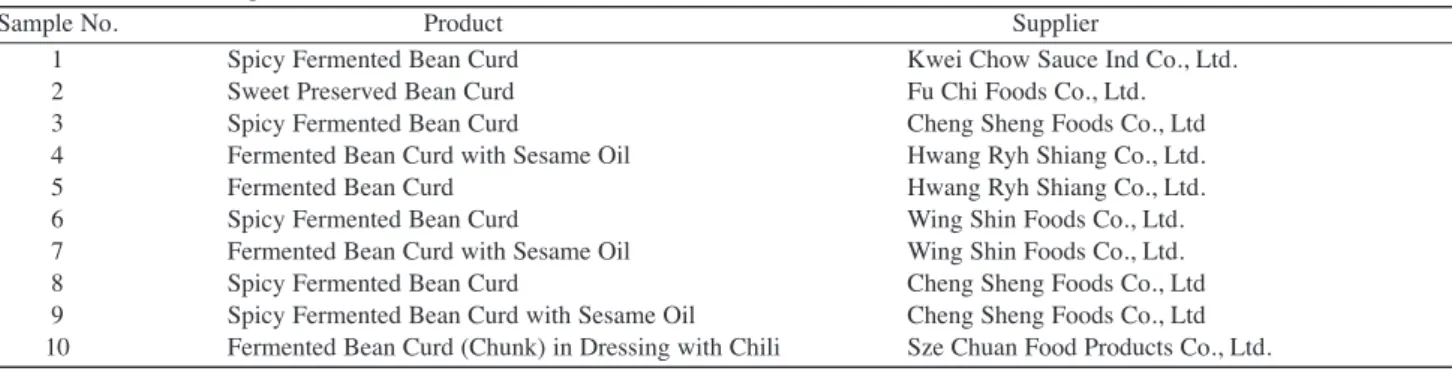
Sufu samples were collected at seven time points during the production process (0th, 30th, 60th, 90th, 120th, 150th, 180th days of aging). Ten commercial sufu products were collected from supermarkets and traditional markets in Taipei, Taiwan (Table1).
II. DNA Extraction and Quantification
We used liquid nitrogen to freeze cereal seeds and then ground them into smooth powder by Barista blade-grinder (Starbucks Coffee, Seattle, Washington, USA). During the aging stage, we took one cube of sufu from storage bottle every 30 days and mixed it well with porcelain mortar and pestle. After grinding, cereal powders and sufu samples were stored at -20˚C. Ground samples (50 mg seeds or 600 mg sufu) were taken for DNA extrac-tion. DNA was extracted according to the cetyltrimethy-lammonium bromide (CTAB) method(15). The ground sample was diluted in 500 µL of CTAB buffer (20 g CTAB/L, 1.4 M NaCl, 0.1 M Tris/HCl, 20 mM EDTA) and added 10 µL of RNase A solution (0.5 mg/mL) (Sigma, St. Louis, Missouri, USA). After incubation for 30 min at 65˚C, the mixture was then centrifuged for 10 min at 12,000 ×g. The upper layer was extracted with an equal volume of CI solution (chloroform: isoamylalcol = 24:1).
After mixing for 30 sec, the mixture was centrifuged for 10 min at 11,500 ×g. The supernatant was transferred to a new tube, and two volumes of CTAB precipitation solution (5 g CTAB/L, 0.04 M NaCl) were added. The mixture was incubated for 60 min at room temperature and then cen-trifuged for 5 min at 12,000 ×g. The supernatant was removed, and the precipitate was dissolved in 350 µL of 1.2 M NaCl. This solution was CI extracted. The upper layer (aqueous phase) was transferred to a new tube and 0.7 volumes of isopropanol was added and centrifuged. The resulting DNA pellet was washed with ice-cold 70% ethanol and centrifuged. The ethanol layer was discarded, and the residual ethanol was removed by evaporation. The DNA pellet was resuspended in double distilled water. The DNA concentration of solution was determined by OD260.
DNA concentration (µg/mL) = (OD260) × (dilution
factor) × (50 µg DNA/mL)/(1 OD260unit)
III. Experimental Design of the PCR System
(I) Determination of annealing temperature of PCR by gradient PCR
To determine the annealing temperature (Ta) of PCR, PCR reactions were carried out on a PCR Express (TheromoHybaid, Ashwalk, Middlesex, UK) in a total volume of 20 µL consisted of 2.5 mM MgCl2, 4 µL of
bovine serum albumin (2 µg/mL), 200 µM each of dNTP, 0.2 µM of each primer, 2 U VioTaq DNA polymerase (Viogen, Taipei, Taiwan), 1X reaction buffer (2 mM Tris-HCl, 0.01 mM EDTA, 0.1 mM DTT, 0.1% Triton X-100, 5% glycerol, pH 8.0) supplied with VioTaq DNA poly-merase and 4 µL of DNA template (12.5 ng/µL). The primer sequences used in this study were according to the study of Köppel et al. (1997) and are listed in Table 2(8). PCR amplifications were performed under the following condition: 5-min initial denaturation at 94˚C followed by 30 cycles of 30-sec denaturation at 94˚C, 45-sec annealing at 54˚C to 66˚C (12 gradient), 30-sec extension at 72˚C and a final 4-min extension at 72˚C. For determination of primer concentrations, PCR was carried out as described above except the reaction mix containing 0.2, 0.4 or 0.6 µM of each primer.
PCR products were examined on 2% agarose gel
elec-Table 1. Commercial sufu products
Sample No. Product Supplier
1 Spicy Fermented Bean Curd Kwei Chow Sauce Ind Co., Ltd.
2 Sweet Preserved Bean Curd Fu Chi Foods Co., Ltd.
3 Spicy Fermented Bean Curd Cheng Sheng Foods Co., Ltd
4 Fermented Bean Curd with Sesame Oil Hwang Ryh Shiang Co., Ltd.
5 Fermented Bean Curd Hwang Ryh Shiang Co., Ltd.
6 Spicy Fermented Bean Curd Wing Shin Foods Co., Ltd.
7 Fermented Bean Curd with Sesame Oil Wing Shin Foods Co., Ltd.
8 Spicy Fermented Bean Curd Cheng Sheng Foods Co., Ltd
9 Spicy Fermented Bean Curd with Sesame Oil Cheng Sheng Foods Co., Ltd 10 Fermented Bean Curd (Chunk) in Dressing with Chili Sze Chuan Food Products Co., Ltd.
trophoresis using 5 µL of the PCR solution in 0.5X TAE buffer. The gel was stained with 0.2 mg/mL ethidium bromide (EtBr). The stained gel were examined under UV light (Vilber Lourmat Co., Marne La Vallee, France) and analyzed by Kodak Electrophoresis Documentation and Analysis System 290 (Kodak, CA, USA).
(II) PCR and nested PCR
For detection of RRS, PCR was carried out as previ-ously described with the following modification: the reaction mixture contained 0.2 µM of each primer. After an initial denaturation at 94˚C for 5 min, 30 cycles of 30-sec denaturation at 94˚C, annealing for 45 sec at 58˚C for RR04/05; 62˚C for RR01/02, 30-sec extension at 72˚C and a final extension for 4 min at 72˚C. In the nested PCR, the primer set of RR04/05 would amplify the PCR product of RR01/02. For the nested PCR, 1 µL of the first PCR reaction was taken and amplified using the same thermal profile and reaction mixture as before.
(III) The specificity of PCR and nested PCR
To determinate the specificity of PCR and nested PCR in this study, we prepared 20 cereal seeds including GMO seeds: RRS, GA21 maize, MON810 maize, NK603 maize and Bt176 maize as well as other fifteen non-GMO cereals (Table 3). PCR and nested PCR were carried out as described for the detection of RRS, except the addition of 100 ng genomic DNA of each cereals.
RESULTS AND DISCUSSION
I. DNA Extraction
Due to the many protective structures in plant cell, we used liquid nitrogen to freeze soybean seeds before we were to blend and ground the seeds into smooth powder. Sufu is rich of water (70%~80% water content) and quite soft and smooth, so we simply mixed it well by mortar and pestle. The mixing step was necessary because sufu was covered by mold, and the DNA content of outside layer was different from that of inside. CTAB is a cationic detergent useful for the purification of DNAs from organisms such as plants that produce large quantities of polysaccharides(16). The CTAB method of Tinker et al. was validated by many GMOs laboratories(15), and easy to conduct. Therefore, the method was chosen in this study(15,17). The CTAB method applied to all cereal seeds in this study produced good yields of DNA, and the purities of DNA expressed as OD260/OD280ratios were above 1.8. RNase A was used to
remove the RNA disturbance of DNA quantification. Because of the low DNA content in sufu, we took 600 mg of sufu for DNA extraction. It took about 3~3.5 hr to extract 24 DNA samples.
II. Determination of the Optimal Annealing Temperature of PCR
Due to the temperature gradient of thermal cycler, it was possible to test 12 temperatures simultaneously, thereby reducing the time required to decide the optimal annealing
Figure 1. Use temperature gradient method to determine the best annealing temperature for PCR. Primers: (A) RR01/02 (B)RR04/05; Lane M,
Bio-100TMladder; Lane 1~12: Ta 54.1˚C, Ta 54.4˚C, Ta 55.0˚C, Ta 56.2˚C, Ta 57.5˚C, Ta 59.1˚C, Ta 60.6˚C, Ta 62.3˚C, Ta 64.1˚C, Ta 65.2˚C, Ta 65.8˚C and Ta 66.2˚C, respectively. 1 2 3 4 5 6 M 7 8 9 10 11 12 509 bp (A) (B) 180 bp 1 2 3 4 5 6 M 7 8 9 10 11 12
Table 2. Primer sequences used to detect transgenic soybean
Orientation Name Sequence (5’-3’) Gene Amplicon (bp) Ref.
Sense (outer) RR01 TGG CGC CCA TGG CCT GCA TG P-35Sa
509 3
Antisense (outer) RR02 CCT TCG CAA GAC CCT TCC TCT ATA cp4-epspsb Sense (inner) RR04 CCC CAA GTT CCT AAA TCT TCA AGT CTP4c
180 3
Antisense (inner) RR05 TGC GGG CCG GCT GCT TGC A cp4-epspsb
aP-35S: cauliflower mosaic virus 35S promoter.
bcp4-epsps: 5-enolpyruvylshikimate-3-phosphate synthetase from Agrobacterium tumefaciens strain CP4. cCTP4: petunia cell transit peptide sequence.
temperature (Ta) for the primer sets. The gradient PCR results (Ta: 54˚C~66˚C) are shown in Figure 1. In the gradi-ent PCR, non-specific PCR products are likely to occur at lower Ta, while worse PCR efficiency occurs at higher Ta. For instance, the primer set RR01/02 got more non-specific PCR products below 62.3˚C (Figure 1, lane 8) and fewer PCR products above 65.2˚C (lane 10). The same results also happened in RR04/05 below 57.5˚C and above 65.2˚C. The primer sets of RR01/02 and RR04/05 showed good speci-ficity for RRS between 62.3˚C~66.2˚C and 59.1~66.2˚C, respectively. In order to achieve the best yield of the PCR products and specific results of the detection method, 58˚C and 62˚C were chosen as the Ta for the amplification of RRS by RR04/05 and RR01/02.
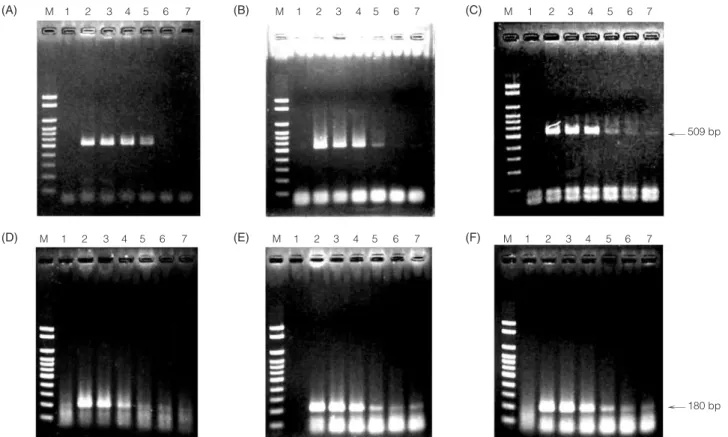
III. The Detection Limit of PCR and Nested PCR for RRS The detection limit of the PCR and nested PCR system was determined with RRS genomic DNA of 50 ng to 2.5×10⁻³ng, approximately 20500 and 1 copies of genomic DNA(18). The PCR results are shown in Figure 2. When the concentration of primer was 0.2 µM, the PCR detection limit of RR01/02 and RR04/05 was 0.5 ng and 2.5 ng, respectively. When concentration of RR01/02 increased to 0.6 µM, a better detection limit about 0.25 ng was obtained. When raising the concentration of primer to 0.4 µM and 0.6 µM, we obtained better detection limit of RR04/05 between 0.25~0.5 ng. Although better detection limit was obtained
using higher concentrations of primers, worse primer-dimer resulted and interferred with identification of positive results. The nested PCR detection limit was 2.5×10⁻³
ng (one copy) when 0.2 µM of RR01/02 and RR04/05 were used (Figure 3). Comparing with the PCR method, sensi-tivity of the nested PCR method was increased by addition-al 200 to 1000-fold. High sensitivity prevented the faddition-alse- false-negative results in RRS detection in food, especially for a
Figure 2. PCR detection limit of RRS with different conditions. Primers: (A) 0.2 µM of RR01/02 (B) 0.4 µM of RR01/02 (C) 0.6 µM of
RR01/02 (D) 0.2 µM of RR04/05 (E) 0.4 µM of RR04/05 (F) 0.6 µM of RR04/05; Lane M, Bio-100TMladder; Lane 1, blank ddH2O; Lane 2~7: 50, 12.5, 2.5, 0.5, 0.25 and 0.05 ng DNA of RRS, respectively.
(B) (C) (A) (E) (F) (D) M 1 2 3 4 5 6 7 M 1 2 3 4 5 6 7 M 1 2 3 4 5 6 7 M 1 2 3 4 5 6 7 M 1 2 3 4 5 6 7 M 1 2 3 4 5 6 7 509 bp 180 bp
Figure 3. Nested PCR detection limit of RRS with 0.2 µM of
primers. Lane M, Bio-100TM ladder; Lane 1, blank; Lane 2~7, 0.5, 0.25, 0.05, 0.025, 0.005 and 0.0025 ng genomic DNA of RRS, respectively.
low proportion of RRS.
Four controls were also carried in PCR detection: positive control (100% RRS), negative control (non-GM RRS), blank (double distilled water) and reagent control (without primers). No specific PCR products existed in the negative control, blank and reagent control. By comparing the result of reagent control with that of the other control reactions, we found that smear resulted from primer-dimers. The positive control is very important to make sure that no inhibitions happened in PCR because some PCR inhibitors may be difficult to be removed by CTAB method. For example, low concentrations of acidic poly-saccharides can inhibit the PCR reaction by inhibiting Taq DNA polymerase activity(19). On the other hand, the negative control helps to delete the false-positive results due to PCR contaminations.
Primer-dimer often decreases the detection limit of PCR. To avoid the formation of primer-dimer, we can use hot-start Taq or prepare PCR reagents on ice(20,21). If possible, a primer set which produces no primer-dimers should be used.
IV. The Specificity of PCR and Nested PCR
Construct-specific primers target the junction of adja-cent elements in the gene construct, for example the region between the promoter and the gene of interest. With the construct-specific methods, a positive signal will only appear in the GM-derived material, and it would be possible to identify the GM source of the DNA(22). In this study, primers RR01/02 were used to amplify the region between P-35S (CaMV 35S promotor) and 5-enolpyruvylshikimate-3-phosphate synthase (cp4-epsps); primers RR04/05 were used to amplify the region between CTP4 (petunia cell transit peptide sequence) and cp4-epsps. By using of
RR01/02 and RR04/05 to perform the standard PCR and nested PCR, a positive signal will only appear in the RRS sample. To validate the specificity of construct- specific primers RR01/02 and RR04/05, four GM-maize were select-ed in the test of specificity. Bt176, MON810 and NK603 all carry CaMV 35S promoter. GA21 and NK603 contain the same gene cp4-epsps. The results are shown in Table 3, and positive results appeared only in RRS samples. Furthermore, the nested PCR usually have better specificity than standard PCR. The increase in specificity results from the nested primer not annealing to any primer dimers or primer oligomers created in the PCR reaction. Many cereals are used in soy-derived fermentation products. For example, peanuts, barley and japonica rice are used in the production of sweet simmered miso, barley miso and rice miso, respectively; wheat flour are used to make chili bean sauce. The high specificity prevented the false-positive results of RRS detection in complex food.
V. Nested PCR Detection of GM-sufu
Sufu is a highly processed product whose manufactur-ing process consists of several steps, i.e. preparation of tofu, preparation of pehtze (tofu on which mold has been recently cultured), salting and aging. During the aging period, enzymes produced by molds act upon protein and lipid, yielding various hydrolytic products. The characteristic flavor and aroma of sufu then gradually develop during the aging process, whereas freshly molded soybean curd is bland in taste. It often takes about one to six months for sufu to mature(11). In Pan and Shih’s research in 2003, PCR was used to monitor DNA degradation during the fermenta-tion period. The PCR detecfermenta-tion system showed positive results before 150th day of aging and false-negative results thereafter(13). It was concluded that PCR is not a suitable
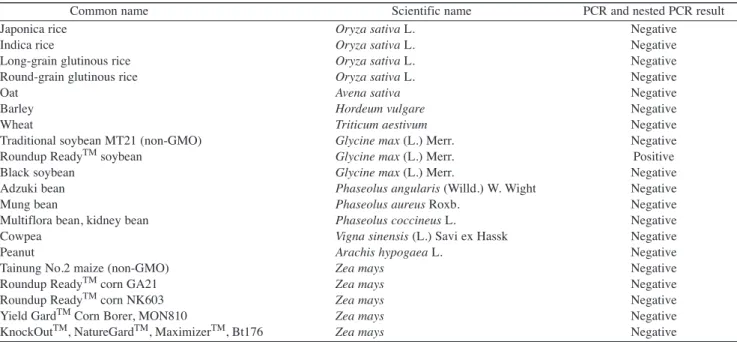
Table 3. Specificity results of PCR and nested PCR
Common name Scientific name PCR and nested PCR result
Japonica rice Oryza sativa L. Negative
Indica rice Oryza sativa L. Negative
Long-grain glutinous rice Oryza sativa L. Negative
Round-grain glutinous rice Oryza sativa L. Negative
Oat Avena sativa Negative
Barley Hordeum vulgare Negative
Wheat Triticum aestivum Negative
Traditional soybean MT21 (non-GMO) Glycine max (L.) Merr. Negative
Roundup ReadyTMsoybean Glycine max (L.) Merr. Positive
Black soybean Glycine max (L.) Merr. Negative
Adzuki bean Phaseolus angularis (Willd.) W. Wight Negative
Mung bean Phaseolus aureus Roxb. Negative
Multiflora bean, kidney bean Phaseolus coccineus L. Negative
Cowpea Vigna sinensis (L.) Savi ex Hassk Negative
Peanut Arachis hypogaea L. Negative
Tainung No.2 maize (non-GMO) Zea mays Negative
Roundup ReadyTMcorn GA21 Zea mays Negative
Roundup ReadyTMcorn NK603 Zea mays Negative
Yield GardTMCorn Borer, MON810 Zea mays Negative
RRS detection method for sufu. And the results revealed the key point of sampling is the aging period. In this study, sufu samples were collected at seven time points during the aging period of the production process (0th, 30th, 60th, 90th, 120th, 150th, and 180th days of aging). The nested PCR analysis was performed after the aging stage finished. Contrary to the previous study, the nested PCR results were all positive during the aging period; e.g. on the 180th day of fermentation, the nested PCR was still able to detect the transgenic component in sufu (Figure 4).
VI. PCR and Nested PCR Detection of RRS in Commercial Sufu Products
In October, 2001, ten commercial sufu products were collected from supermarkets and traditional markets in Taipei, Taiwan (Table 1). Primary PCR product was diluted 50× for the secondary amplification. As shown in Figure 5 (A), there were five positive results (sample No. 1, 2, 3, 8 and 9) of PCR, using RR04/05 as primer pairs. Nine out of ten results of nested PCR were positive as shown in Figure 5 (B); only No. 5 sample had negative result. The false-negative results of PCR in Figure 5 (A) (sample No. 4, 6, 7
and 10) might be due to the serious degradation of DNAs resulted from the thermal, chemical, microbial, and enzymatic reactions during production.
In 2000, a screen test of RRS was performed by Bureau of Food and Drug Analysis, Department of Health (DOH), Executive Yuan, Taiwan, R.O.C. Sixty-three out of seventy-six commercial soy or soy-derived products were RRS positive. The products screened in the screen test were raw materials (soybean seeds and soy sprouts) or lightly processed products (soymilk, tofu and tofu pudding)(23). Combining the DOH’s screen test in 2000 with the screen test of commercial sufu products in this study in 2001, both showed that about 80% soy products in the market contained RRS.
CONCLUSIONS
In the nested PCR, the second-round PCR is set up in the presence of first-round PCR amplification products, which increases the risks of contamination by product DNA. To avoid this: (1) Separate the equipments and reagents for GMO testing from non-GMO in order to reduce the chance of carryover and contamination. (2) Take special care in every procedure from sampling to result interpretation. In view of these problems, it is important to ensure that, appropriate positive and negative controls are employed in addition to the use of standard PCR procedures. The examination process in this study takes about 8 hr including DNA extraction, nested PCR and electrophoresis. Therefore, the shortcomings of nested PCR are time-consuming and labor-intensive.
In this study nested PCR were proven to be a useful method in the detection of false-negative results of PCR. In addition, the cross-junction nested PCR revealed high specificity of RRS without sequencing, which was necessary for the identification of the PCR results in order to avoid false-positive and false-negative results. The nested PCR protocols would provide a reliable method for detecting the presence of genetically modified (GM) material in various foods.
Figure 5. PCR and nested PCR detection of RRS in commercial sufu products. Primers: (A) RR04/05 (B) outer primer RR01/02, inner primer
RR04/05; Lane P, positive control; Lane N, negative control; Lane R, reagent control; Lane B, blank; Lane M, Bio-100TMladder; Lane 1~10, No.1~No.10 commercial sufu products.
Figure 4. Nested PCR products amplified from different aging
periods of sufu samples. Lane P, positive control; Lane N, negative control; Lane R, reagent control; Lane B, blank; Lane M, Bio-100TM ladder; Lane 1~7, sufu after 0, 30, 60, 90, 120, 150 and 180 days of aging, respectively.
P N B R M 1 2 3 4 5 6 7
P N B R M 1 2 3 4 5 6 7 8 9 10 P N B R M 1 2 3 4 5 6 7 8 9 10
10. Zimmermann, A., Hemmer, W., Liniger, M., Lüthy, J. and Pauli, U. 1998. Sensitive detection method for genetically modified MaisGardTM corn using a nested PCR-system. Lebensm. Wiss. U. Technol. 31: 664-667. 11. Jan, D. C. 1997. Chinese cheese-sufu. J. Food Ind. 29:
33-39.
12. Pan, T. M. and Shih, T. W. 2003. Detection of genetical-ly modified soybeans in miso by pogenetical-lymerase chain reaction and nested polymerase chain reaction. J. Food Drug Anal. 11: 154-158.
13. Pan, T. M. and Shih, T. W. 2003. Detection of genetical-ly modified soybeans in chou-tou-fu and tou-fu-ju by polymerase chain reaction. Taiwanese J. Agric. Chem. Food Sci. 41: 263-267.
14. Shu, K. C. 1994. Chinese cheese-sufu. In “Food Industry”. pp. 130-133.
15. Lipp, M., Brodmann, P., Pietsch, K., Pauwels, J. and Anklam, E. 1999. IUPAC collaborative trial study of a method to detect genetically modified soybeans and maize in dried powder. J. AOAC Int. 82: 923-928. 16. Sambrook, J. and Russell, D. W. 2001. Preparation and
analysis of eukaryotic genomic DNA. In “Molecular Cloning: A Laboratory Manual”. p. 6.62. Cold Spring Harbor Laboratory Press, Cold Spring Harbor. New York, U. S. A.
17. Tinker, N. A., Fortin, M. G. and Mather, D. E. 1993. Random amplified polymorphic DNA and pedigree relationships in spring barley. Theor. Appl. Genet. 85: 976-984.
18. Hübber, P. and Brodmann, P. 2001. Validation of PCR methods for quantification of genetically modified plants in food. J. AOAO Int. 84: 1855-1864.
19. Holden, M. J., Blasic, J. R., Bussjaeger, L., Chuan, K., Shokere, L. A., Kendall, D. C., Freese, L. and Jenkins, G. R. 2003. Evaluation of extraction methodologies for corn kernel (Zea mays) DNA for detection of trace amounts of biotechnology-derived DNA. J. Agric Food Chem. 51: 2468-2474.
20. D’Aquila, R. T., Bechtel, L. J., Videler, J. A., Eron, J. J., Gorczyca, P. and Kaplan J. C. 1991. Maximizing sensitivity and specificity of PCR by pre-amplification heating. Nucleic Acids Res. 19: 3749.
21. Chou, Q., Russell, M., Birch, D. E., Raymond, J. and Bloch, W. 1992. Prevention of pre-PCR mis-priming and primer dimerization improves low- copy-number amplifications. Nucleic Acids Res. 20: 1717-1723. 22. Holst-Jensen, A., Rønning, S. B., Løvseth, A. and
Berdal, K. G. 2003. PCR technology for screening and quantification of genetically modified organisms (GMOs). Anal. Bioanal. Chem. 375: 985-993.
23. http://www.nlfd.gov.tw/gmo/90/0920/920.PDF
ACKNOWLEDGMENTS
This study was sponsored by the Department of Health, Executive Yuan, Taiwan, ROC (project no. DOH91-TD-1146).
REFERENCES
1. Lin, H. Y., Chiueh, L. C. and Shih, Y. C. D. 2000. Detection of genetically modified soybeans and maize by the polymerase chain reaction method. J. Food Drug Anal. 8: 200-207.
2. Lin, H. Y., Chiang, J. W. and Shih, Y. C. D. 2001. Detection of genetically modified soybeans by PCR method and immunoassay kits. J. Food Drug Anal. 9: 160-166.
3. Rogan, G. J., Dudin, Y. A., Lee, T. C., Magin, K. M., Astwood, J. D., Bhatka, N. S., Leach, J. N., Sanders, P. R. and Fuchs, R. L. 1999. Immunodiagnostic methods for detection of 5-enolpyruvylshikimate-3-phosphate synthase in Roundup ReadyTMsoybeans. Food Control. 10: 407-414.
4. Lipp, M., Stave, J. W. and Anklam, E. 2000. Validation of an immunoassay for detection and quantitation of a genetically modified soybean in food and food fractions using reference materials: Interlaboratory Study. J. AOAC Int. 83: 919-927.
5. Minunni, M., Tombelli, S., Pratesi, S., Mascini, M., Piatti, P., Mogani, P., Buiatti, M. and Mascini, M. 2001. A piezoelectric affinity biosensors for genetically modified organism (GMOs) detection. Anal. Letters 34: 825-840.
6. Kok, E. J., Aarts, H. J., Van-Hoef, A. M. and Kuiper, H. A. 2002. DNA methods: critical review of innovative approaches. J. AOAC Int. 85: 797-800.
7. Pan, T. M. 2002. Current status and detection of geneti-cally modified organism. J. Food Drug Anal. 10: 229-241.
8. Köppel, E., Stadler, M., Lüthy, J. and Hübber, P. 1997. Sensitive method for the detection of the genetically engineered soybean Roundup ReadyTM. Mitt. Geiete Lebensm. Hyg. 88: 164-175.
9. Meyer, R. and Jaccaud, E. 1997. Detection of genetical-ly modified soya in processed food products: develop-ment and validation of PCR assay for the specific detection of glyphosate-tolerant soybeans. In “Proceeding 9th European Conference on Food Chemistry. Authenticity and Adulteration of Food–The Analytical Approach, Vol 1.” pp. 23-28. Amado, R. and Battaglia, R. eds. Interlaken, Nestle’, Lausanne, Switzerland.