SCRS/2002/121 Col. Vol. Sci. Pap. ICCAT, 55(5): 1892-1915 (2003)
GENERAL LINEAR MIXED MODEL ANALYSIS FOR STANDARDIZATION OF
TAIWANESE LONGLINE CPUE FOR BIGEYE TUNA IN THE ATLANTIC OCEAN
Chien-Chung Hsu1 and Hui-Hua Lee1
SUMMARY
Standardized catch per unit effort of bigeye tuna in the main tropical fishing area o f Atlantic Ocean was developed for the Taiwanese longline fishery by using general linear mixed models with year, quarter (month), stratum and target effect as fixed factors, and the interactions as random effects. Due to the change of Taiwanese longline fleets to the targeting bigeye tuna in the Atlantic in 1994, two time frames were separated, i.e. from 1981 to 1993 for by-catch period and from 1994 to 2000 for the targeting period. Data used were daily logbooks of the Taiwanese longline fishery from 1981 when the logbooks were available. The results showed a stable standardized catch per unit effort series with a slightly increasing trend during 1981-1993, then a significantly and continuously decreasing trend was found from 1994 to 2000.
RÉSUMÉ
La capture par unité d’effort standardisée du thon obèse dans la principale zone de pêche tropicale de l’océan Atlantique a été mise au point pour la pêcherie palangrière taiwanaise en utilisant des modèles mixtes linéaires généralisés avec, comme facteurs fixes, année, trimestre (mois), strate et effet du ciblage, et les interactions comme effets aléatoires. En raison des changements introduits en 1994 par les flottilles palangrières taiwanaises dans l’Atlantique en ce qui concerne le ciblage du thon obèse, deux cadres temporels ont été distingués, c’est-à-dire de 1981 à 1993 pour la période de prises accessoires et de 1994 à 2000 pour la période de ciblage. Les données utilisées étaient les carnets de bord journaliers de la pêcheurs palangriers taiwanais à partir de 1981, lorsque ces derniers étaient disponibles. Les résultats ont montré une série de captures par unité d’effort standardisées stables, avec une tendance légèrement à la hausse entre 1981-1993, et ensuite une tendance décroissante considérable et continue de 1994 à 2000.
RESUMEN
Se ha desarrollado la captura por unidad de esfuerzo estandarizada de patudo en las principales zonas de pesca tropicales del océano Atlántico para la pesquería taiwanesa de palangre utilizando el modelos lineales mixtos genera lizados con factores fijos como año, trimestre (mes), estrato y efecto de direccionamiento, y las interacciones como efectos aleatorios. Dado el cambio que se produjo en las flotas de palangre taiwanesas en 1994 en lo que se refiere al direccionamiento al patudo en el Atlántico, se separaron dos marcos temporales, es decir, de 1981 a 1993 para el período de captura fortuita; y de 1994 a 2000 para el período de especie objetivo. Los datos utilizados fueron los cuadernos de pesca diarios de la pesquería taiwanesa de palangre desde 1981, fecha a partir de la cual se dispuso de los mismos. Los resultados mostraban una serie de capturas por unidad de esfuerzo estandarizadas estables con una ligera tendencia creciente durante 1981-1993; después se detectó una tendencia decreciente continua e importante desde 1994 a 2000.
KEYWORDS
Bigeye tuna (Thunnus obesus), Abundance index, GLMM, Longline, General linear mixed model (GLMM), Mean weight
1
1 INTRODUCTION
Bigeye tuna, Thunnus obesus, is mainly exploited in the tropical region in the Atlantic Ocean. Due to its high economic value, the species has become one of the most concerned species by management organizations for the three Oceans, particularly, for ICCAT in the Atlantic Ocean. For stock assessment and management purpose, only one stock is assumed in the Atlantic. And the stock was exploited by longline gear for adults and surface gears mainly for juveniles and sub-adults.
The history of Taiwanese longline fleets exploited bigeye tuna in the Atlantic Ocean can be divided into two time frames, i.e. bigeye tuna were caught incidentally as by catch before 1991, and targeted afterward. As a result, two fishing types are used to target different tuna species for Taiwanese longline fleets in the Atlantic (Hsu and Liu, 1999; Hsu and Liu, 2001; Yeh et al., 2001), in addition to that catch and effort data compilation has been transferred since 1995 (Hsu and Liu, 1996), and the coverage rate of logbooks was low during 1990-1992. Those may result in more or less data discrepancies (Hsu and Liu, 2001). The former may affect the estimation of abundance index through standardization of catch per unit effort due to not easily separate fishing efforts directed to the target species; and the latter may cause changes of original data compilation, including raising factors, sample sizes, and estimation procedures. Thus, Data being used to abundance index estimation have been verified by Hsu and Liu (2001), and suggested that the 1990-1993 catch and effort data sets of Taiwanese longline fishery for bigeye tuna had better used as by catch series, since those coverage rate was low and the logbooks used to compile the catch and effort were favor to albacore rather than bigeye tuna (evidenced hereinafter).
Therefore, the objectives of this report are to follow the suggestion of ICCAT 2002 work plan to estimate the standardized catch per unit effort by small stratum as suggested.
2 MATERIALS AND METHODS
2.1 Data used and data structure
The catch and effort data for bigeye tuna were compiled from logbooks of Taiwanese longline fishery in the tropical Atlantic Ocean. Those logbooks are submitted by fishermen and are cross-checked and compiled by Oversea Fisheries Development Council, Taipei. Generally, the coverage of logbooks is over 70% (?) from 1993 onward and mandatory the first 30 fish (not all bigeye tuna) was measured on board.
2.2 Data compilation and selection
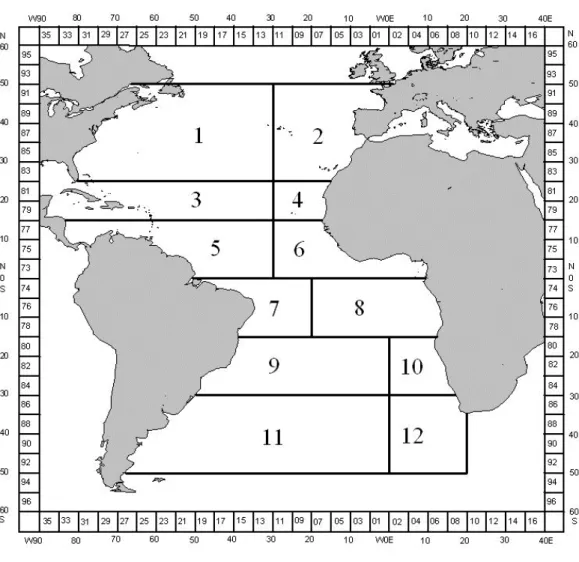
Area defined (Figure 1) used in this study is assigned as in the “Bigeye tuna work plan: year 2002,” the Atlantic Ocean was stratified into 12 strata. Catch/effort and size data used were compiled and provided by Oversea Fisheries Development Council (OFDC).
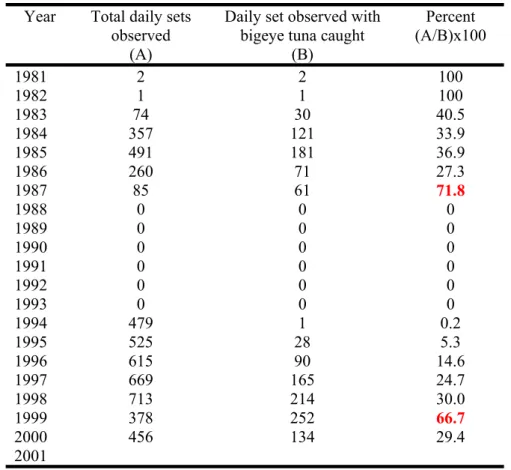
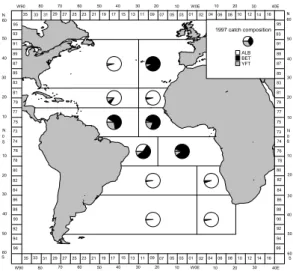
In order to investigate where the bigeye tuna were caught for Taiwanese longline fleets, a pie graph was plotted to show the percentages of albacore, Thunnus alalunga, yellowfin tuna, T. albacares, and bigeye tuna by each year and by strata, the result (Figure 2) indicates that strata 2, 4, 5, 6, 7 and 8 have high percentage of bigeye tuna among the strata; Subsequently, those strata were preliminarily selected to study the abundance index. Further, we investigated the number of observation by each daily sets observed in stratum 2, the result (Table 1) shows that observations of daily set with bigeye tuna caught are very low in almost years, except 1987 (low observed sets) and 1999, thus, we decided to abandon stratum 2 in the present study.
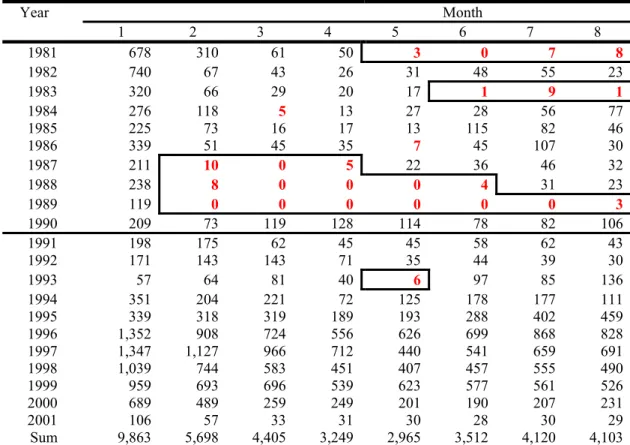
Moreover, data available for the bigeye tuna within each stratum, daily deployed sets were counted by years, by months and by the selected strata (strata 4, 5, 6, 7, and 8), then the result is tabulated in
Table 2.
2.3 Factors considered
Factors considered for general linear model were fishing year, month, sub-area and two-way interactions among year, month and area. Since the number of hooks between floats and capacity of fishing vessels are not significant difference among fishing vessels, factors of the number of hooks between floats and material of main lines and branch lines were not considered in the present study. Thus, categories in each main effect used in general linear models are summarized as:
Main effects Data available
Year 1981-2001 (2001 was used as
preliminary), and two time frames were used in according to the target status, i.e. 1981-1990; 1991-2001.
Month January to December
Sub-area 5 (sub-areas 4, 5, 6, 7, and 8) as defined in Figure 1.
Targets Six levels were assigned: Four quantile levels of catch composition of albacore in total catch of albacore, bigeye tuna and yellowfin tuna, zero catch for three species (na) and catch only for yellowfin tuna (yf).
Although some of hooks between floats were available in the logbooks from 1995 and to partition fishing efforts for different fishing types were possible statistically for missing information of hooks between floats (Yeh et al., 2001), a very high proportions of daily longline sets did not have hooks between floats information, thus the alternative target effect was adopted in the present study to represent fishing types.
2.4 General linear models
A log-normal error assumption was used in the general linear model. Thus, model used to develop the standardized index is:
Month
Year
Area
Month
Species
Area
Month
Year
const
CPUE
n
(
+
)
=
µ
+
+
+
+
+
*
+
*
l
Area Month Year species Area species Month species Year area Year * + * + * + * + * * + ε + ++Year*month*species Month*area*species
where CPUE is nominal catch per unit effort computed by catch div ided by 1000 hooks, and
const
is the constant using 10% of overall nominal catch per unit effort.
The fitting was conducted by GLM procedure of SAS/STAT statistical package (version 8.02). The interactions of Year *Month , Year *Area , Year *species ,
Month*
Area
,Species
Month * , Area *species and Year*Month*Area , Year *Area*species ,
Species Area
Month* * were specified as random variable in mixed procedure as done in the
assessment (ICCAT 1999; Miyabe 2001) and
ε
.the error term for each year, month, area and species is assumed as log-normal distribution.3 RESULTS
3.1 Mean weight
The mean weight was examined by catch in weight divided by catch in number for each monthly 5x5 degree square aggregated catch submitted from all fleets operating in that square, and then those mean weights were illustrated by each stratum (Figure 1) in each year, as in Figure 3. And annual mean weight was illustrated in Figure 4, indicating that a less fluctuation was occurred from 1981 to 1990 for all strata investigated, and a more fluctuated mean weight was found then after. However, the mean weight in strata 5, 6, 7 and 8 ranged from 30 kg to 45 kg (Figure 4).
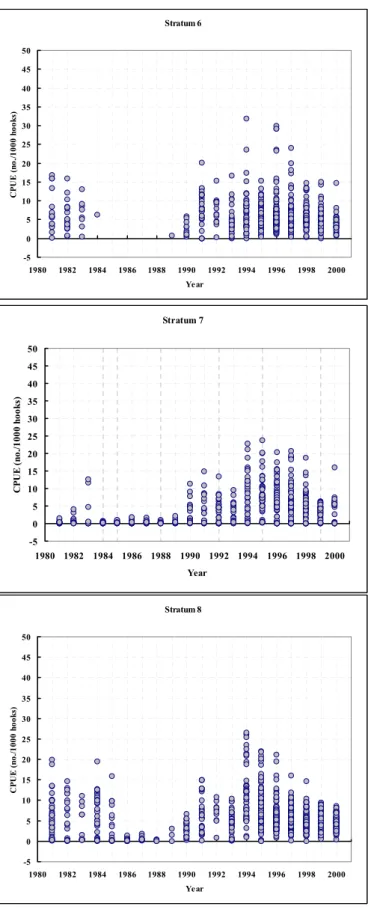
3.2 Annual nominal catch per unit effort distribution in strata
Nominal CPUE (number per 1,000 hooks) by strata 4, 5, 6, 7 and 8 were plotted in Figure 5. Each open circle in the Figure 5 represents a daily and 5x5 block data. Most nominal CPUE points could be found in strata 5, 6, 7 and 8 (tropical regions of Atlantic Ocean) from 1990 to 2000. And Figure 6 showed the mean nominal catch per unit effort for those 4 strata. The nominal catch per unit effort distribution in stratum 4 was also shown in Figure 5; it was although a lack of daily 5x5 square data relatively compared to strata 5, 6, 7 and 8, the average nominal catch per unit effort seems very similar among strata studied (Figure 6). The nominal catch per unit effort shows decreasing trend in all strata, except stratum 7, from 1994 onward when the trend can indicate a target one for Taiwanese longline fishery started to target bigeye tuna in the Atlantic.
3.3 Catch per unit effort standardization
The availability of logbook data used to pursue sta ndardization of catch per unit effort was tabulated in Table 2. It indicated that several months were found without or a few logbooks in years 1981-1983 and 1987-1989, and most months with few logbooks return in years 1990-1993, and all months with many logbooks from 1994 to 2000. Data for 2001 were still very preliminary. To consider this regard, we treated data files into two time frames, 1981-1993 and 1994-2000 for our standardization purpose. Thus, the available data summary was indicated in Table 3. And the statistics to test the hypothesis of models was shown in Table 4. The test results of fixed effects are not significant (P > 0.1).
Thus, an alternative GLM model was used with year, month, sub-area and target species as main fixed factors and only interactions between year and other 3 fixed factors. The time series catch and effort data were used in fitting this model from 1981-2000 without temporal stratification. The test statistics of type III for fixed effects was shown in Table 5, indicating that year is not significant factor (P > 0.2). In this regard, the GLM model was built with year, month and sub-area as fixed factors and year*month and year*sub-area as random effects, the 1981-2000 catch and effort series in strata 5, 6, 7 and 8 were used, the test statistics for fixed effect (Table 6) are all in significance (P < 0.001).
Accordingly, the annual abundance index and area abundance index were estimated.
3.4 Abundance index in each stratum
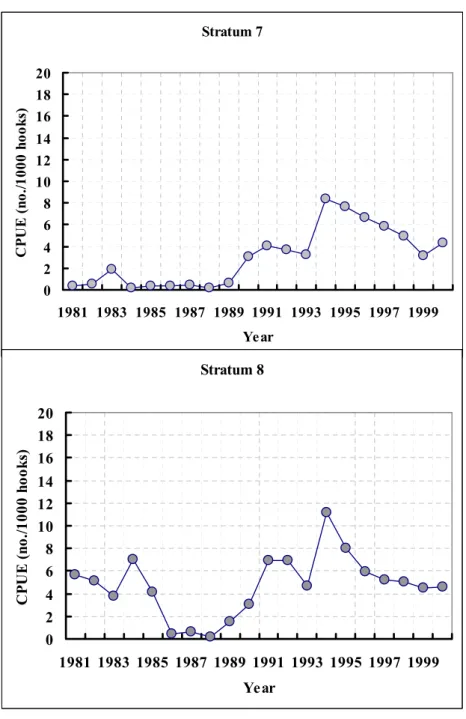
The standardized catch per unit effort for strata 5, 6, 7 and 8 are illustrated in Figure 7. In those figures, missing data are omitted. In stratum 5, the standardized catch per unit effort was low from 1981 to 1986 to show a by catch trend, and a slight decrease from 1989 to 1993 when Taiwanese longline fleets started to target bigyeye tuna during this period, and then, the standardized series decreased more significantly from 1994 to 2000. In stratum 6, the standardized trend was not clear from 1981 to 1984, however, a decreasing trend, but more slightly relative to that in stratum 5, was occurred from 1994 to 1995. In stratum 7, a low and fluctuated catch per unit effort wan shown from
1981 to 1994, but a decreasing trend was shown before from 1994 to 1998, then increasing from 1999 to 2000. In stratum 8, the standardized catch per unit effort showed increasing from 1981 to 1985, then decreased; a dome-shaped trend from 1990 to 1993, then decreased from 1994 to 1996, and kept flat then after to 2000.
3.5 Annual abundance index
Figure 8 depicted the nominal and standardized catch per unit effort for Taiwanese longline
fishery. The standardized trend included catch and effort data from 1981 to 2000. The series shows decreasing trend from 1981 to 1988, and increased to 1995, then decreased apparently from 1996 to 2000.
4 DISCUSSION
To standardize Taiwanese longline catch and effort data as abundance index needs to understand the evolution and fishing types first for all species, particularly for bigeye tuna, yellowfin tuna, albacore and swordfish (Lin , 1999; Yeh et al. 2001). A longline is a species-directed gear and fishers used it to target different species by different depths of water column and by different bait. Bigeye tuna is one of the tuna species caught by longline at relatively deep waters.
As known from many ICCAT works, Taiwanese longline fleets usually used two kinds of longlining to fish different species (Hsu and Lin, 1996). The conventional fishing type has been using to target albacore from the early 1960s, and the deep longline fishing type has been using to mainly target tropical tuna species since around 1990. Therefore, to standardized catch per unit effort of bigeye tuna should include factors representing the depth of hooks deployment. Due to lack of hooks between floats, though the fishery authority collected this information in the logbooks, we haven’t used this category in the present study to avoid too may missing data, however, a target species effect was used to perform this factor in this analysis.
Consequently, Figure 2 depicts catch composition of the three major species of Taiwanese longline fishery in the Atlantic Ocean: albacore, bigeye and yellowfin tunas. Catch composition of bigeye tuna among the three species has shown that there is a very strong trend of bigeye tuna catch in strata 5, 6, 7 and 9. In this manner, we pay much attention on standardizing catch per unit effort for these strata and excluded stratum 4 as suggested on the 2002 bigeye tuna work plan. These also implied the necessities to take into account the target species effect in the CPUE standardization (Chang and Hsu, 2002). We have taken into account the target species effect during the original run and the alternative run 1, however, those runs result in insignificance of the model test for one of the fixed factors, year. Then, for the alternative run 2, we omitted the target species effect and only Year*month and Year*stratum random effect were used, the test for fixed effects is significant (P < 0.001). This may imply that the original daily set data from logbooks may have reflected the target species enough. Hence, if the area stratification was used, the re-categorize fishing effort from either the conventional or deep longline fishing type seems not necessary at this moment.
REFERENCES
CHANG, S. K. and C. C. Hsu. 2002. Development of standardized catch rate of south Atlantic swordfish for Taiwanese longline fleets. Coll. Vol. Sci. Pap., ICCAT
HSU, C. C. and M. C. Lin. 1996. The recent catch estimation procedure of Taiwanese longline fishery. Coll. Vol. Sci. pap., ICCAT 43:171-178.
HSU, C. C. and H. C. Liu. 2000. The updated catch per unit effort of bigeye tuna for Taiwanese longline fishery in the Atlantic. Coll. Vol. Sci. Pap., ICCAT 51:635-650.
HSU, C. C. and H. C. Liu. 2001. Verification of bigeye tuna length and catch data consistency for Taiwanese longline fishery in the Atlantic. Coll. Vol. Sci. Pap. ICCAT 54(1):172-190.
ICCAT. 1999. Report of ICCAT SCRS bluefin tuna stock assessment session (Genoa, Italy – September 14-23, 1998). Bluefin tuna – detailed report. Coll. Vol. Sci. Pap. ICCAT 46(2):1-191.
MIYABE, N. 2001. Standardized bluefin CPUE from the Japanese longline fishery in the Atlantic and Mediterranean Sea up tot 1999. Coll. Vol. Sci. Pap. ICCAT 52:1130-1144.
YEH, Y. M., C. C. Hsu, H. H. Lee and H. C. Liu. 2001. A new method for categorizing Taiwanese longline catch and effort data to improve abundance index standardization. (manuscript)
Table 1. The number of observed daily set with bigeye tuna caught at stratum 2 (see Figure 1) for Taiwanese
longline fleets to show the data availability
Year Total daily sets observed
(A)
Daily set observed with bigeye tuna caught
(B) Percent (A/B)x100 1981 2 2 100 1982 1 1 100 1983 74 30 40.5 1984 357 121 33.9 1985 491 181 36.9 1986 260 71 27.3 1987 85 61 71.8 1988 0 0 0 1989 0 0 0 1990 0 0 0 1991 0 0 0 1992 0 0 0 1993 0 0 0 1994 479 1 0.2 1995 525 28 5.3 1996 615 90 14.6 1997 669 165 24.7 1998 713 214 30.0 1999 378 252 66.7 2000 456 134 29.4 2001
Table 2. The number of observed daily set deployed at the selected strata 4, 5, 6, 7 and 8 (see Figure 1) for
Taiwanese longline fleets to show the data availability.
Year Month 1 2 3 4 5 6 7 8 1981 678 310 61 50 3 0 7 8 1982 740 67 43 26 31 48 55 23 1983 320 66 29 20 17 1 9 1 1984 276 118 5 13 27 28 56 77 1985 225 73 16 17 13 115 82 46 1986 339 51 45 35 7 45 107 30 1987 211 10 0 5 22 36 46 32 1988 238 8 0 0 0 4 31 23 1989 119 0 0 0 0 0 0 3 1990 209 73 119 128 114 78 82 106 1991 198 175 62 45 45 58 62 43 1992 171 143 143 71 35 44 39 30 1993 57 64 81 40 6 97 85 136 1994 351 204 221 72 125 178 177 111 1995 339 318 319 189 193 288 402 459 1996 1,352 908 724 556 626 699 868 828 1997 1,347 1,127 966 712 440 541 659 691 1998 1,039 744 583 451 407 457 555 490 1999 959 693 696 539 623 577 561 526 2000 689 489 259 249 201 190 207 231 2001 106 57 33 31 30 28 30 29 Sum 9,863 5,698 4,405 3,249 2,965 3,512 4,120 4,103 Table 2. (Continued) Strata 9 10 11 12 4 5 6 7 8 42 435 1,073 1,151 12 11 121 2,803 871 55 420 770 661 15 61 151 2,054 658 14 23 281 316 78 39 14 738 228 16 119 483 426 14 81 15 1,097 437 35 318 575 451 2 307 0 1,350 307 5 154 369 262 105 187 0 1,038 119 7 95 259 232 3 145 0 649 158 2 5 150 166 0 60 0 456 11 41 0 135 230 0 72 4 436 16 67 96 142 246 0 779 67 486 128 61 74 169 200 125 431 119 352 165 34 48 53 29 0 463 63 268 46 123 97 240 338 7 439 251 275 392 165 210 266 301 20 936 444 557 424 577 851 1,005 1,334 82 957 1,143 1,669 2,423 1,044 1,019 1,197 1,307 225 2,042 3,232 2,526 3,103 610 676 732 768 130 1,664 1,938 1,796 3,741 545 658 700 935 9 764 1,631 1,271 3,889 417 462 459 719 43 4,52 1,983 646 4,107 56 29 75 65 8 304 329 477 1,622 7 0 0 0 0 0 7 67 277 3,882 5,830 9,133 1.0137 878 10,194 11,512 21,011 23,122
Table 3. Summary of data availability and used for catch per unit effort standardization in the present study.
Results in the text run for stratum 4 were limited to its monthly 5x5 data available. (a) Data set I
Class Levels Values
Years 13 1981, 1982, 1983, 1984, 1985, 1986, 1987, 1988, 1989, 1990, 1991, 1992, 1993
Quarters 4 1, 2, 3, 4 Strata 4 5, 6, 7, 8
Targets 6 1, 2, 3, 4, no catch and yellowfin tuna catch only
(b) Data set II
Class Levels Values
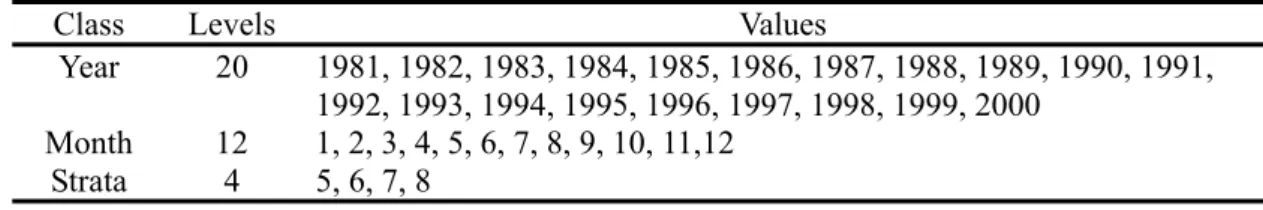
Years 7 1994, 1995, 1996, 1997, 1998, 1999, 2000 Month 4 1, 2, 3, 4, 5, 6, 7, 8, 9, 10, 11, 12
Strata 4 1, 2, 3, 4
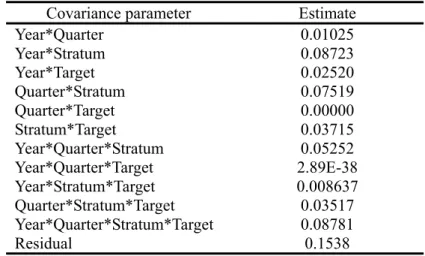
Targets 6 1, 2, 3, 4, no catch and yellowfin tuna catch only Table 4. Statistics of the general linear mixed model results on the two data sets run.
Covariance parameter estimates (a) Data set I – from 1981 to 1993
Covariance parameter Estimate
Year*Quarter 0.01025 Year*Stratum 0.08723 Year*Target 0.02520 Quarter*Stratum 0.07519 Quarter*Target 0.00000 Stratum*Target 0.03715 Year*Quarter*Stratum 0.05252 Year*Quarter*Target 2.89E-38 Year*Stratum*Target 0.008637 Quarter*Stratum*Target 0.03517 Year*Quarter*Stratum*Target 0.08781 Residual 0.1538
Type 1 Tests of Fixed Effects
Effect Num DF Den DF F Value Pr > F Year 12 30 7.21 < 0.0001 Quarter 3 9 4.50 0.0344 Strata 3 9 10.88 0.0024 Targets 5 15 78.15 < 0.0001
Type 3 Tests of Fixed Effects
Effect Num DF Den DF F Value Pr > F Year 12 30 0.73 0.7137 Quarter 3 9 0.13 0.9379 Strata 3 9 1.46 0.2890 Targets 5 15 78.15 < 0.0001
(b) Data set II – from 1994 to 2000
Covariance parameter Estimate
Year*Quarter 0.002007 Year*Stratum 0.01090 Year*Target 0.004983 Quarter*Stratum 0.007517 Quarter*Target 0.002560 Stratum*Target 0.008203 Year*Quarter*Stratum 0.02099 Year*Quarter*Target 0.000493 Year*Stratum*Target 0.004460 Quarter*Stratum*Target 0.001382 Year*Quarter*Stratum*Target 0.03838 Residual 0.2763
Type 1 Tests of Fixed Effects
Effect Num DF Den DF F Value Pr > F Year 6 18 7.93 0.0003 Month 11 33 4.24 0.0006 Strata 3 15 22.81 < 0.0001 Targets 5 15 255.03 < 0.0001
Type 3 Tests of Fixed Effects
Effect Num DF Den DF F Value Pr > F Year 6 18 7.34 0.0004 Month 11 33 1.94 0.0692 Strata 3 15 0.25 0.8610 Targets 5 15 255.03 < 0.0001
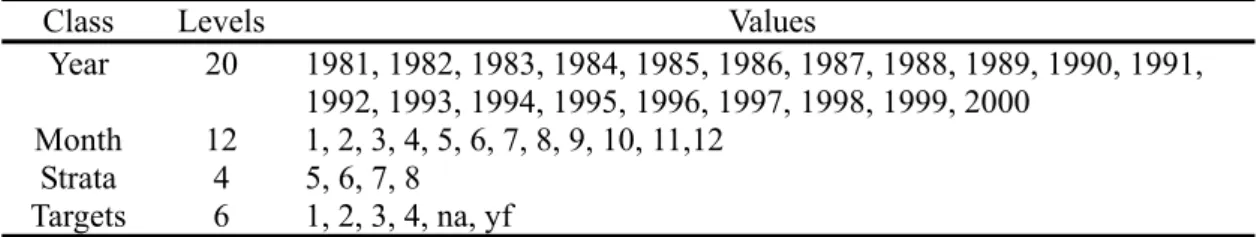
Table 5. Statistics of test fixed effects on the alternative general linear mixed model for the alternative run 1.
Class Level Information
Class Levels Values
Year 20 1981, 1982, 1983, 1984, 1985, 1986, 1987, 1988, 1989, 1990, 1991, 1992, 1993, 1994, 1995, 1996, 1997, 1998, 1999, 2000
Month 12 1, 2, 3, 4, 5, 6, 7, 8, 9, 10, 11,12 Strata 4 5, 6, 7, 8
Targets 6 1, 2, 3, 4, na, yf
Covariance Parameter Estimates
Covariance parameters Estimate
Year*month 0.07196 Year*strata 0.14290 Year*targets 0.07745 Residual 0.28080
Type 1 Tests of Fixed Effects
Effect Num DF Den DF F Value Pr > F Year 19 50 8.54 < 0.0001 Month 11 192 8.83 < 0.0001 Strata 3 50 17.38 < 0.0001 Targets 5 90 165.62 < 0.0001
Type 3 Tests of Fixed Effects
Effect Num DF Den DF F Value Pr > F Year 19 50 1.27 0.2444 Month 11 192 2.91 0.0014 Strata 3 50 4.47 0.0074 Targets 5 90 165.62 < 0.0001
Table 6. Statistics of test fixed effects on the alternative general linear mixed model for the alternative run 2.
Class Level Information
Class Levels Values
Year 20 1981, 1982, 1983, 1984, 1985, 1986, 1987, 1988, 1989, 1990, 1991, 1992, 1993, 1994, 1995, 1996, 1997, 1998, 1999, 2000
Month 12 1, 2, 3, 4, 5, 6, 7, 8, 9, 10, 11,12 Strata 4 5, 6, 7, 8
Covariance Parameter Estimates
Covariance parameters Estimate
Year*month 0.1601 Year*strata 0.3469 Residual 0.6607
Type 1 Tests of Fixed Effects
Effect Num DF Den DF F Value Pr > F Year 19 50 4.98 < 0.0001 Month 11 192 5.65 < 0.0001 Strata 3 50 10.66 < 0.0001
Type 3 Tests of Fixed Effects
Effect Num DF Den DF F Value Pr > F Year 19 50 3.40 0.2444 Month 11 192 4.54 0.0014 Strata 3 50 10.66 0.0074
20 40 30 10 0 N S 10 82 20 30 40 50 60 S 86 84 77 75 73 74 76 78 80 79 87 95 93 91 89 85 83 81 N 80 35 33 W90 60 50 27 29 88 90 92 94 96 353331 W90 80 70 60 312927 70 60 17 19 252321 50 40 2523211917 151311 50 40 151311 30 20 10 81 83 85 87 89 91 93 95 30 20 10 W0E 10 20 30 40E 30 W0E 10 20 40E 79 77 84 82 80 78 76 74 73 08 09 07 05 0301 0204 06 08 02 09 0705 0301 0406 101214 16 60 N 60 1012 1416 96 94 S 50 86 88 92 40 50 75 0 N S 10 20 30 90 40 30 20 10 1981-1990 catch composition ALB BET YFT 20 40 30 10 0 N S 10 82 20 30 40 50 60 S 86 84 77 75 73 74 76 78 80 79 87 95 93 91 89 85 83 81 N 80 35 33 W90 60 50 27 29 88 90 92 94 96 353331 W90 80 70 60 312927 70 60 17 19 2523 21 50 40 2523211917 151311 50 40 151311 30 20 10 81 83 85 87 89 91 93 95 30 20 10 W0E 10 20 30 40E 30 W0E 10 20 40E 79 77 84 82 80 78 76 74 73 08 0907 050301020406 08 02 0907 050301 0406 10 1214 16 60 N 60 10121416 96 94 S 50 86 88 92 40 50 75 0 N S 10 20 30 90 40 30 20 10 1991 catch composition ALB BET YFT 20 40 30 10 0 N S 10 82 20 30 40 50 60 S 86 84 77 75 73 74 76 78 80 79 87 95 93 91 89 85 83 81 N 80 35 33 W90 60 50 27 29 88 90 92 94 96 353331 W90 80 70 60 312927 70 60 17 19 252321 50 40 2523211917151311 50 40 151311 30 20 10 81 83 85 87 89 91 93 95 30 20 10 W0E 10 20 30 40E 30 W0E 10 20 40E 79 77 84 82 80 78 76 74 73 08 0907 050301020406 08 02 0907 050301 0406 10121416 60 N 60 10121416 96 94 S 50 86 88 92 40 50 75 0 N S 10 20 30 9040 30 20 10 1992 catch composition ALB BET YFT 20 40 30 10 0 N S 10 82 20 30 40 50 60 S 86 84 77 75 73 74 76 78 80 79 87 95 93 91 89 85 83 81 N 80 35 33 W90 60 50 27 29 88 90 92 94 96 353331 W90 80 70 60 312927 70 60 17 19 252321 50 40 25232119 17151311 50 40 151311 30 20 10 81 83 85 87 89 91 93 95 30 20 10 W0E 10 20 30 40E 30 W0E 10 20 40E 79 77 84 82 80 78 76 74 73 08 0907 050301020406 08 02 0907050301 04 06 1012 1416 60 N 60 10121416 96 94 S 50 86 88 92 40 50 75 0 N S 10 20 30 90 40 30 20 10 1993 catch composition ALB BET YFT 20 40 30 10 0 N S 10 82 20 30 40 50 60 S 86 84 77 75 73 74 76 78 80 79 87 95 93 91 89 85 83 81 N 80 35 33 W90 60 50 27 29 88 90 92 94 96 353331 W90 80 70 60 312927 70 60 17 19 2523 21 50 40 2523211917 1513 11 50 40 151311 30 20 10 81 83 85 87 89 91 93 95 30 20 10 W0E 10 20 30 40E 30 W0E 10 20 40E 79 77 84 82 80 78 76 74 73 08 0907050301020406 08 02 0907050301 0406 10121416 60 N 60 10121416 96 94 S 50 86 88 92 40 50 75 0 N S 10 20 30 90 40 30 20 10 1994 catch composition ALB BET YFT 20 40 30 10 0 N S 10 82 20 30 40 50 60 S 86 84 77 75 73 74 76 78 80 79 87 95 93 91 89 85 83 81 N 80 3533 W90 60 50 27 29 88 90 92 94 96 353331 W90 80 70 60 312927 70 60 17 19 252321 50 40 2523211917 1513 11 50 40 151311 30 20 10 81 83 85 87 89 91 93 95 30 20 10 W0E 10 20 30 40E 30 W0E 10 20 40E 79 77 84 82 80 78 76 74 73 08 0907050301020406 08 02 0907050301 0406 10121416 60 N 60 10121416 96 94 S 50 86 88 92 40 50 75 0 N S 10 20 30 90 40 30 20 10 1995 catch composition ALB BET YFT
20 40 30 10 0 N S 10 82 20 30 40 50 60 S 86 84 77 75 73 74 76 78 80 79 87 95 93 91 89 85 83 81 N 80 35 33 W90 60 50 27 29 88 90 92 94 96 353331 W90 80 70 60 312927 70 60 17 19 252321 50 40 2523211917 151311 50 40 151311 30 20 10 81 83 85 87 89 91 93 95 30 20 10 W0E 10 20 30 40E 30 W0E 10 20 40E 79 77 84 82 80 78 76 74 73 08 0907050301020406 08 02 0907050301 0406 10121416 60 N 60 10121416 96 94 S 50 86 88 92 40 50 75 0 N S 10 20 30 9040 30 20 10 1996 catch composition ALB BET YFT 20 40 30 10 0 N S 10 82 20 30 40 50 60 S 86 84 77 75 73 74 76 78 80 79 87 95 93 91 89 85 83 81 N 80 35 33 W90 60 50 27 29 88 90 92 94 96 353331 W90 80 70 60 312927 70 60 17 19 252321 50 40 2523211917151311 50 40 151311 30 20 10 81 83 85 87 89 91 93 95 30 20 10 W0E 10 20 30 40E 30 W0E 10 20 40E 79 77 84 82 80 78 76 74 73 08 0907 050301020406 08 02 0907050301 0406 10121416 60 N 60 10121416 96 94 S 50 86 88 92 40 50 75 0 N S 10 20 30 90 40 30 20 10 1997 catch composition ALB BET YFT 20 40 30 10 0 N S 10 82 20 30 40 50 60 S 86 84 77 75 73 74 76 78 80 79 87 95 93 91 89 85 83 81 N 80 35 33 W90 60 50 27 29 88 90 92 94 96 353331 W90 80 70 60 312927 70 60 17 19 252321 50 40 2523211917 151311 50 40 1513 11 30 20 10 81 83 85 87 89 91 93 95 30 20 10 W0E 10 20 30 40E 30 W0E 10 20 40E 79 77 84 82 80 78 76 74 73 08 09 0705030102 0406 08 02 0907050301 04 06 10121416 60 N 60 10121416 96 94 S 50 86 88 92 40 50 75 0 N S 10 20 30 9040 30 20 10 1998 catch composition ALB BET YFT 20 40 30 10 0 N S 10 82 20 30 40 50 60 S 86 84 77 75 73 74 76 78 80 79 87 95 93 91 89 85 83 81 N 80 3533 W90 60 50 27 29 88 90 92 94 96 353331 W90 80 70 60 312927 70 60 17 19 252321 50 40 2523211917151311 50 40 151311 30 20 10 81 83 85 87 89 91 93 95 30 20 10 W0E 10 20 30 40E 30 W0E 10 20 40E 79 77 84 82 80 78 76 74 73 08 0907050301020406 08 02 0907050301 0406 10121416 60 N 60 10121416 96 94 S 50 86 88 92 40 50 75 0 N S 10 20 30 9040 30 20 10 1999 catch composition ALB BET YFT 20 40 30 10 0 N S 10 82 20 30 40 50 60 S 86 84 77 75 73 74 76 78 80 79 87 95 93 91 89 85 83 81 N 80 35 33 W90 60 50 27 29 88 90 92 94 96 353331 W90 80 70 60 312927 70 60 17 19 252321 50 40 2523211917 151311 50 40 151311 30 20 10 81 83 85 87 89 91 93 95 30 20 10 W0E 10 20 30 40E 30 W0E 10 20 40E 79 77 84 82 80 78 76 74 73 08 0907 05 03 0102 0406 08 02 090705 03 01 0406 10121416 60 N 60 10121416 96 94 S 50 86 88 92 40 50 75 0 N S 10 20 30 9040 30 20 10 2000 catch composition ALB BET YFT 20 40 30 10 0 N S 10 82 20 30 40 50 60 S 86 84 77 75 73 74 76 78 80 79 87 95 93 91 89 85 83 81 N 80 35 33 W90 60 50 27 29 88 90 92 94 96 353331 W90 80 70 60 312927 70 60 17 19 252321 50 40 2523211917 1513 11 50 40 151311 30 20 10 81 83 85 87 89 91 93 95 30 20 10 W0E 10 20 30 40E 30 W0E 10 20 40E 79 77 84 82 80 78 76 74 73 08 0907050301020406 08 02 0907050301 0406 10121416 60 N 60 10121416 96 94 S 50 86 88 92 40 50 75 0 N S 10 20 30 90 40 30 20 10 2001 catch composition ALB BET YFT
Stratum 4 0 5 10 15 20 25 30 35 40 45 50 55 60 65 70 75 80 85 1980 1982 1984 1986 1988 1990 1992 1994 1996 1998 2000 Year M ean w ei ght ( K g) Stratum 5 0 5 10 15 20 25 30 35 40 45 50 55 60 65 70 75 80 85 1980 1982 1984 1986 1988 1990 1992 1994 1996 1998 2000 Year M ean w ei gh t (K g)
Stratum 6 0 5 10 15 20 25 30 35 40 45 50 55 60 65 70 75 80 85 1980 1982 1984 1986 1988 1990 1992 1994 1996 1998 2000 Year Mean w ei gh t (K g) Stratum 7 0 5 10 15 20 25 30 35 40 45 50 55 60 65 70 75 80 85 1980 1982 1984 1986 1988 1990 1992 1994 1996 1998 2000 Year Me an w ei gh t ( K g)
Stratum 8 0 5 10 15 20 25 30 35 40 45 50 55 60 65 70 75 80 85 1980 1982 1984 1986 1988 1990 1992 1994 1996 1998 2000 Year Me an w ei gh t (K g)
Figure 3. Mean weight of bigeye tuna for each stratum (Figure 1) in each year to indicate the
variation of sizes caught by Taiwanese longline fleets in the Atlantic.
Mean weight 0 5 10 15 20 25 30 35 40 45 50 55 60 1979 1981 1983 1985 1987 1989 1991 1993 1995 1997 1999 2001 Year We ig ht (K g) Stratum 4 Stratum 5 Stratum 6 Stratum 7 Stratum 8
Figure 4. Annual mean weight of bigeye tuna caught by Taiwanese longline fleets by strata in the
Stratum 4 -5 0 5 10 15 20 25 30 35 40 45 50 1980 1982 1984 1986 1988 1990 1992 1994 1996 1998 2000 Year C P U E ( n o./ 1000 h ook s) Stratum 5 -5 0 5 10 15 20 25 30 35 40 45 50 1980 1982 1984 1986 1988 1990 1992 1994 1996 1998 2000 Year C P U E ( n o./ 1000 h ook s)
Stratum 6 -5 0 5 10 15 20 25 30 35 40 45 50 1980 1982 1984 1986 1988 1990 1992 1994 1996 1998 2000 Year C P U E ( no. /1 00 0 ho ok s) Stratum 7 -5 0 5 10 15 20 25 30 35 40 45 50 1980 1982 1984 1986 1988 1990 1992 1994 1996 1998 2000 Year C P U E ( no ./1 000 h ook s) Stratum 8 -5 0 5 10 15 20 25 30 35 40 45 50 1980 1982 1984 1986 1988 1990 1992 1994 1996 1998 2000 Year C P U E ( no. /1 000 h ook s)
Figure 5. Standardized catch per unit effort of bigeye tuna by each stratum for Taiwanese longline
Stratum 4 0 2 4 6 8 10 12 14 16 18 20 1981 1983 1985 1987 1989 1991 1993 1995 1997 1999 Year C P U E (n o. /1000 h ook s) Stratum 5 0 2 4 6 8 10 12 14 16 18 20 1981 1983 1985 1987 1989 1991 1993 1995 1997 1999 Year C P U E ( no. /1000 h ook s) Stratum 6 0 2 4 6 8 10 12 14 16 18 20 1981 1983 1985 1987 1989 1991 1993 1995 1997 1999 Year C P U E ( n o. /1000 h ook s)
Stratum 7 0 2 4 6 8 10 12 14 16 18 20 1981 1983 1985 1987 1989 1991 1993 1995 1997 1999 Year C P U E ( no. /1000 hook s) Stratum 8 0 2 4 6 8 10 12 14 16 18 20 1981 1983 1985 1987 1989 1991 1993 1995 1997 1999 Year C P U E ( no ./100 0 hook s)
Figure 6. Annual nominal catch per unit effort of bigeye tuna caught by Taiwanese longline fleets
Stratum 6 0.0 1.0 2.0 3.0 4.0 5.0 1981 1983 1985 1987 1989 1991 1993 1995 1997 1999 Year C P U E ( n o. /1000 h ook s) Stratum 5 0.0 1.0 2.0 3.0 4.0 5.0 1981 1983 1985 1987 1989 1991 1993 1995 1997 1999 Year C P U E ( no./ 1000 hook s) Stratum 7 0.0 1.0 2.0 3.0 4.0 5.0 1981 1983 1985 1987 1989 1991 1993 1995 1997 1999 Year C P U E ( n o. /1000 h ook s)
Stratum 8 0.0 1.0 2.0 3.0 4.0 5.0 1981 1983 1985 1987 1990 1992 1994 1996 1998 2000 Year CPUE (n o ./ 1000 hooks)
Figure 7. Annual standardized catch per unit effort of bigeye tuna caught by Taiwanese longline
fleets in strata 5, 6, 7 and 8 from 1981 to 2000.
Figure 8. Annual standardized catch per unit effort of bigeye tuna caught by Taiwanese
longline fleets in the strata 5, 6, 7 and 8 of the Atlantic.
0 1 2 3 4 5 6 7 8 9 10 1981 1983 1985 1987 1989 1991 1993 1995 1997 1999 Year C P U E ( n o. /1 000 h ooks )