利用合作訓練與集成學習法檢測藥物不良反應事件通報系統中之重複記錄
59
0
0
全文
(2) 口試委員審定書. i.
(3) 致謝. 非常感謝我的指導教授林文揚,在研究所這段期間,指導我很多研究方面的問題, 提供詳實的意見、以及討論研究上所遇到的困難。教授在每次的討論中,都會提出更 正確更客觀的研究方向,指出研究中的盲點,讓我學習到應該如何才能完成一份嚴謹 的學術研究,完成這一次的論文。更感謝在撰寫論文期間,教授非常用心的修改論文, 讓教授花了很多心力跟時間在我的論文,使這篇論文能更語句順暢、文義清晰及淺顯 易懂。 另外還要感謝實驗室的同伴馮文榆,我們一起討論很多關於論文、實驗、程式、 投影片製作等…相關細節,一起度過許多研究所的生活。還有感謝實驗室的學長杜治 緯,解決的很多在系統、程式、電腦等…所遇到的問題,也提供研究上該注意的方向。 還有一些在我有困難時提供意見幫助我的人。感謝幫助過我的人,讓我得以順利完成 這份論文。. ii.
(4) 利用合作訓練與集成學習法 檢測藥物不良反應事件通報系統中之重複記錄. 指導教授:林文揚 博士(教授) 國立高雄大學資訊工程學系(研究所) 學生:羅喬楓 國立高雄大學資訊工程學系(研究所) 摘要 藥物不良反應檢測在對於大眾健康以及製藥的發展,是個非常重要的議題。由於 藥物被批准上市場前的臨床樣本數不足以確定潛在的藥物不良反應,許多國家都建立 各種自發性通報系統(SRSs),以便監控上市後的藥品並收集數據用於檢測未知的藥 物不良反應。由於自發性通報系統的數據來自於不同的呈報來源,就導致重複通報的 問題。不幸的是,就算只有少量的重複報告,也會造成藥物不良反應檢測的偏差。雖 然已有很多重複值檢測的文獻,但是很少有針對藥物不良反應的資料集做重複值檢 測,而且這些研究皆未考慮資料中存在的後續追蹤報告。因此目前藥物不良反應報告 中重複值偵測的方法皆無法區分一份報告是屬於重複的紀錄或是後續追蹤的連結。 在本研究中,我們探討在藥物不良反應報告中存在後續追蹤紀錄的情形下,如何 進行重複記錄偵測的問題,並提出一種基於合作訓練與集成學習的檢測方法。此種方 法能檢測出一份報告是否為重複的報告或是初始報告的後續追蹤紀錄。. 關鍵字:藥物不良反應事件、重複紀錄檢測、集成學習法、合作訓練學習法、藥物事 件通報系統、後續追蹤、自發性通報系統. iii.
(5) Co-Training and Ensemble Learning for Duplicate Detection in Adverse Drug Event Reporting Systems. Advisor(s): Dr. (Professor) Wen-Yang Lin Institute of Computer Science and Information Engineering National University of Kaohsiung Student: Chiao-Feng Lo Institute of Computer Science and Information Engineering National University of Kaohsiung ABSTRACT. Adverse drug reactions detection is a very important topic in the public health as well as the development of modern pharmaceutical industry. Since the number of samples in clinical trials is not enough to identify potential adverse drug reactions before the drugs are approved for marketing, many countries have established various spontaneous reporting systems (SRSs) to facilitate postmarketing surveillance of listed drugs and collect enough data for detecting unknown adverse drug reactions. Unfortunately, due to data in SRSs coming from different sources of reporters, there heralds the problem of duplicate reporting; even a small amount of duplicate records would bias the detection results. Although lots of works have been conducted on duplicate record detection, very few of them have been devoted to dataset about adverse drug reactions, and none of them have considered the existence of follow-up reports. Thus contemporary methods tailored to detecting duplicate ADR report are inept to discriminate real duplicate from follow-up linkage. In this study, we investigated the problem of identifying duplicate ADR reports in SRSs with the presence of follow-ups. We propose an ensemble and co-training based. iv.
(6) detection method that is capable of detecting for a given report not only its duplicates but also its initial or earlier linkage cases. Keywords: Adverse drug events, duplicate records detection, ensemble learning, co-training learning, drug event reporting system, follow-up, spontaneous reporting systems. v.
(7) Contents 口試委員審定書 .................................................................................................... i 致謝 ....................................................................................................................... ii 摘要 ...................................................................................................................... iii ABSTRACT ........................................................................................................ iv List of Figures ................................................................................................... viii List of Tables ...................................................................................................... ix Chapter 1 Introduction ........................................................................................1 1.1 Motivation ..................................................................................................................... 1 1.2 Contributions................................................................................................................. 3 1.3 Thesis Organization ...................................................................................................... 3. Chapter 2 Background ........................................................................................5 2.1 Drug Development Process and Reporting Systems .................................................... 5 2.2 Measures for ADR Detection ........................................................................................ 8. Chapter 3 Related Work.................................................................................... 11 3.1 Duplicate Detection .................................................................................................... 11 3.2 Classification............................................................................................................... 13 3.2.1 Ensemble learning ............................................................................................................. 14 3.2.2 Co-training learning .......................................................................................................... 17. Chapter 4 Duplicate Detection in FAERS Dataset..........................................18 4.1 Characteristics of FAERS Dataset .............................................................................. 18 4.2 Duplicate Reporting Problem in FAERS Dataset ....................................................... 20. Chapter 5 Proposed Duplicate Detection Method ..........................................24. vi.
(8) 5.1 Data Preparation.......................................................................................................... 24 5.2 Training Set Construction ........................................................................................... 28 5.3 Ensemble and Co-training based Method ................................................................... 30. Chapter 6 Experiment .......................................................................................34 6.1 Correctness Analysis of Duplicate Detection ............................................................. 34 6.2 Impact of Duplicate Elimination on ADR Detection .................................................. 40. Chapter 7 Conclusions and Future Work ........................................................42 7.1 Conclusions ................................................................................................................. 42 7.2 Future Work ................................................................................................................ 42. References ...........................................................................................................44. vii.
(9) List of Figures Figure 2.1 The schema of FAERS database.......................................................7 Figure 3.1 A general process for building a classification model...................14 Figure 3.2 The basic paradigm of ensemble learning. ....................................15 Figure 3.3 (a) The concept of homogeneous ensemble and (b) the concept of heterogeneous ensemble ................................................................................16 Figure 5.1 An illustration of the record pair transformation. .......................26 Figure 5.2 A sample of transformed data. .......................................................27 Figure 5.3 A conceptual depiction of proposed ensemble and co-training based detection algorithm. ................................................................................31. viii.
(10) List of Tables Table 2.1 Listed drug development process .......................................................6 Table 2.2 The 2×2 contingency table for ADR measurement...........................9 Table 2.3 A summary of contemporary ADR measures .................................10 Table 4.1 Detail description of table DEMO ...................................................19 Table 4.2 FAERS data sample ...........................................................................22 Table 5.1 Detail description for attribute selection ........................................25 Table 5.2 An example similarity calculation ...................................................28 Table 5.3 An example of training set construction. ........................................29 Table 6.1 07Q2 class Confusion Matrix by Bayesian Network ......................35 Table 6.2 The results performed on dataset 07Q2 with 10 ross-verifications. ..............................................................................................................................36 Table 6.3 Comparison of classification accuracy on the seven datasets .......37 Table 6.4 Evaluation results for class II ...........................................................38 Table 6.5 F-measures of class II. .......................................................................38 Table 6.6 Evaluation results for class IF&FF. .................................................39 Table 6.7 F-measures for class IF&FF. ............................................................39 Table 6.8 Detection of ADR signals without removing duplicate. .................41 Table 6.9 Detection of ADR signals with removing duplicate. .......................41. ix.
(11) Chapter 1 Introduction 1.1 Motivation With the rapid development of modern pharmaceutical industry, more and more new drugs are discovered and come onto the market for treatment of related diseases. All of new drugs before approved for marketing have to undergo a series of clinical trials to uncover all possible adverse drug reactions (ADRs), which refer to harmful reactions associated with the normal usage of a given medicine. Unfortunately, due to very limit number of patients, compared to the masses, can participate in clinical trials, it is impossible to discover all potential adverse drug reactions. Therefore, many countries or world organizations have established various spontaneous reporting systems (SRSs) for adverse drug events (ADEs), e.g., European Medicines Agency (EMA) [12], Food and Drug Administration (FDA) [14], Health Canada (HC) [18], and Medicines and Healthcare Products Regulatory Agency (MHRA) [32]. These systems allow doctors, pharmacists, and other health care practitioners to report adverse drug events, acting as a repository researches or drug-related agencies to analyze and to identify potential adverse reactions. Usually, the number of cases reported to these reporting systems one increasing significantly every year. For example, the FDA Adverse Event Reporting System (FAERS) system run by FDA [14] collects more than one hundred thousand records each quarter. So, how to detect suspect adverse drug reactions as early as possible from SRSs has been an important research topic to the pharmaceutical industry.. 1.
(12) Although different SRSs follow different reporting regulations for cases reporting, most of them asset voluntary activity from different source reporters (e.g., health care practitioners, patients), which arises the problem of duplicate reporting. Several cases reported by different senders, through different router, may refer to the same adverse event. For example, in an ADR evaluation of quinine-induced thrombocytopenia conducted by Brinker and Beitz in 2002 [1], 20% of 141 reports in the FAERS database center identified as duplicates. A more recent study by Hauben et al. [18] showed the existence of extreme duplication in the FAERS database; 20 reports about aortic dissection associated with a drug of interest referred to the same cases. The presence of duplicate records may bias the results of ADR signal detection, either causing false signals or overlooking important signals. Contemporary measurement used in the detection of ADR signals take into account of the occurrences of adverse drug events; a specific ADR-drug pair supported even by three cases might be reported as a suspicious ADR signal. Therefore, a small amount of duplicate records should have a significant impact on the detection results. Although the problem of duplicate detection has been well studied in the database and statistics communities, little work has been devoted to the detection of duplicate ADR reports. Additionally, previous work neglected the presence of follow-up reports in the SRS databases. A follow-up report complements the information of initial report, so has to be merged with the initial report to form a more accurate and complete version. Wrongly identifying a follow-up as a duplicate or failure to link it to earlier cases obviously will deteriorate the results of detected ADR signals. In this study, we investigated the problem of identifying duplicate reports with the presence of follow-ups. We aim to develop a method that is capable of, given a report, detecting not only its duplicates but also its initial or earlier linkage cases.. 2.
(13) 1.2 Contributions The main contributions of this thesis are summarized as follows: 1. We identify the problem of duplicate ADR report detection in the presence of follow-ups. Although previous work has studied duplicate detection in adverse drug reactions reporting systems, no research has considered the problem of existing follow-up. To the best of our knowledge, our work is the first study on ADR duplicate detection considering the presence of follow-up cases. 2. We propose a new duplicate detection algorithm dedicate to the problem of identifying real duplicate ADR report in the presence of follow-ups. Our method is based on the concept of hybridizing ensemble learning and co-training learning. Experiments on the FAERS dataset showed that our algorithm, comparing with other representative classification methods, can exhibit more accuracy on identifying real duplicate as well as follow-up linkage.. 1.3 Thesis Organization The other chapters of this thesis are organized as follows. In Chapter 2, we first introduce some background about adverse drug reaction detection, including adverse drug reactions, ADR signal detection, and the adverse event reporting systems. We then discuss in Chapter 3 previous work on detecting duplicates [4][34], describe traditional classification methods [35], and introduce two advanced classification methods adopted in our study, including ensemble classification and. 3.
(14) co-training classification. In Chapter 4, we detail the problem of record duplication in the SRS databases, specifically focusing on the FAERS dataset. We describe characteristics of the FAERS dataset, explain situations for causing duplicates, and rationale the importance for differentiating follow-up cases from initial reports. Chapter 5 presents our proposed method for detecting duplicate reports in the FAERS database. We first detail the data pre-processing, including attribute selection and transformation, and training data construction. Then, we describe our method for identifying duplication and follow-up linkage, which is an ensemble with co-training based classification method. Chapter 6 describes the experiments and reports the results. We conducted two experiments. One is to compare our method with four representative classification methods and an ensemble of these four methods. Another one is to inspect the effects of with and without removing duplicate and follow-up to ADR signal detection. Finally in Chapter 7, we discuss the conclusions and future work.. 4.
(15) Chapter 2 Background 2.1 Drug Development Process and Reporting Systems As the advent of modern civilization diseases and epidemics, many medical centers or manufacturers develop new drugs to fight new diseases. All of new drugs need to undergo a series of standard processes before listing (approval for market), which are beginning with pretrial experiment performed on animals, followed by several human clinical trials. Consider the clinical trials in the USA for example. There are four phases of clinical trials. As the drug development process listed in Table 2.1 shows, Phase I confirms the safety and dosage of new drugs. The object is healthy people. Phase II concerns effectiveness and the object consists of a small group of patients, usually 100-300 volunteers. Phase III studies all the possible side effects, especially the effect and impact of long-term usage 2-10 years, as well as similar products on the market comparison. The object involved in this phase is significantly larger than that in phase II, usually 1000-3000. Indeed, phase III is the final step towards FDA approval. If the new drug survives after this phase, a new drug application (NDA) is submitted to the FDA, to make the final decision. After a new drug is listed an additional phase IV, also known as post marketing surveillance, is carried out, during which the manufacturers must track long term usage of this new drug, to obtain more comprehensive safety data. For example according to the FDA’s regulation [15], the drug manufactures have to. 5.
(16) report adverse drug event at quarterly intervals for the first three years after approval, and sporadically report any serious and adverse reactions. This is because even the strictly designed premarketing clinical trials cannot uncover all possible adverse reaction. The risks of long term usage of the new drug in the masses can only be evaluated throughout lifelong postmarketing surveillance. Therefore, many countries and drug-related agencies have established spontaneous reporting systems to collect adverse drug events, submitted by drug manufacturers, doctors, pharmacists, lawyers and other health related personnel. For example, the U.S. FDA Adverse Event Reporting System (FAERS formerly AERS) [14] run by the FDA, the Canada Vigilance Program [18] run by the Health Canada, the U.K. Yellow Card [44] run by the European Medicines Agency (EMA),and the National Reporting System of Adverse Drug Reaction in Taiwan [33].. Table 2.1 Listed drug development process [14]. Process. Purpose. Objects. Drug discovery. Looking for new drug targets. laboratory, cell lines, and animal. Pretrial. Experiment of security and biological. laboratory, and animal. activity IND(Investigational New Drug). FDA examines data. Phase I clinical trial. Safety and dose confirmation. 20-80 healthy volunteers. Phase II clinical trial. Effectiveness and adverse reactions. 100-300 patient volunteers. Phase III clinical trial. Confirm the effectiveness and long-term use. 1000-3000 patient volunteers. of reaction monitoring NDA(New Drug Application). Application for listing and get FDA examines. Phase IV clinical trial. Long-term safety monitoring after listing. 6.
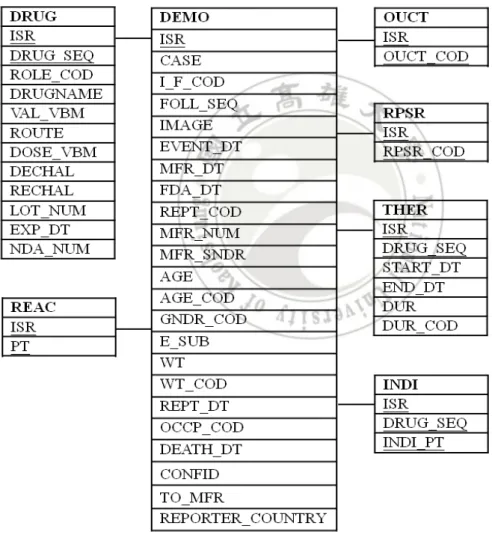
(17) Since our work in this study was conducted using the FAERS database, we describe this database in more detail. The FAERS database is designed to support FDA’s postmarketing safety surveillance program, all adverse event reports submitted to the FDA. The dataset in this database is published quarterly [14], starting from 2004. The schema of FAERS database shown in Figure 2.1 is composed of seven relational data tables, connecting through the key ISR, an identifier for each report.. Figure 2.1 The schema of FAERS database.. 7.
(18) (1) DEMO: Contains patient demographic and administrative information, a single record for each event report. (2) DRUG: Contains drug/biologic information for as many medications as were reported for the event (1 or more per event). (3) REAC: Contains all "Medical Dictionary for Regulatory Activities" (MedDRA [31]) terms coded for the adverse event (1 or more). (4) OUCT: Contains patient outcomes for the event (0 or more). (5) RPSR: Contains report sources for event (0 or more). (6) THER: Contains drug therapy start dates and end dates for the reported drugs (0 or more per drug per event). (7) INDI: Contains all MedDRA terms coded for the indications for use (diagnoses) for the reported drugs (0 or more per drug per event).. 2.2 Measures for ADR Detection The task of adverse drug reaction detection is highly relied on judicious choice of measures. Adverse drug reaction detection measures can be divided into two categories: the measures of disproportionality and the Bayesian method. Two primary measures of disproportionality are Proportional Reporting Ratio (PRR) [13] and Reporting Odds Ratio (ROR) [37]. PRR refers to the proportion of ADR reports for a given drug that are related to a specific adverse reaction, divided by the corresponding proportion for all other drugs in the database. ROR refers to the ratio of a specific adverse reaction caused by the suspected drug to all other drugs, divided by the corresponding ratio of other adverse reactions. They are can be by a 2×2 contingency table, shown in Table 2.2. The PRR and ROR measures are defined as. 8.
(19) follows: PRR ≡ [a / (a + b)] / [c / (c + d)] ROR ≡ (a / c) / (b / d). Table 2.2 The 2×2 contingency table for ADR measurement. Suspected ADR. Without the Suspected ADR. Total. Suspected Drugs. a. b. a+b. Other Drugs. c. d. c+d. Total. a+c. b+d. N = a + b +c + d. The most famous Bayesian based method is the Bayesian Confidence Propagation Neural Network (BCPNN) [27], which implements Bayesian statistics in neural network architecture and calculates a measure, called information component (IC), denoting it computes the degree of association between the two variables. Suppose x is drug and y is ADR. The IC measure is defined as follows: IC = log2 p(x, y) / p(x)p(y)≡ log2 [a(a + b + c + d) / (a + b)(a + c)] where p(x) is the probability of drug x, p(y) is the probability of ADR y, and p(x, y) is the probability of drug x and ADR y appear together in the ADR reports. The drug is highly associated with the ADR, if the IC value of a Drug-ADR pair is higher than a threshold.. 9.
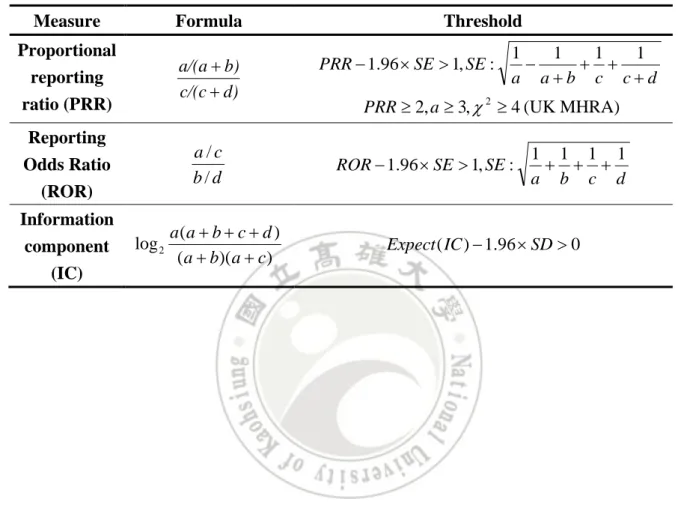
(20) Table 2.3 summarizes contemporary ADR measures and the thresholds used in the pharmacovigilance community for detecting ADRs.. Table 2.3 A summary of contemporary ADR measures. Measure. Formula. Proportional reporting ratio (PRR). a/(a + b) c/(c + d). Reporting. a/c b/d. Odds Ratio (ROR) Information component (IC). log 2. Threshold PRR − 1.96 × SE > 1, SE :. 1 1 1 1 − + + a a+b c c+d. PRR ≥ 2, a ≥ 3, χ 2 ≥ 4 (UK MHRA) ROR − 1.96 × SE > 1, SE :. a(a + b + c + d ) ( a + b)( a + c ). 1 1 1 1 + + + a b c d. Expect ( IC ) − 1.96 × SD > 0. 10.
(21) Chapter 3 Related Work 3.1 Duplicate Detection The problem of duplicate detection also known as record linkage has long been studied in the statistics community. For example, a research conducted by the U.S. census Burtan in 1985 considered the integration of different census units [22], and developed the technique of duplicates detection to determine whether two different units of records refer to the same person. Earlier work on duplicate detection mainly focused on single field matching, that is, to determine if two fields (attributes) refer to the same value. Different types of items require different detection methods [11]. The character-based similarity metrics are designed to handle typographical error, e.g., name and address. Examples include edit distance [28], affine gap distance [48], Smith-Waterman distance [39], Jaro distance metric [49], and Q-gram distance [45]. Methods for measuring the similarly of numeric attributes, e.g., height and weight, are rather primitive. Usually, the numerical data are treated as strings and compared using the metrics described above. In the real worlds, the records consist of multiple types of fields. So many studies have proposed different methods to solve the matching of records with multiple fields. These approaches can be broadly divided into two categories [11]: (1) probabilistic approaches and supervised machine learning techniques, and (2) domain knowledge or distance metrics based approaches. The former requires training data, while the latter does not need training data.. 11.
(22) The main idea of probabilistic approaches is to use a Bayesian inference method to classify training record pairs into two classes, M (Matching) and U (Unmatching), derive the probabilities, and perform Bayesian inference to determine the classes of unknown record pairs. The classes of supervised machine learning techniques usually transform the training data in the form of record pairs, labeled as matching or unmatching, then applies any of classification methods developed in the machine learning community, such as decision tree, SVM, neural network, KNN, etc., to solve the problem. Unlike the first category, the domain knowledge or distance metrics based approaches require no training data. A commonly used distance-based approach is to measure the similarity between individual attributes, using the appropriate metrics described previously, and then combine these similarities to measure the similarity of two records. A threshold is set to determine the matching of the two records. Although lots of works have been conducted on duplicate record detection, very few of them have been devoted to dataset about adverse drug reactions. To the best of our knowledge, the only work on developing duplicate detection methods tailored to the domain of adverse drug reactions is the study by Noren et al. [34]. They proposed a modified hit-miss model for automated duplicate detection in WHO drug safety database. Their method, however, only focusing on identifying high similarity record pairs, do not take into account the existence of follow-up reports, thus is inept to discriminate real duplicate from follow-up linkage. In summary, so far very few literatures have been devoted to duplicate detection in adverse drug reaction reporting systems, and none of them have considered the existence of follow-up reports.. 12.
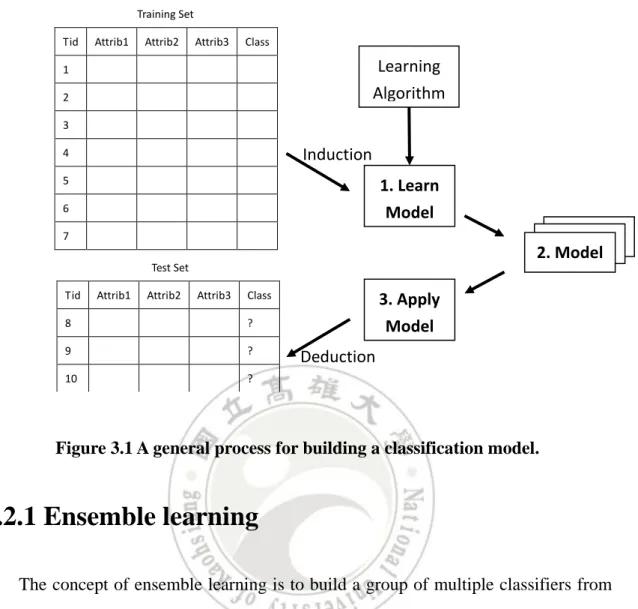
(23) 3.2 Classification Classification is the task of assigning objects of unknown class labels to a predefined class of labels. In general, this task is achieved by learning a model from a set of data with class labels known, called training set. The learned classification model can serve two different purposes: analysis and prediction. Analysis refers to explore the factors that influence data classification; for example, from the established model, we can generate corresponding classification rules that present the factors affecting data classification. Prediction refers to using the model to predict the class label of a unknow data. A classification technique is a systematic approach to building classification models from an input data set. A typical process of classification is shown in Figure 3.1. First, the model is built from a training set. Second, the performance of the model is evaluated the using a test set. After the performance of the classification model meets the requirements, we can start using the model to predict new data label. In the literature, there have been a lot of classification algorithms, for example, decision trees, rule-based method, Nearest-Neighbor, Bayesian, Artificial Neural Networks (ANN), Support Vector Machines (SVM). Most of them are clearly described in most textbooks [25][43]. In the following subsections, we will dedicate our description to two newly developed subbranches of classification methods, ensemble learning and co-training.. 13.
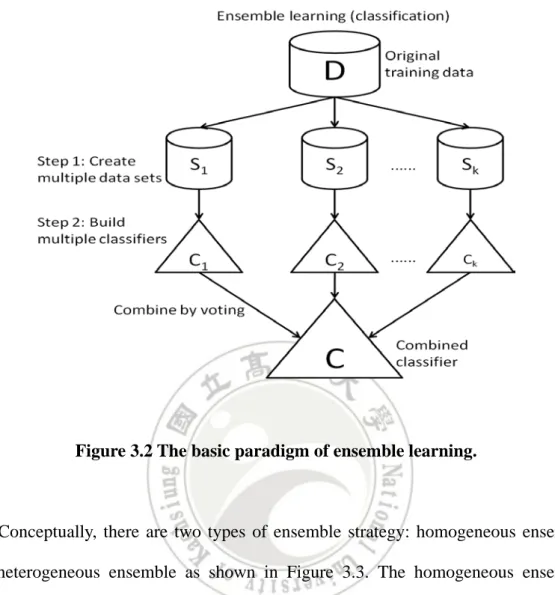
(24) Training Set Tid. Attrib1. Attrib2. Attrib3. Class. Learning Algorithm. 1 2 3. Induction. 4 5. 1. Learn Model. 6. Model Model 2. Model. 7 Test Set Tid. Attrib1. Attrib2. Attrib3. 3. Apply Model. Class. 8. ?. 9. ?. 10. ?. Deduction. Figure 3.1 A general process for building a classification model.. 3.2.1 Ensemble learning The concept of ensemble learning is to build a group of multiple classifiers from the training data by aggregating predictions (voting) and predict reasonable label of new data made by these multiple classifiers. As shown in Figure 3.2, ensemble learning first creates multiple subset, s1, s2, ..., sk, from the original training data D, and then from each subset si, 1 ≤ i ≤ t, builds a classifier ci with weight wi and finally produce the overall classifiers C(X) = w1c1(X)+...+wkck(X), where X denotes an example. Many experimental results and research reports have shown that ensemble learning usually yields more accurate result than any single classification. For example, Freund and Schapire in 1996 tested 22 benchmark problems. Their results showed that by ensemble method one of the problems exhibited little improvement, four of the problems were relatively poor, and the other 18 problems received significant improvement [17]. 14.
(25) Figure 3.2 The basic paradigm of ensemble learning.. Conceptually, there are two types of ensemble strategy: homogeneous ensemble and heterogeneous ensemble as shown in Figure 3.3. The homogeneous ensemble applies a base learning algorithm, for example, decision tree method (J48 in Figure 3.3(a)), to different training subsets to construct multiple classifiers, assigning classifiers different weights to combine the classifiers to produce a single classifier, with higher weights for more accurate classifiers and lower weights for less accurate classifiers. The performance of this type of ensemble learning is highly relied on the way the multiple training subsets are constructed, i.e., step1 in Figure 3.1. Two most widely used approach are bagging [44][5] and boosting [16][38]. The bagging approach employs bootstrap sampling to obtain the training subset. That is, each subset is constructed by sampling with replacement, with the size equal to that of the original training data. Random Forests [6] is the most famous ensemble learning adopting this. 15.
(26) approach. The boosting approach employs an iterative procedure to adaptively change the weight of each training example, i.e., the probability that a training example is selected to be included in the each subset si. Initially, all training examples receive equal weights; the first subset is constructed, and so is the first classifier. In subsequent iteration, the weights of wrongly classified examples in previous iteration are increased while the weights of those correctly classified are decreased. The heterogeneous ensemble builds each classifier by different learning algorithms (similar to a multi-expert system), executed on either the same training set or different subsets. By integrating separate hypothesis and diverse characteristics embedded in each learning algorithm, the resulting classifier usually can yield high predictive accuracy than any single classifier built by a specific learning algorithm. Figure 3.3(b) shows a heterogeneous ensemble composed of four different classifiers built from four different representative learning algorithms, including Bayes (Naïve Bayes), IBk (Instance based learning), JRip (Learning rules by induction), and J48 (Decision tree learning).. Figure 3.3 (a) The concept of homogeneous ensemble and (b) the concept of heterogeneous ensemble.. 16.
(27) 3.2.2 Co-training learning Co-training was introduced by Blum and Mitchell in 1998 [4] to build learning models from the data set with very small amounts of labeled examples and large amounts of unlabeled data. The original model was developed based on the assumption that there exist two different views (characterization or feature sets of data) to classify the data and these two views are conditionally independent. For example, a web page can be classified according to the words occurring at that page (one view) or the words occurring in hyperlinks pointing to that page (another view). The co-training learning builds models in the following way. Initially, each class of features is used to build classifier from the labeled data, resulting in two separate classifiers. In subsequent iterations, the label data is augmented with unlabeled data whose selection and labels are determined corporately according to the results of the two classifiers. Then the two classifiers are retrained using the expanding training data. The entire process continues until the performance of the classifiers converges or no new unlabeled dataset can be selected. In short, co-training uses the unlabeled data to bootstrap the classifiers, helping them to achieve better classification results. Rationale behind the idea of co-training is intuitive. A small amount of training data to build the model is not necessarily representative of the entire data set. Judiciously adding appropriate unlabeled data to the training data hence will enhance the representation for the entire population. Since the work of Blum and Mitchell, the co-training learning technology has been extended from different aspects, examples including the number of classifiers [10][30][53], the multiple learning algorithms [42][52], and features selection [47][50]. All extensions retain the kernel idea of co-training, exploiting the characteristics of large amounts of unlabel data to improve the accuracy of models. 17.
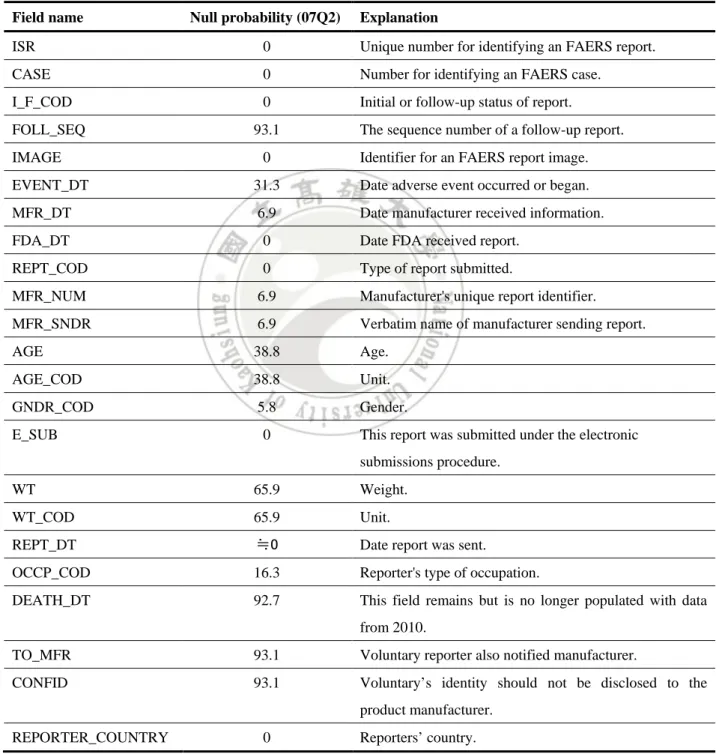
(28) Chapter 4 Duplicate Detection in FAERS Dataset 4.1 Characteristics of FAERS Dataset FAERS is a database designed to assist the FDA to monitor the safety of drugs after the listing, which includes adverse events and medication errors reported information. In United States, healthcare professionals (such as doctors, pharmacists, nurses and others) and consumers (such as patients, their families, lawyers and others) are voluntary to reporting adverse events and medication errors. These reports may also be submitted to the manufacturers. The manufacturers, however, according to the FDA regulation, are obligated to report to FDA regularly any adverse events associated with their medical products. As described in Section 2.1, the FAERS database is composed of seven relational tables, in which the DEMO table is the master file that records information directly related to patients and the report itself. There are in total 23 attributes in DEMO file, including fields: CASE, I_F_COD, FOLL_SEQ, IMAGE, EVENT_DT, MFR_DT, FDA_DT, REPT_COD, MFR_NUM, MFR_SNDR, AGE, AGE_COD, GNDR_COD, E_SUB, WT, WT_COD, REPT_DT, OCCP_COD, DEATH_DT, TO_MFR, CONFID, REPORTER_COUNTRY. Detail meaning of each attribute is shown in Table 4.1. We particularly highlight some attributes that are important to the duplication problem. ISR (primary key) refers to the unique number for identifying an FAERS report, CASE specifies the number for identifying an FAERS case. In other words, an FAERS case 18.
(29) (event) may have several different reports, i.e., different ISRs. The main reason behind this phenomenon is that an initial referring to the same FAERS case. This information is recorded in the I_F_COD field, for “I” denoting initial and “F” denoting following.. Table 4.1 Detail description of table DEMO. Field name. Null probability (07Q2). Explanation. ISR. 0. Unique number for identifying an FAERS report.. CASE. 0. Number for identifying an FAERS case.. I_F_COD. 0. Initial or follow-up status of report.. FOLL_SEQ IMAGE. 93.1. The sequence number of a follow-up report.. 0. Identifier for an FAERS report image.. EVENT_DT. 31.3. Date adverse event occurred or began.. MFR_DT. 6.9. Date manufacturer received information.. FDA_DT. 0. Date FDA received report.. REPT_COD. 0. Type of report submitted.. MFR_NUM. 6.9. Manufacturer's unique report identifier.. MFR_SNDR. 6.9. Verbatim name of manufacturer sending report.. AGE. 38.8. Age.. AGE_COD. 38.8. Unit.. GNDR_COD. 5.8. Gender.. E_SUB. 0. This report was submitted under the electronic submissions procedure.. WT. 65.9. Weight.. WT_COD. 65.9. Unit.. REPT_DT. ≒0. Date report was sent.. OCCP_COD. 16.3. Reporter's type of occupation.. DEATH_DT. 92.7. This field remains but is no longer populated with data from 2010.. TO_MFR. 93.1. Voluntary reporter also notified manufacturer.. CONFID. 93.1. Voluntary’s identity should not be disclosed to the product manufacturer.. REPORTER_COUNTRY. 0. Reporters’ country.. 19.
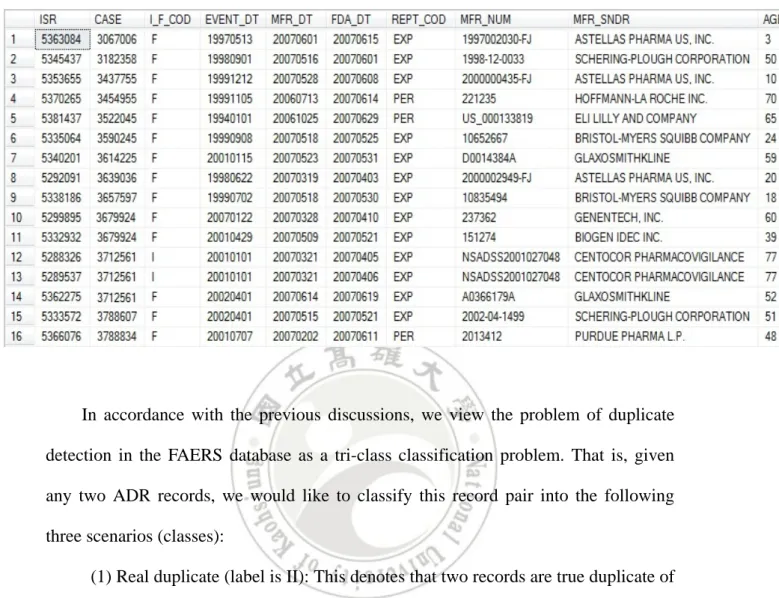
(30) There are lots of missing values in the FAERS database. As an illustration, we have analyzed the dataset of 2007Q2, computing the probability for an attribute being null value. The statistics are also listed in Table 4.1. There are four attributes whose null probabilities are over 90%, including FOLL_SWQ (the sequence number of a follow up report), DEATH_DT (the death date of the patient), TO_MFR (whether or not the reporter also notified manufactures), and CONFID (whether or not the voluntary identity should not be disclosed to the manufacturer). Since null values cause many data analysis problems, we will describe in Section 5.1 our approaches for handling missing values.. 4.2 Duplicate Reporting Problem in FAERS Dataset As described in Section 4.1, healthcare professionals and consumers can report adverse events and medication errors in voluntary directly to FDA and these reports can also be submitted to the manufacturers. In addition, according to the guidance released by the FDA [15], any drug manufactures who are aware of any adverse event involving drugs belonging to their products has the obligation to report that event. Hence, if an event involving several drugs (this is usually the case), the FDA may receive multiple reports referring to the same case, but from different manufacturers. All of the situations described above would cause duplicate records in the FAERS database, which may or may not be identified by the FDA. For example, Table 4.2 is a sample dataset extracted from FAERS. Records #12 and #13 have the same CASE no. but different ISR no., and both are recorded as initial reports. In other words, these two reports are duplicate, which are indeed reported by different reporters. The last two. 20.
(31) records, however, show another scenario. In this case, both have different CASE no. but the same ISR no. and are identified as initial reports. Since both records exhibit the same values in all other attributes, we conclude that they are duplicates. Unfortunately, this case was not correctly identified by the FAERS system. The problem of duplicate detection in the FAERS database is complicated by the existence of follow-up reports. A follow-up indeed is a compensation for the initial report, which contains update information, such as information modification, medication changes, and adverse reactions changes. As a consequence, a follow-up closely resembles its initial report or other linkage follow-ups. A poorly designed detection method that overlooks this phenomenon would yield incorrect results, wrongly identifying two records of (initial, follow-up) or (follow-up, follow-up) as duplicate reports, i.e., (initial, initial). Action taken for dealing with duplicate reports is different from that for initial / follow-up or follow-up / follow-up cases. If two records are identified as duplicate, only one record should be retained, while a follow-up should be merged with its initial report or preceding follow-up to form a more accurate report. Confusing these two situations will bias the case occurrences when we perform some ADR signal detections and result in incorrect signals. To the best of our knowledge, all previous work on ADR duplicate detection does not consider differentiating follow-up linkage from real duplicate.. 21.
(32) Table 4.2 FAERS data sample.. In accordance with the previous discussions, we view the problem of duplicate detection in the FAERS database as a tri-class classification problem. That is, given any two ADR records, we would like to classify this record pair into the following three scenarios (classes): (1) Real duplicate (label is II): This denotes that two records are true duplicate of each other. In the FAERS data format, this case corresponds to records with identical CASE no., different ISR no., and both code “I” in the I_F_COD field. For example, see the 12th and 13th records in Table 4.2. We use “II” label to denote record pairs belonging to such scenario. (2) Follow-up linkage (label is IF&FF): This denotes the relationship between the record pair is initial / follow-up or follow-up / follow-up. According to the FAERS coding format, the former corresponds to record of the same CASE no., but different ISR no., and having diffident I_F_COD, one with “I” and another with “F”. For example, the 13th and 14th records in Table 4.2 represent this case. The latter corresponds to record with identical CASE no., but different ISR no., and the same. 22.
(33) I_F_COD of “F”. Records 10 and 11 in Table 4.2 is an example of this case. We use label “IF&FF” to denote this category. (3) Others (label is OTHER): This denotes all case other than real duplicate and follow-up linkage. We use label “OTHER” to denote this category. Intuitively, real duplicate and follow-up linkage are rare situations. Most of the record pairs belong to “OTHER” category.. 23.
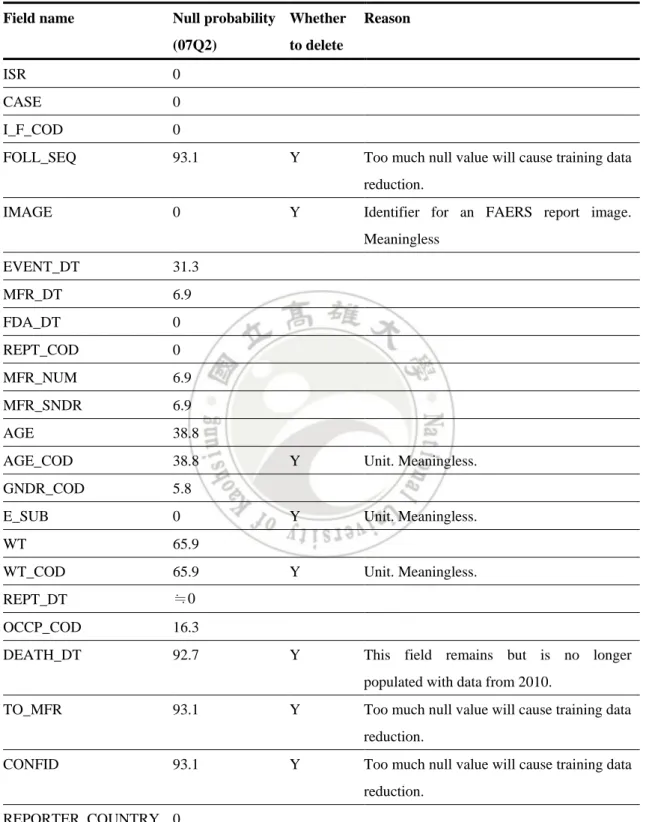
(34) Chapter 5 Proposed Duplicate Detection Method In this chapter, we introduce a duplicate detection algorithm based on ensemble and co-training learning. We first describe the data preprocessing mechanisms in Section 5.1, training set construction in Section 5.2, and then detail our proposed method in Section 5.3.. 5.1 Data Preparation The first step of data preparation is the choice of attributes. We chose fifteen fields (EVENT_DT, MFR_DT, FDA_DT, REPT_COD, MFR_NUM, MFR_SNDR, AGE, GNDR_COD, WT, REPT_DT, OCCP_COD, REPORTER_COUNTRY, DRUGNAME, PT, OUTCOME) out of the FAERS database. The decision was made according to two factors: The attribute contains many missing values or is meaningless to the task of duplicate detection. Detail reasons of choosing attributes are shown in Table 5.1. Secondly, we deleted all tuples containing missing entry. This is because if two records are both missing on the same field they may be identified as the same value during similarity calculation, thus severely biasing the analysis results. For example, the 07Q2 dataset originally contains 83977 records in FAERS; it remains 12789 records after deleting records with null values.. 24.
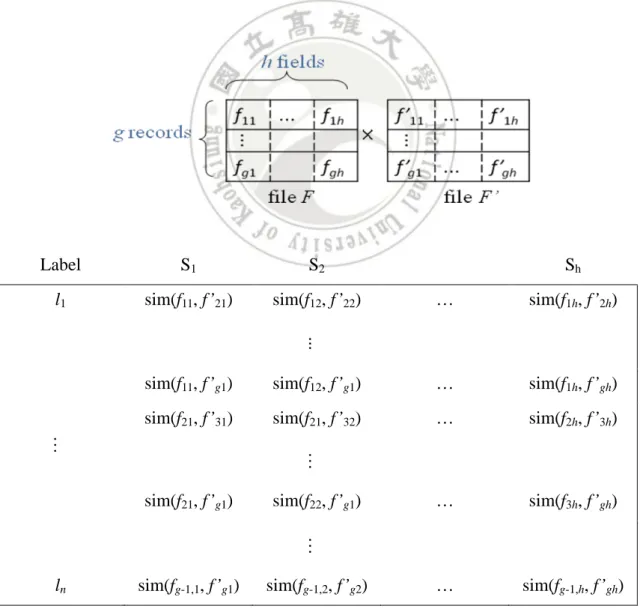
(35) Table 5.1 Detail description for attribute selection. Field name. Null probability Whether (07Q2). ISR. 0. CASE. 0. I_F_COD. 0. FOLL_SEQ. 93.1. Reason. to delete. Y. Too much null value will cause training data reduction.. IMAGE. 0. Y. Identifier for an FAERS report image. Meaningless. EVENT_DT. 31.3. MFR_DT. 6.9. FDA_DT. 0. REPT_COD. 0. MFR_NUM. 6.9. MFR_SNDR. 6.9. AGE. 38.8. AGE_COD. 38.8. GNDR_COD. 5.8. E_SUB. 0. WT. 65.9. WT_COD. 65.9. REPT_DT. ≒0. OCCP_COD. 16.3. DEATH_DT. 92.7. Y. Unit. Meaningless.. Y. Unit. Meaningless.. Y. Unit. Meaningless.. Y. This field remains but is no longer populated with data from 2010.. TO_MFR. 93.1. Y. Too much null value will cause training data reduction.. CONFID. 93.1. Y. Too much null value will cause training data reduction.. REPORTER_COUNTRY 0. Finally, the data preparation ends with transforming the data file into labeled record pairs, each of which is represented by a similarity vector. Let F be a selected. 25.
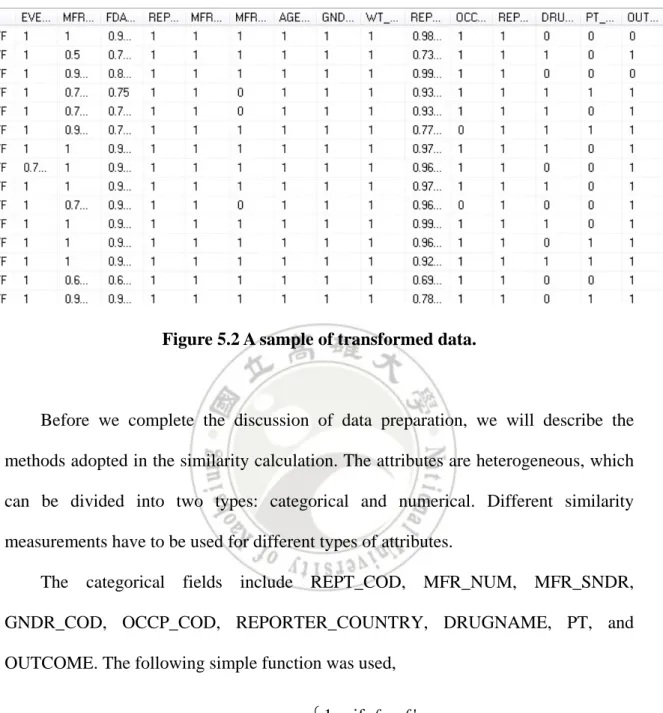
(36) data file consisting of g records and f attributes taken from the FAERS database, and F’ denote a copy of F. For any two records ri and r’j, ri from F and r’j from F’, we construct the following new record: l. sim(fi1, f’j1). sim(fi2, f’j2). …. sim(fih, f’jh). where l denotes the label of this record pair, fik and f’jk the values of attribute Ak in F and F’, respectively, for 1 ≤ i, j ≤ g and 1≤ h ≤ k, and sim(⋅) is the similarity function. Figure 5.1 illustrates the record pair transformation. After the transformation, every record is represented as a label attribute plus a vector of similarities. Figure 5.2 is a real sample of this transformed data set.. Label. S1. S2. l1. sim(f11, f’21). sim(f12, f’22). sim(f11, f’g1). Sh sim(f1h, f’2h). sim(f12, f’g1). …. sim(f1h, f’gh). sim(f21, f’31). sim(f21, f’32). …. sim(f2h, f’3h). sim(f21, f’g1). sim(f22, f’g1). …. sim(f3h, f’gh). sim(fg-1,1, f’g1). sim(fg-1,2, f’g2). …. sim(fg-1,h, f’gh). .... …. …. …. …. ln. Figure 5.1 An illustration of the record pair transformation. 26.
(37) Figure 5.2 A sample of transformed data.. Before we complete the discussion of data preparation, we will describe the methods adopted in the similarity calculation. The attributes are heterogeneous, which can be divided into two types: categorical and numerical. Different similarity measurements have to be used for different types of attributes. The categorical fields include REPT_COD, MFR_NUM, MFR_SNDR, GNDR_COD, OCCP_COD, REPORTER_COUNTRY, DRUGNAME, PT, and OUTCOME. The following simple function was used, 1, if f = f ' sim( f , f ' ) = 0, if f ≠ f ' Numeric fields contain EVENT_DT, MFR_DT, FDA_DT, WT, AGE, and REPT_DT, which can further be divided into two categories: interval and ratio. Obviously, calendar dates, such as EVENT_DT, MFR_DT, FDA_DT, and REPT_DT, are types of interval. The similarity calculation is shown as follows:. 27.
(38) 1 − (| f − f ' | / 365), if | f − f ' | < 365 (365 days in year) sim( f , f ' ) = 0, else . On the other hands, fields WT and AGE belong to the type of ratio. The calculation of similarity is defined as follows: sim(f, f’) = 1 / (1 + |f – f’|).. However, in the FAERS database different units are allowed for fields WT and AGE, such as kilogram, gram, and pounds for WT and year, month, week, day, and hour for AGE. Therefore, we have to convert them to a single unit of measurements, i.e., using kilogram for WT and month for AGE. Table 5.2 shows an example of similarity calculation for input record pair ((GLAXOSMITHKLINE, M, 20050809, CN, FRANCE, 68.4, 120) and (BRISTOL-MYERS SQUIBB COMPANY, M, 20051003, OT, FRANCE, 79.2, 60)).. Table 5.2 An example similarity calculation. Field name. MFR_SNDR GLAXOSMITHKLINE. Record pair. BRISTOL-MYERS SQUIBB COMPANY. Similarity. 0. GNDR REPT_DT OCCP COUNTRY. WT. AGE. M. 20050809. CN. FRANCE. 68.4. 120. M. 20051003. OT. FRANCE. 79.2. 60. 1. 0.15. 0. 1. 0.085. 0.016. 5.2 Training Set Construction The construction of the training set is not trivial. Two main issues worthy of concern are imbalanced classes and uncertain labeling. In the FAERS database, since most records have no duplicate or follow-up, only. 28.
(39) very few record pairs are labeled as II and IF&FF; thus the OTHER class dominates. As shown in Table 5.3, there remain 17277 records in the 07Q2 dataset after pruning missing records, and we obtained 162409536 record pairs after cross joining all records, of which 24674 record pairs are II and IF&FF, containing only 0.15% of the population. It is well known that imbalanced data significantly compromise the performance of standard classification algorithms, inducing rules highly factor majority classes over minority ones [21][46]. To alleviate the problem caused by imbalanced data, we adopted the technique of random undersampling, i.e., randomly choosing a subset of data from the majority class with size approximately equal to minority classes. Next, we address our method for handling the second issue. As we have mentioned in Section 4.2, it is not uncommon that duplicated or follow-up reports were not identified by FDA and not correctly coded in their FAERS database. This means the class of OTHER indeed contained record pairs that belong to II and IF&FF. And these pairs, in fact, are the target set that our algorithm aims to detect. In other words, record pairs of the OTHER class are uncertainly labeled. To alleviate the influence of uncertain labeling of class OTHER, we applied an additional strategy to random undersampling, limiting the pair similarity of data belonging to OTHER no larger than 0.5. This is because highly similar record pairs tend to belong to II and IF&FF.. Table 5.3 An example of training set construction. 07Q2. Number Similarity. Total. Remaining. records. records. 83977. 12789. II. IF&FF. Original. Remaining. OTHER. OTHER. 6224. 6224. 163558521. 6224. 0.67~1. 0.35~1. 0~0.73. 0~0.5. pair. 29.
(40) 5.3 Ensemble and Co-training based Method In this section, we present our algorithm for detecting duplicate record pairs as well as follow-up linkage. Our algorithm is a hybrid of ensemble and co-training learning strategies. The idea is motivated by the fact that we have to build learning models from the data set with very small amounts of labeled instances while large amounts of unlabeled data. We adopt multiple, diverse base classifiers, as a whole to determine the class of a given unknown record pair. Meanwhile, our algorithm utilize unlabeled dataset, choosing those receiving high commitment among the initial base classifiers for being classified as II or IF&FF into the training set, and retain the initial models using the updated training set. As shown in Figure 5.3, our algorithm proceeds in three stages. First, the training set L (with assigned labels) constructed as described in Section 5.2 is processed to build the initial ensemble classifier C. Next, some of the unlabeled data, which refer to all record pairs not identified as II or IF&FF and having high similarity over the threshold are added into the original training set. The choice follows the principle of majority teaching minority. That is, a record pair from the unlabeled set is chosen if it is classified as the class of IF or IF&FF by over half of the base classifiers, c1, c2, …, ct. We consider only II or IF&FF class because these two classes are relatively small compared with the OTHER class. Each chosen unlabeled record pair is given a pseudo label of II or IF&FF, depending on the predicting result of C. Finally, the updated training set L* is used to build the final ensemble classifier C*.. 30.
(41) stage 1:. L II. IF&FF. OTHER. U. ≤threshold ≤threshold. C1. …. C2. Cl. C stage 2: II. U +. OTHER. IF&FF. + ≤threshold. ≤threshold. stage 3:. C*1. …. C*2. C*l. C* Figure 5.3 A conceptual depiction of proposed ensemble and co-training based detection algorithm.. 31.
(42) Algorithm 5.1 details our ensemble and co-training based detection method. The input include a labeled data set L, unlabeled data set U, commitment threshold α, and similarity threshold θ. Let y1, ..., yk denote the possible labels; in this problem, k = 3, denoting three different classes. C1, ..., Ct are the base classifiers. The commitment threshold α denotes the least number of classifers having agreement on the predicting results. In our implementation, we have chosen four different representative classifiers, including Bayesian classifier, instance-based classifier, rule-based classifier, and decision tree, and set α = 3. The prediction of an unlabeled instance x by the ensemble of the base classifier C1, ..., Ct is implemented in the following way. The prediction results of C1, ..., Ct on x are stored as a binary vector V = (v1, ..., vk), vi = 0 or 1, 1 ≤ i ≤. The δ(⋅) function is used as a true-or-false determination of the input statement. For example, if Ci(x) = y1, then. δ(Ci(x) = y1) = 1, and so v1 = 1. Label y represents the most agreed prediction of x among the t classifiers. This is described in step 5 as y = argmaxyj Σi = 1, tδ(Ci(x) = yj), and m is used to keep this number of agreements. So x can be added into U’ only if y = II or IF&FF and m ≥ α (step 7), meaning that at least α classifers have agreement on the predicting results, which implements the concept of majority teaching minority.. Algorithm 5.1: An ensemble and co-training based duplicate detection method 32.
(43) Input: labeled data set L, unlabeled data set U, commitment threshold α, and similarity threshold θ. Output: classifier C*. Method: 1.. U’ = φ ;. 2.. for 1 ≤ i ≤ t do. 3. 4.. build base classifier Ci on L; for each unlabeled example x ∈ U and sim(x) ≥ θ do // predict the class y of x by C = Ensemble (C1, ..., Ct);. 5.. y = argmaxyj Σi = 1, tδ(Ci(x) = yj) ;. 6.. m = Σi = 1, tδ(Ci(x) = y) ;. 7.. if m ≥ α and (y = II or IF&FF) then. 8. 9.. U’ = U’ ∪ {x}; endfor. 10. L = L ∪ U’; 11. for 1 ≤ i ≤ t do 12.. build new classifier C*i on L;. 13. return C* = Ensemble (C*1, ..., C*t);. 33.
(44) Chapter 6 Experiment We conducted two experiments to evaluate the effectiveness and performance of our method. The first experiment focused on the accuracy of our method, compared with four representative classifiers. The second experiment inspected the effect of removing identified duplicate as well as merging follow-ups on the results of signals generated by some ADR detection methods. This chapter presents the results of these two experiments and our discussion.. 6.1 Correctness Analysis of Duplicate Detection A recent work by Cagliero and Garza [8] has provided a widespread comparison of contemporary classification methods. According to their study, we selected four representatives from different categories of classifiers with relatively high accuracy in our experiment. They are Bayesian classifier (Bayesian Network [29][41]), instance-based classifier (IBk [3]), rule-based classifier (JRip [9]), and decision tree (J48 [36]), all of which are available on the Weka package. Additionally, we also implemented an ensemble of these four classifiers, serving as an additional comparator to our algorithm. We chose seven quarters of datasets from FAERS, described as follows: •. 05Q4: include 139 labeled data, 140 unlabeled data.. •. 06Q3: include 255 labeled data, 255 unlabeled data.. •. 07Q2: include 180 labeled data, 180 unlabeled data.. 34.
(45) •. 08Q1: include 196 labeled data, 197 unlabeled data.. •. 09Q4: include 300 labeled data, 300 unlabeled data.. •. 10Q3: include 318 labeled data, 318 unlabeled data.. •. 11Q2: include 624 labeled data, 624 unlabeled data.. Four commonly used measures were adopted in this experiment, including accuracy, precision, recall, and F-measure. Below are the detail definitions. Accuracy =. Precision =. Recall =. number of correct instances total number of instances. number of true positives number of true positives + false postives. number of true positives number of true positives + false negatives. F - Measure =. 2 × Precision × Recall Precision + Recall. As an illustration of computing these measures, we show in Table 6.1 the confusion matrix yielded by executing Bayesian Network on dataset 07Q2. One can observe that the IF&FF class has 129 correctly classified instances and 51 wrong instances. The correctness of algorithm BN on this dataset is (19 + 61 + 49) / 180 = 0.7166 and the precision of class IF&FF is 19 / (19 + 9 + 1) = 0.6551. Table 6.1 07Q2 class Confusion Matrix by Bayesian Network. Confusion Matrix a. b. c. ←classified as. 19. 39. 2. a = IF&FF. 9. 61. 0. b = II. 1. 0. 49. c = OTHER. 35.
(46) Table 6.2 presents the results of all measures, including correctness, precision, recall, and f-measure, on the 07Q3 dataset. An accuracy of 100% means that the measured values are exactly the same as the given values. One can observe that our method outperforms all other classifiers in all measures.. Table 6.2 The results performed on dataset 07Q2 with 10 cross-verifications. Bold values indicate the best results.. BN. Lazy-IBk. Rule-JRip. Tree-J48. ensemble. Co-training + Ensembl. Accuracy. Precision. Recall. F-Measure. Label. 71.67. 0.61. 0.871. 0.718. II. 0.655. 0.317. 0.427. IF&FF. 0.961. 0.98. 0.97. OTHER. 0.65. 0.743. 0.693. II. 0.64. 0.533. 0.582. IF&FF. 1. 1. 1. OTHER. 0.873. 0.786. 0.827. II. 0.964. 0.396. 0.562. IF&FF. 0.998. 0.998. 0.998. OTHER. 0.853. 0.829. 0.841. II. 0.754. 0.817. 0.784. IF&FF. 0.979. 0.92. 0.948. OTHER. 0.903. 0.929. 0.915. II. 0.914. 0.883. 0.898. IF&FF. 1. 1. 1. OTHER. 0.936. 0.936. 0.936. II. 0.921. 0.921. 0.921. IF&FF. 1. 1. 1. OTHER. 74.44. 85. 85. 93.33. 94.35. 36.
(47) Table 6.3 shows a summary of the classification accuracy of all classifiers on the seven datasets. Our method wins in all datasets.. Table 6.3 Comparison of classification accuracy on the seven datasets. Bold values indicate the best results and values in parentheses indicate the size of U’.. Dataset. BN. IBk. JRip. J48. Ensemble. Co-training + Ensemble. 05Q4 (55). 67.63. 79.14. 79.86. 81.29. 94.96. 91.24. 06Q3 (90). 77.25. 82.75. 82.35. 82.35. 89.8. 87.83. 07Q2 (68). 71.67. 74.44. 85. 85. 93.33. 94.35. 08Q1 (98). 75.96. 76.02. 87.24. 89.8. 92.35. 94.22. 09Q4 (87). 73.67. 83.33. 81. 78.67. 87.33. 92.25. 10Q3 (174). 84.91. 82.7. 91.82. 92.14. 92.77. 95.32. 11Q2 (230). 87.82. 89.74. 94.55. 94.23. 95.99. 96.96. 37.
(48) Tables 6.4 and 6.5 show the evaluations specific to class II; precision and recall measures are shown in Table 6.4 while Table 6.5 shows the F-measure. Our method outperforms all other methods.. Table 6.4 Evaluation results for class II. P indicates precision, R indicates recall, and bold values indicate the best results. Dataset. BN. IBk. JRip. J48. Ensemble. Co-training + Ensemble. P. R. P. R. P. R. P. R. P. R. P. R. 05Q4. .523. .958. .702. .688. .818. .563. .844. .563. .956. .896. .927. .821. 06Q3. .685. .848. .79. .79. .775. .819. .78. .81. .851. .924. .882. .854. 07Q2. .61. .871. .65. .743. .873. .786. .853. .829. .903. .929. .936. .936. 08Q1. .565. .953. .636. .656. .82. .781. .855. .828. .877. .891. .938. .931. 09Q4. .631. .883. .761. .85. .564. .954. .69. .892. .763. .992. .863. .975. 10Q3. .683. .96. .712. .747. .808. .98. .815. .98. .817. .99. .907. .99. 11Q2. .823. .897. .838. .914. .893. .992. .897. .963. .91. .996. .938. .994. Table 6.5 F-measures of class II. Dataset. BN. IBk. JRip. J48. Ensemble. Co-training + Ensemble. 05Q4. .676. .695. .667. .675. .925. .89. 06Q3. .757. .79. .796. .794. .886. .868. 07Q2. .718. .693. .827. .841. .915. .936. 08Q1. .709. .646. .8. .841. .884. .935. 09Q4. .736. .803. .709. .778. .862. .916. 10Q3. .798. .729. .886. .89. .895. .947. 11Q2. .858. .874. .94. .929. .951. .965. 38.
(49) Finally, the results in Tables 6.6 and 6.7 demonstrate the evaluation specific to class IF&FF. Our algorithm beats all other methods except the precision on dataset 11Q2.. Table 6.6 Evaluation results for class IF&FF. P indicates precision, R indicates recall, and bold values indicate the best results. Dataset. BN. IBk. JRip. J48. Ensemble. Co-training + Ensemble. P. R. P. R. P. R. P. R. P. R. P. R. 05Q4. .571. .087. .681. .696. .661. .848. .672. .891. .898. .957. .818. .969. 06Q3. .68. .453. .707. .707. .721. .653. .714. .667. .877. .76. .802. .83. 07Q2. .655. .317. .64. .533. .75. .85. .754. .817. .914. .883. .921. .921. 08Q1. .688. .186. .607. .576. .778. .831. .82. .847. .879. .864. .901. .911. 09Q4. .533. .198. .731. .605. .718. .892. .702. .407. .978. .543. .953. .802. 10Q3. .925. .527. .716. .677. .972. .753. .972. .753. .986. .763. .986. .867. 11Q2. .716. .608. .786. .642. .978. 75.. .931. .783. .99. .8. .99. .986. Table 6.7 F-measures for class IF&FF. Dataset. BN. IBk. JRip. J48. Ensemble. Co-training + Ensemble. 05Q4. .151. .688. .743. .766. .926. .887. 06Q3. .544. .707. .685. .69. .814. .816. 07Q2. .427. .582. .797. .784. .898. .921. 08Q1. .293. .591. .803. .833. .872. .906. 09Q4. .288. .662. .796. .516. .698. .871. 10Q3. .671. .696. .848. .848. .861. .923. 11Q2. .658. .706. .849. .851. .885. .941. 39.
(50) Finally, we conducted an additional experiment to inspect how our algorithm can identify duplicates that were known in the literature. Specifically, we referenced the work conducted by Hauben et al. [18]. They referred to “For the year 2005, there were 66 cases in total reporting aortic dissection, of which 20 were reported with the drug of interest. All 20 cases reported: the same event date, the same 11 suspect medications, the same outcome and the same gender. ‘Age’ was not reported.” Therefore, we first identified all cases having reaction of AORTIC DISSECTION, obtaining 72 cases, of which after removing all explicit follow-ups according to the FDA coding regulation (see detail description in Section 4.2) we obtained 16 cases that have the same event date, the same gender, and ‘Age’ was not reported. Finally, we performed cross joining of these 16 cases, producing 120 pairs. Note that these pairs were not correctly identified by the FDA and shall be classified as OTHER by the FDA coding rules. Our algorithm predicted that all pairs belong to IF&FF, implying that all these cases were follow-up reports that refer to the same patient. This result does not totally conform to the result by Hauben et al. The best reason for explaining this phenomenon is that Hauben et al. did not differentiate follow-up linkage from real duplicate while our algorithm did.. 6.2 Impact of Duplicate Elimination on ADR Detection In this experiment, we intended to inspect how the existence of duplicate reports can influence the detection of adverse drug reactions signal quality. For this purpose, we examined the 26 suspected ADRs released in the FDA annual report in 2008, using our interactive detection system for adverse drug reaction (iADRs) [20]. Among the 26. 40.
(51) suspected ADRs released in 2008, our system discovered two ADR signals as shown in Table 6.8. These two signals were ranked 98th and 99th among the 100 generated signals. After removing all duplicate or follow-up reports, these two signals remained in the suspect listing, but the rankings were promoted to 92th and 95th, as shown in Table 6.9.. Table 6.8 Detection of ADR signals without removing duplicate. ORDER. DRUG. REACTION. PRR. 98. ANTIBIOTICS. ANGIOTENSIN CONVERTING ENZYME INCREASED. 3403.4. 99. ALLI. STEATORRHOEA. 3374.9. Table 6.9 Detection of ADR signals with removing duplicate. ORDER. DRUG. REACTION. PRR. 92. ANTIBIOTICS. ANGIOTENSIN CONVERTING ENZYME INCREASED. 3390.6. 95. ALLI. STEATORRHOEA. 3330.1. This experiment though is preliminary, has demonstrated the effect of duplicate reports on the results of detected ADR signals. Our results show that removing duplicates seem to improve the quality of detected ADR signals though this preliminary study is not enough to hinder the possibility of negative effect. In the future, we plan to conduct more comprehensive experiments to inspect the influence of duplicate or follow-up reports.. 41.
(52) Chapter 7 Conclusions and Future Work 7.1 Conclusions. The existence of duplicate as well as follow-up report is common in the without carefully detecting and removing adverse drug event reporting systems. In this thesis, we present the problem of duplicate detection in the ADR reporting systems, highlighting the effect of follow-up, and conduct a case study on the FAERS database. We formalized the problem as a tri-class classification problem, and such kind of duplicates will surely bias the results obtained by adverse drug reactions signal detection, proposed an ensemble with co-training based method to accomplish the task, identifying a record pair as real duplicate, follow-up linkage or others. We conducted experiments on several quaintly reported datasets from the FAERS database to compare our method with some representative classifiers. The experimental results showed that our method is superior to other method in most of the test cases. Although further is needed, this preliminary result has shown the feasibility of our proposed method to the problem.. 7.2 Future Work This research can be extended from several avenues. First, although our method exhibited comparable results with contemporary method, and out performs in most of. 42.
(53) the test there is a lot of room to improve the effectiveness of our algorithm. We will devise more effective improve the accuracy of our algorithm, especially in classifying classes II and IF&FF, hoping to identify more accurate duplicate as well as follow-up in FAERS. Second, we will enhance the performance of our method. The current implementation of our approach cost 40 to 50 minutes to deal with 90000 records. Since the FAERS data is enlarging quarterly, we need a more efficient approach to meet future release of huge data. Finally, in this study, we use simple deletion policy to handle missing values, but these data may contain some duplicates or follow-up, because follow-up record may omit the patient's demographics. How other methods for dealing with missing value would affect the accuracy of duplicate detection requires further investigation.. 43.
(54) References [1] P. Achimugu, A. Soriyan, O. Oluwagbema, and A. Ajayi, “Record linkage system in a complex relational database - MINPHIS Example,” Studies in Health Technology and Informatics, vol. 160, no. 2, pp. 1127-1130, 2010. [2] R. Agrawal and R. Srikant, "Searching with numbers," IEEE Transactions on Knowledge and Data Engineering, vol. 15, no. 4, pp. 855-870, 2003. [3] D.W. Aha, D.F. Kibler, and M.K. Albert, “Instance-based learning algorithms,” Machine Learning, vol. 6, no. 1, pp. 37-66, 1991. [4] A. Blum, and T. Mitchell, “Combining labeled and unlabeled data with co-training,” in Proceedings of the Conference on Computational Learning Theory, pp. 92-100, 1998. [5] L. Breiman, “Bagging predictors,” Machine Learning, vol. 24, no. 2, pp. 123-140, 1996. [6] L. Breiman, “Random forests,” Machine Learning, vol. 45, no. 1, pp. 5-32, 2001. [7] A.D. Brinker and J. Beitz, “Spontaneous reports of thrombocytopenia in association with quinine: clinical attributes and timing related to regulatory action,” American Journal of Hematology, vol. 70, no. 4, pp. 313-317, 2002. [8] L. Cagliero, and P. Garza, “Improving classification models with taxonomy information,” Data and Knowledge Engineering, vol. 86, no. 1, pp. 85-101, 2013. [9] W.W. Cohen, “Fast effective rule induction,” in Proceeding of the International Conference on Machine Learning, pp. 115-123, 1995. [10] C. Deng, and M.Z. Guo, “A new co-training-style random forest for computer aided diagnosis,” Intelligent Information Systems, vol. 36, no.3, pp. 253–281, 2011. [11] A.K. Elmagarmid, P.G. Ipeirotis, and V.S. Verykios, “Duplicate record detection: 44.
(55) A survey,” IEEE Transactions on Knowledge and Data Engineering, vol. 19, no. 1, pp. 1-16, 2007. [12] European Medicines Agency, Available: http://www.ema.europa.eu/ema/, [Jun. 17, 2013]. [13] S.J.W. Evans, P.C. Waller, and S. Davis, “Use of proportional reporting ratios (PRRs) for signal generation from spontaneous adverse drug reaction reports ,” Pharmacoepidemiology and Drug Safety, vol. 10, no.6, pp. 483–486, 2001. [14] FDA. Adverse. Event. Reporting. System,. Available:. http://www.fda.gov/cder/aers/default.htm, [Jun. 11, 2013]. [15] FDA’s Draft Guidance for Industry: Postmarketing Safety Reporting for Human Drug and Biological Products Including Vaccines, March 2001. Available: http://www.fda.gov/BiologicsBloodVaccines/GuidanceComplianceRegulatoryInfo rmation/Guidances/Vaccines/ucm074850.htm [16] Freund, and R.E. Schapire, “A decision-theoretic generalization of online learning and an application to boosting,” Computer and System Sciences, vol. 55, no. 1, pp. 119-139, 1997. [17] Y. Freund, and R.E. Schapire, “Experiments with a new boosting algorithm,” in Proceeding of the International Conference on Machine Learning, pp. 148-156, 1996. [18] M. Hauben, L. Reich, J.D. Micco, and K. Kim, “‘Extreme duplication’ in the US FDA adverse events reporting system database,” Drug Safety, vol. 30, no. 6, pp.551-554, 2007. [19] Health Canada, Available: http://www.hc-sc.gc.ca/ahc-asc/branch-dirgen/hpfb-dgpsa/hpfi-ipsa/index-eng.ph p#cont, [Jun. 17, 2013]. [20] Interactive Detection System for Adverse Drug Reaction (iADRs), Available: 45.
(56) http://iadr.csie.nuk.edu.tw/website/Default.aspx, [Jun. 17, 2013]. [21] N. Japkowicz, “The Class Imbalance Problem: Significance and Strategies,” in Proceeding of the International Conference on Artificial Intelligence, pp. 111-117, 2000. [22] M.A. Jaro, “Advances in record-linkage methodology as applied to matching the 1985 census of Tampa, Florida,” American Statistical Association, vol. 84, no. 406, pp. 414-420, 1989. [23] K. Jeong, J. Xu, D. Erdogmus, and J.C. Príncipe, “A new classifier based on information theoretic learning with unlabeled data”, Neural Networks, vol. 18, no. 5-6, pp. 719-726, 2005. [24] Z. Jiang, J. Zeng, and S. Zhang, “Inter-training: Exploiting unlabeled data in multi-classifier systems,” Knowledge-Based Systems, vol. 45, no. 8-19, pp.8-19, 2013. [25] A. Karahoca, Advances in Data Mining Knowledge Discovery and Applications, Location: InTech, 2012. [26] N. Koudas, A. Marathe, and D. Srivastava, “Flexible string matching against large databases in practice,” in Proceeding of the International Conference on Very Large Databases, pp. 1078-1086, 2004. [27] A. Lansner, and O. Ekeberg, “A one-layer feedback artificial neural network with a Bayesian learning rule,” Neural Systems, vol. 1, no.1 ,pp.77-87, 1989. [28] V.I. Levenshtein, “Binary codes capable of correcting deletions, insertions and reversals,” Soviet Physics Doklady, vol. 10, no. 8, pp. 707-710, 1966. [29] D.D. Lewis, “Naive (Bayes) at forty: The independence assumption in information retrieval,” in Proceeding of the European Conference on Machine Learning, pp. 4-15, 1998. [30] M. Li, and Z.H. Zhou, “Improve computer-aided diagnosis with machine learning 46.
(57) techniques using undiagnosed samples,” IEEE Transaction on Systems, Man, and Cybernetics, vol. 37, no. 6, pp. 1088–1098, 2007. [31] MedDRA Medical Dictionary for Regulatory Activities Maintenance and support Services Organization, Available: http://www.meddramsso.com/, [Jun. 17, 2013]. [32] MHRA Medicines and Healthcare Products Regulatory Agency, Available: http://www.mhra.gov.uk/#page=DynamicListMedicines, [Jun. 17, 2013]. [33] National. Reporting. System. of. Adverse. Drug. Reaction. in. Taiwan,. Available: http://adr.doh.gov.tw, [Jun. 17, 2013]. [34] G.N. Norén, R. Orre, A. Bate, and I.R. Edwards, “Duplicate detection in adverse drug reaction surveillance,” Data Mining and Knowledge Discovery, vol. 14, no. 3, pp.305-328, 2007. [35] T.N. Phyu, “Survey of classification techniques in data mining,” in Proceedings of the International MultiConference on Engineers and Computer Scientists, vol. 1, no. 1 , pp. 18-20, 2009. [36] J. Quinlan. 1993. C4.5: Programs for Machine Learning. Morgan Kaufmann Publishers Inc. San Francisco, CA, USA. [37] K.J. Rothman, S. Lanes, and S.T. Sacks, “The reporting odds ratio and its advantages over the proportional reporting ratio,” Pharmacoepidemiology and Drug Safety, vol. 13, no. 8, pp. 519-523, 2004. [38] R.E. Schapire, “The strength of weak learnability,” Machine Learning, vol. 5, no. 2, pp. 197-227, 1990. [39] T.F. Smith and M.S. Waterman, “Identification of common molecular subsequences,” Molecular Biology, vol. 147, no. 1, pp. 195-197, 1981. [40] E. Song, D. Huang, G. Ma, and C.C. Hung, “Semi-supervised multi-class adaboost by exploiting unlabeled data,” Expert Systems with Applications, vol. 38, no 6, pp. 6720-6726, 2011. 47.
(58) [41] J. Su, and H. Zhang, “Full bayesian network classifiers,” in Proceedings of the International Conference on Machine Learning, pp. 897-904, 2006. [42] S. Sun, and Q. Zhang, “Multiple-view multiple-learner semi-supervised learning,” Neural Processing Letters, vol. 34, no. 3, pp. 229–240, 2011. [43] P.N. Tan, M. Steinbach, and V. Kumar, Introduction to Data Mining, Location: Addison-Wesley Companion Book Site, 2006. [44] U.K. Yellow Card, Available: http://yellowcard.mhra.gov.uk, [Jun. 17, 2013]. [45] J.R. Ullmann, “A binary n-gram technique for automatic correction of substitution, deletion, insertion, and reversal errors in words,” The Computer Journal, vol. 20, no. 2, pp. 141-147, 1977. [46] B.C. Wallace and I.J. Dahabreh, “Class probability estimates are unreliable for imbalanced data,” in Proceedings of the IEEE International Conference on Data Mining, pp.695-704, 2012. [47] J. Wang, S.W. Luo, and X.H. Zeng, “A random subspace method for co-training,” in Proceedings of the International Conference on Computational Intelligence, pp. 195–200, 2008. [48] M.S. Waterman, T.F. Smith, and W.A. Beyer, “Some biological sequence metrics,” Advances in Mathematics, vol. 20, no. 4, pp. 367-387, 1976. [49] W.E. Winkler and Y. Thibaudeau, An Application of the Fellegi-Sunter Model of Record Linkage to the 1990 US Decennial Census. Technical Report Statistical Research Report Series RR91/09. US Bureau of the Census, Washington, 1991. [50] Y. Yaslan, and Z. Cataltepe, “Co-training with relevant random subspaces,” Neurocomputing, vol. 73, no. 10-12, pp. 1652–1661, 2010. [51] X. Zhao, M. Li, J. Xu, and G. Song, “An effective procedure exploiting unlabeled data to build monitoring system,” Expert Systems with Applications, vol. 38, no 8, pp. 10199-10204, 2011. 48.
(59) [52] Y. Zhou, and S. Goldman, “Democratic co-learning,” in Proceedings of the International Conference on Tools with Artificial Intelligence, pp. 594–602, 2004. [53] Z.H. Zhou, and M. Li, “Tri-training: exploiting unlabeled data using three classifiers,” IEEE Transactions on Knowledge and Data Engineering, vol. 17, no. 11, pp. 1529–1541, 2005.. 49.
(60)
數據
![Table 2.1 Listed drug development process [14].](https://thumb-ap.123doks.com/thumbv2/9libinfo/8788489.219157/16.892.118.841.474.1089/table-listed-drug-development-process.webp)
+7
相關文件
The function f (m, n) is introduced as the minimum number of lolis required in a loli field problem. We also obtained a detailed specific result of some numbers and the upper bound of
Students are able to use different learning strategies such as inquiry, reasoning, and problem solving skills in various learning activities. Teachers will employ a variety
Then, we recast the signal recovery problem as a smoothing penalized least squares optimization problem, and apply the nonlinear conjugate gradient method to solve the smoothing
Then, we recast the signal recovery problem as a smoothing penalized least squares optimization problem, and apply the nonlinear conjugate gradient method to solve the smoothing
Accordingly, we reformulate the image deblur- ring problem as a smoothing convex optimization problem, and then apply semi-proximal alternating direction method of multipliers
Numerical results are reported for some convex second-order cone programs (SOCPs) by solving the unconstrained minimization reformulation of the KKT optimality conditions,
11 (1998) 227–251] for the nonnegative orthant complementarity problem to the general symmet- ric cone complementarity problem (SCCP). We show that the class of merit functions
In this paper, we extend this class of merit functions to the second-order cone complementarity problem (SOCCP) and show analogous properties as in NCP and SDCP cases.. In addition,
