DOI: 10.1039/b407209j
D
alto
n
www
.rsc
.or
g/dalt
on
F U L L P A P E RIsolation and characterization of iridium(
III
) and iridium(
V
)
complexes of 2-(arylazo)pyridine and studies of amine fusion
reactions at the coordinated diazo-ligand†
Manashi Panda,
aChayan Das,
aGene-Hsiang Lee,
bShie-Ming Peng
band
Sreebrata Goswami*
aa
Department of Inorganic Chemistry, Indian Association for the Cultivation of Science, Kolkata,
700 032, India. E-mail: icsg@mahendra.iacs.res.in; Fax: +91 33 2473 2805
b
Department of Chemistry, National Taiwan University, Taipei, Taiwan, Republic of China
Received 12th May 2004, Accepted 14th July 2004
First published as an Advance Article on the web 9th August 2004
The reaction of IrCl3·3H2O with 2-(arylazo)pyridine (HL1) in boiling methanol has afforded [IrIIICl2(L1)(HL1)] (1) and
[IrVCl4(HL1)]Cl (2). In complex 1, one of the two ligands [L1]− is orthometallated via coordination of an ortho-carbon of
the aryl ring of [L1]− and one of the two azo nitrogens to form a five-membered chelate. X-Ray crystal structures of the
two representative complexes, viz. 1a and 2a, have been solved. Notably, the Ir–N length (2.140(3) Å) trans to the Ir–C bond in 1a is appreciably longer than the other three Ir–N lengths present in the same molecule. The N–N lengths in these two compounds lie close to that observed in the uncoordinated ligand. Thorough NMR studies were made to authenticate the carbon-bonded structure of compound 1a. In its 13C NMR spectrum, the resonance near 148 is assigned to the carbon
bonded to the iridium metal center. UV-visible spectra along with the redox properties of these complexes are reported. The iridium(V) complex, 2 showed a reversible response near 1.40 V, presumably due to the iridium(V)–iridium(VI) couple. Several reductive responses at cathodic potentials, due to ligand reductions, were also observed. Metal promoted aromatic ring amination reactions at the coordinated HL1 ligand in complexes 1 and 2 were investigated. The products were
characterized using X-ray diffraction.
Introduction
Platinum group metal complexes of 2-(arylazo)pyridine (abbreviated as HL1) ligand systems1 have been the subject of
considerable interest because of their rich redox and spectroscopic behaviour,2 catalytic activities and isomerization reactions.1h,3
During recent years, much activities in these systems have been concentrated around unusual types of metal mediated chemical transformations of the coordinated HL1 ligand via C–H
activa-tion. The first reports on ruthenium and osmium complexes of HL1 were published1e,g,h about two decades ago. Subsequently,
hydroxylation,4 and thiolation5 reactions at platinum group metal
coordinated HL1 were noted. In the recent past we have been
engaged in the study6 of the aromatic ring amination reactions
on coordinated HL1. More insights into the regioselectivity of the
aforesaid amination reactions were achieved by the use of substitu-tionally inert rhodium(III) complexes of HL1. As a logical
continua-tion of our ongoing work in this area of chemistry, we have been in search of suitable iridium–HL1 substrates for carrying out metal
mediated reactions. Literature survey has revealed that there exist only two reports on iridium–HL1 complexes. The first one7 was on
FAB mass spectral analysis of [IrCl2(HL1)2]+; its synthesis and
pro-perties, however, was not available. The more recent report8 is on
the synthesis and characterization of some mixed ligand iridium(I) complexes, whose compositions and structures are similar9 to those
of the rhodium(I) congeners.
In this work we have investigated iridium complexes that are obtained from the reaction of hydrated iridium(III) chloride and HL1. The reaction yielded a brown mixture from which a chloro
bis-chelated complex of iridium(III) and a mixed-ligand iridium(V) complex were isolated. Interestingly, one of the two coordinated ligands in the trivalent iridium complex coordinates as an anionic C,N-donor. This coordination mode of the reference ligand was not
observed before.1–3 In the C,N-coordination mode, the ligand is
deprotonated and its pyridyl nitrogen remains uncoordinated. This is in contrast with the neutral N,N-coordination mode wherein the pyridyl nitrogen as well as one of the two azo nitrogens take part in coordination to form a five-membered chelate (Chart 1).
† Electronic supplementary information (ESI) available: Fig. S1: 1H NMR
spectra of 1a and tcc-[RuCl2(HL1a)2] in CDCl3. Inset: Methyl resonances
of 1b. Fig. S2: 13C NMR spectra of 1a and tcc-[RuCl2(HL1a)2] in CDCl3.
Fig. S3: Cyclic voltammogram of 1a in CH3CN. Fig. S4: Cyclic
voltammo-gram of 2a in CH3CN. See http://www.rsc.org/suppdata/dt/b4/b407209j/
Chart 1
The most notable part of the present reaction is the formation of a pentavalent iridium complex. The ease with which it is formed is unprecedented in the literature. We wish to note10 here that the
most common oxidation states exhibited by iridium complexes are I and III. Examples of iridium(V) complexes, on the other hand, are scanty.11 The majority of these are organometallic complexes and
mostly contain hydride as a coligand. As far as we are aware the flouro complexes, [IrVF6]A (A = Na, K, Ag) that were reported12
in 1954 are the best characterized non-organometallic pentavalent iridium complexes. However, the X-ray structure of none of these is available in the literature. During recent years there has been an upsurge in the chemistry of iridium(V) complexes because of their involvement13 in iridium(III) mediated catalytic C–H activation
processes. Having been successful in the isolation of Ir–HL1
com-plexes, we have investigated amine fusion reactions on the aryl ring of the coordinated ligands in the above complexes. Isolation and complete characterization of the products follow the reactions.
[L1a]−, 76.66(15)°, is marginally larger than that of the neutral
ligand, HL1a, 74.40(13)°. Notably, the Ir–N(3) length (2.140(3) Å)
trans to the Ir–C(22) bond is appreciably longer than the other two
Ir–N lengths (av. 2.046(3) Å) present in this molecule. Lengthening of the Ir–N distance trans to Ir–C is in fact a diagnostic feature14h,15
in orthometallated iridium(III) complexes. The Ir–C(22) length, 2.021(4) Å is comparable15 to that observed in related iridium(III)
orthometallated complexes. The two N–N lengths in 1a are similar in their average value (1.261(5) Å) and lie close to the N–N length observed16 (1.258(5) Å) in the perchlorate salt of the protonated
ligand [H2L1a]ClO4. Notably, these N–N lengths are appreciably
shorter8 than that observed in the Ir(I)–HL1 complexes (>1.30 Å).
This may be attributed to the absence of any significant Ir(d)– azo(p) interaction in the present trivalent iridium complexes. The central metal atom in this structure sits in a plane formed by three coordinating nitrogens viz N(1), N(3) and N(5) together with C(22) with no atom deviating by >0.02 Å. Notably, far IR spectra of complexes 1a and 1b (HL1 = HL1b) displayed an intense, sharp
and single band near 325 cm−1 confirming1 the presence of a
trans-MCl2 grouping.
Results and discussion
The reaction of HL1 with hydrated IrCl3 (2 : 1 molar proportion)
in boiling methanol produced a brown mixture in about 4 h. The crude mass, so obtained, upon evaporation of the solvent produced a mixture of several products. Two pure brown compounds have thus far been separated on a preparative TLC plate. There are many small overlapping bands, which could not be isolated in the pure state and we do not consider these any further. While the com-pound, obtained from the first brown band (brown I, 1) was soluble in common organic solvents, the second polar brown band yielded a cationic complex (brown II, 2), which was soluble only in polar solvents such as acetonitrile, alcohols etc. Notably, the reaction is solvent dependent and does not proceed at all in a non-hydroxylic solvent such as acetonitrile.
A. Brown I, 1
A brown band was first eluted with chloroform. A dark compound (1) was obtained by evaporation of the chloroform eluate in ca. 20% yield.
Fig. 1 shows the ORTEP and atom numbering scheme of a representative 1a (HL1 = HL1a) and selected bond lengths are
collected in Table 1. In this complex the central iridium(III) is surrounded by a distorted octahedral coordination environment by two trans-chloride ligands, one bidentate neutral HL1a ligand
(N,N) and an anionic [L1a]− ligand (C,N). The asymmetric unit
also contains one CH2Cl2 molecule as a solvent of crystallization.
The ligand, [L1a]− is orthometallated and coordinates to iridium(III)
using the ortho-carbon, C(22) of the phenyl ring and the azo-nitrogen N(5) so as to form a five-membered chelate. Notably, the pyridyl nitrogen N(4) of this ligand remains unused. We wish to note here that such a coordination mode of the reference ligand
via C–H dissociation has not been observed previously. However,
examples of orthometallated14 iridium(III) complexes are numerous.
In the present structure the chelate bite angle of the anionic ligand ‡ The atom numbering scheme used in this section is as shown in Chart I.
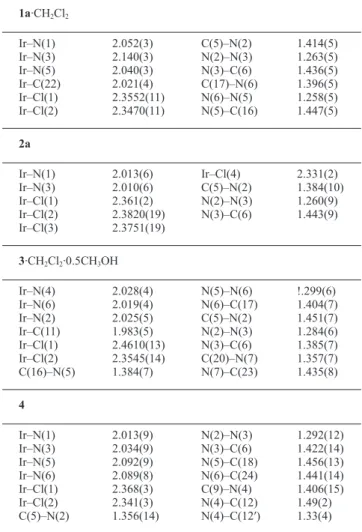
Table 1 Selected bond lengths (Å)
1a·CH2Cl2 Ir–N(1) 2.052(3) C(5)–N(2) 1.414(5) Ir–N(3) 2.140(3) N(2)–N(3) 1.263(5) Ir–N(5) 2.040(3) N(3)–C(6) 1.436(5) Ir–C(22) 2.021(4) C(17)–N(6) 1.396(5) Ir–Cl(1) 2.3552(11) N(6)–N(5) 1.258(5) Ir–Cl(2) 2.3470(11) N(5)–C(16) 1.447(5) 2a Ir–N(1) 2.013(6) Ir–Cl(4) 2.331(2) Ir–N(3) 2.010(6) C(5)–N(2) 1.384(10) Ir–Cl(1) 2.361(2) N(2)–N(3) 1.260(9) Ir–Cl(2) 2.3820(19) N(3)–C(6) 1.443(9) Ir–Cl(3) 2.3751(19) 3·CH2Cl2·0.5CH3OH Ir–N(4) 2.028(4) N(5)–N(6) !.299(6) Ir–N(6) 2.019(4) N(6)–C(17) 1.404(7) Ir–N(2) 2.025(5) C(5)–N(2) 1.451(7) Ir–C(11) 1.983(5) N(2)–N(3) 1.284(6) Ir–Cl(1) 2.4610(13) N(3)–C(6) 1.385(7) Ir–Cl(2) 2.3545(14) C(20)–N(7) 1.357(7) C(16)–N(5) 1.384(7) N(7)–C(23) 1.435(8) 4 Ir–N(1) 2.013(9) N(2)–N(3) 1.292(12) Ir–N(3) 2.034(9) N(3)–C(6) 1.422(14) Ir–N(5) 2.092(9) N(5)–C(18) 1.456(13) Ir–N(6) 2.089(8) N(6)–C(24) 1.441(14) Ir–Cl(1) 2.368(3) C(9)–N(4) 1.406(15) Ir–Cl(2) 2.341(3) N(4)–C(12) 1.49(2) C(5)–N(2) 1.356(14) N(4)–C(12′) 1.33(4)
Fig. 1 ORTEP representation of the molecular complex [IrCl2(L1a
)-(HL1a)] 1a.
It was necessary to examine the NMR‡ of the compounds for further authentication of carbon-bonded structure in 1 since the X-ray data would not permit differentiation of a carbon from a nitrogen atom.
1H NMR of 1. The 1H NMR spectrum of 1a is shown in Fig. 2.
The spectral data of a closely related ruthenium compound,1g,h,17
tcc-RuCl2(HL1a-N,N )2 is used for comparison. In the ruthenium
com-plex, the two HL1a ligands coordinate as neutral HL1a (N,N donor).
Its geometry is trans with respect to two chlorides but is cis with respect to the pyridyl and azo pairs of nitrogens. There exists a two-fold axis of symmetry and the two ligands in the ruthenium complex are equivalent. Thus the spectrum (Fig. S1, ESI†) is simple and showed seven resonances as expected.18 In contrast, the spectrum of
1a is complex and indicates that the two ligands in it are different. With the trans-MCl2 grouping for a [MCl2L2]n+ complex, this can
happen only if the two coordinated ligands are different. Thus the 1H
NMR confirms the different coordination modes of the two ligands in 1a. Moreover, the appearance of two methyl resonances in the 1H
NMR spectrum of 1b (R = Me) (Fig. S1, inset, ESI†) also supports this conclusion. The methyl resonance at 2.53 is assigned to the coordinated C-bonded (L1b, C,N) ligand. The other methyl signal
for normal HL1b (N, N) coordination appears at 2.25, which is
similar18 to that observed in other M–HL1b complexes.
13C NMR of 1. The C-bonded coordination of one of the two
a iridium(V) complex of composition [IrCl4(HL1)]Cl. A survey of
literature indicated that isolable non-organometallic iridium(V) complexes are limited and no X-ray structures are available. Hence there has been interest in the structure of such compounds. We could grow X-ray quality crystals of 2a (HL1 = HL1a) by the
diffu-sion of its acetonitrile solution into toluene. A view of the molecule is shown in Fig. 4. The structural analysis of 2a has confirmed its formulation. The six-coordinate iridium centre in the cationic complex has a distorted octahedral geometry surrounded by four chloride ions and a HL1a ligand. The ligand binds using its normal
N,N-coordination mode. The complex as a whole is monocationic, and the crystallographic asymmetric unit also contains a chloride as a counter anion. It is noticed that the chloride anion is surrounded by four iridium coordinated chlorides with short ClCl contacts (2.74, 2.82, 2.92 and 3.12 Å). This is due to the cation–anion inter-actions. The chelate bite angle, N(1)–Ir–N(3) is 77.9(3)°. The Ir–N lengths in this compound are systematically shorter than those in 1a. This may be attributed to stronger metal–nitrogen interactions due to the higher charge of the central metal ion. The N–N lengths in 2a are 1.258(5) Å signifying the retention of its double bond character in the coordinated ligand.
Fig. 2 1H NMR spectra of (a) [IrCl2(L1a)(HL1a)] 1a in CDCl3 and
(b) [IrCl4(HL1a)]Cl 2a in CD3CN.
spectra of the compounds. The 13C NMR spectrum of 1a consists
of 20 distinct resonances (Fig. 3). The spectrum of 1a is com-pared with that of tcc-RuCl2(HL1a-N,N )2 for identification of the
resonances (Fig. S2, ESI†). In the ruthenium complex there are only 9 resonances, two of which at 122.91 and 128.19 are more intense. We assign these to two overlapping resonances of C8, C11
and C9, C11. Two relatively small intensity resonances at 165.88
and 157.99 are assigned to C2 and C7, respectively. Since there
exists a two-fold axis of symmetry in the ruthenium complex, the two coordinated ligands are equivalent. Consequently, the reso-nances for only one coordinated HL1a (R = H) were observed. In
contrast, the iridium complex lacks any symmetry element. More-over, due to orthometallation, the degeneracy of C8 and C12; C9 and
C11 resonances are lost in the orthometallated [L1a]− ligand. As a
result, in [L1a]− (C,N-coordination) all eleven carbons are dissimilar
and gave rise to 11 signals.
Fig. 4 ORTEP representation of the complex [IrCl4(HL1a)]Cl 2a.
The IR spectrum of each of these complexes (2a, 2b (HL = HL1b)) showed four strong Ir–Cl stretches at 335, 310, 300
and 285 cm−1, indicating the presence of four Ir–Cl bonds. In
addition, the complexes showed all other characteristic stretches of the coordinated HL1 ligand. For example, the NN and CN
vibrations appeared1h near 1385 and 1585 cm−1, respectively.
Like the trivalent iridium complexes (1a and 1b) these are also diamagnetic11 and showed resolved NMR spectra. The 1H NMR
spectrum is simple and indicated the presence of only one HL1
in these complexes (Fig. 2). One of the four pyridyl proton reso-nances of 2a overlapped with the aromatic proton signals.
The 13C NMR spectrum of 2a (Fig. 3) showed 9 resonances
con-firming N,N (neutral) coordination of the ligand HL1a (vide supra).
The above synthetic reactions were attempted in two different types of solvents viz. common alcohols (ethanol and methanol) and acetonitrile. While the reaction proceeded smoothly in alcohols, it did not occur at all in acetonitrile. This indicates that a hydroxylic solvent favors the synthetic reaction. The mechanism of this chemical reaction is complex and we refrain from making any speculation on this aspect.
C. Cyclic voltammetry and absorption spectra of 1 and 2 The free ligand HL1a is known1g to undergo two-step reductions
at −1.31 and −1.57 V. The iridium complexes, 1 and 2 displayed reversible responses at −0.49 and −0.57 V, respectively. These are followed by irreversible cathodic responses that occur at higher cathodic potentials. To have further insight into the nature of orbitals involved during the reduction processes, we recorded
Fig. 3 13C NMR spectra of (a) [IrCl2(L1a)(HL1a)] 1a in CDCl3 and
(b) IrCl4(HL1a)]Cl 2a in CD3CN.
The remaining 9 resonances are from the neutral HL1a
(N,N-coordination). There are five non-hydrogen carbons in 1a, which are absent in the DEPT spectrum. Four of these nonprotonated carbons resonate at the low-field end of the spectrum ( 154.95–167.88) near the chemical shift of the 2- and 7-carbons of tc-RuCl2(HL1a)2.
We assign the fifth nonprotonated carbon, which resonates at
148.31 to C bonded to the iridium metal center. We note here that the chemical shift19 of the carbon of 2,2′-bipyridine bonded to
iridium(III) in [Ir(bpy-N,N )(bpy-C,N )]2+ appears at 139.5.
B. Brown II, 2
A second brown band was eluted with chloroform–acetonitrile (3 : 2) solvent mixture from the crude mixture. Its perchlorate salt can be prepared by the addition of an aqueous NaClO4 solution
to a solution of the chloride salt in acetonitrile. The yield of this product (ca. 25%) is relatively higher than the other product of the same reaction. Compound 2 is a 1 : 1 electrolytic in CH3CN and
ESR spectra of electrogenerated [1a]− and [2a] at 77 K by constant
potential bulk electrolysis of the respective complexes. Each of the above two reduced products showed a symmetric and sharp ESR signal with a ‘g’ value near 2.0, confirming the free radical nature of the reduced species. These results strongly suggest that the unpaired electrons in both [1a]− and [2a] are localized in ligand orbitals.
In addition, the iridium(III) complex, 1 showed an irreversible response with no cathodic counterpart near 1.60 V. The anodic potential response, however, in the case of 2 is reversible and occurs near 1.40 V. With reference to previously reported M–HL1
complexes, the anodic potential response in the iridium(III) com-plexes is assigned as an Ir(III) → Ir(IV) process while that in the iridium(V) complexes is ascribed as an Ir(V) → Ir(VI) couple. We attempted to record the ESR spectrum of the oxidized complex [2a]2+; the oxidized complex was, however, ESR silent. The
colour of the solution of the oxidized complex was brown and showed a reductive wave at 1.40 V. This voltammogram (initial scan cathodic) is superimposable on that of the corresponding complex [2a]+ (initial scan anodic) showing that the redox process
under consideration is chemically reversible. We wish to note here that iridium being a 5d-element, spin–orbit coupling of it is substantial,20 which may be responsible21 for ESR inactivity of
the electrogenerated Ir(VI)-complex. Cyclic voltammograms of representative compounds 1a and 2a are shown as Figs. S3 and S4, respectively (ESI†).
The UV-Vis absorption spectral data in the range 800–300 nm are collected in Table 2. The trivalent complexes 1a and 1b showed an intense absorption band near 350 nm ( of the order of 10 000 M−1 cm−1) with two weak transitions at ca. 450 and ca.
620 nm. Electronic spectra of 1a and 2a are shown in Fig. 5. Visible range transitions in the iridium(III) complexes may be attributed22
to metal to ligand charge transfer. Since the two chelating ligands are different, multiple charge transfer transitions in 1 are as expected. The spectra of the iridium(V) complexes consisted of a weak absorption (, 650 M−1 cm−1) near 750 nm, and a strong
absorption (, 3520 M−1 cm−1) near 505 nm. In addition, multiple
charge transfer transitions occur in the UV-region (<350 nm), which are ascribed as ligand based transitions. The strong absorp-tion near 505 nm is due to allowed metal to ligand charge transfer, while the weak transition near 750 nm may be due to a spin for-bidden transition within the t24-orbitals. Notably, electrochemical
behavior of these complexes also supports the assignment of the MLCT transition. We further note here that low energy weak bands were noted before20 in Cs[IrF6].
D. Amination reactions and products
To examine the amination reaction6 of coordinated
2-(phenylazo)pyridine two representative iridium complexes, viz. 1a
and 2a were reacted with neat PhNH2. The initial brown solution
of 1a in PhNH2 was heated at 120 °C on an oil-bath for an hour.
The mixture gradually became blue–violet. The crude product, after initial work up, was purified by repeated crystallization from a dichloromethane–hexane solvent mixture. A dark crystalline com-pound (3) was isolated in 50% yield. Suitable X-ray quality crystals of it were obtained by diffusion of a dichloromethane solution of 3 into heptane. The structure analysis of 3 has revealed the fusion of PhNH2 to the para-carbon of the coordinated neutral HL1a ligand
(N,N-donor). The asymmetric unit contains a molecule of complex, 3, a disordered dichloromethane molecule and half a disordered methanol molecule, which is located at a center of inversion; O1 and C30 are at the same position with half occupancy. Notably, the second ligand viz. ortho-metallated [L1a]− (C,N-donor) remains
unaffected (Scheme 1). Fig. 6 shows the ORTEP and atom number-ing scheme for the product 3. Para-fusion of PhNH2 in this case
seems reasonable since there was no dissociation of any ligand during the course of the reaction. It has been shown before6b that
availability of vacant or labile coordination site(s) at the metal centre is an essential prerequisite for an ortho fusion reaction at the phenyl ring of HL1. Furthermore, we wish to note that the above
fusion reaction is associated with geometrical isomerization of the compound. Thus the two chlorides in 3 are cis and the orthometal-lated carbon (C(11)) bonded to iridium is trans to a chloride ligand (Cl(1)). As a consequence, the Ir–Cl(1) bond (2.4610(13) Å) is appreciably elongated relative to the other Ir–Cl(2) (2.3545(14) Å) length due to a strong trans effect.
Similar amination reaction of the iridium(V) complex, 2a is sluggish and occurs only at a higher temperature (140 °C), after 2 h, Table 2 Spectral and electrochemical data
Cyclic voltammetry c
IR(KBr) (/cm−1) Oxidn. Redn.
Compound CC + CN NN Ir–Cl Abs.a [max/nm (/M−1 cm−1)] E1⁄2/V (Ep/mV)d E1⁄2/V (Ep/mV)d
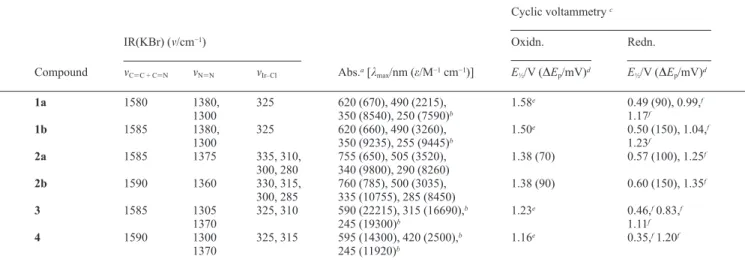
1a 1580 1380, 325 620 (670), 490 (2215), 1.58e 0.49 (90), 0.99,f 1300 350 (8540), 250 (7590)b 1.17f 1b 1585 1380, 325 620 (660), 490 (3260), 1.50e 0.50 (150), 1.04,f 1300 350 (9235), 255 (9445)b 1.23f 2a 1585 1375 335, 310, 755 (650), 505 (3520), 1.38 (70) 0.57 (100), 1.25f 300, 280 340 (9800), 290 (8260) 2b 1590 1360 330, 315, 760 (785), 500 (3035), 1.38 (90) 0.60 (150), 1.35f 300, 285 335 (10755), 285 (8450) 3 1585 1305 325, 310 590 (22215), 315 (16690),b 1.23e 0.46,f 0.83,f 1370 245 (19300)b 1.11f 4 1590 1300 325, 315 595 (14300), 420 (2500),b 1.16e 0.35,f 1.20f 1370 245 (11920)b
a Solvent, CH3CN. b Shoulder. c Conditions: solvent CH3CN; supporting electrolyte NEt4ClO4 (0.1 M); working electrode, platinum; reference electrode,
SCE; solute concentration, ca. 10−3 M; scan rate, 50 mV s−1. d E1⁄2 = 1⁄2(Epa + Epc); Ep = (Epa − Epc). e Irreversible value corresponds to Epa. f Irreversible value
corresponds to Epc.
Fig. 5 Electronic absorption spectra for 1a (− − −), 2a (—), 3 (− · −) and
a blue mixture was obtained that contained several overlapping blue bands in the TLC plate. Only one major band could be isolated so far from an alumina TLC plate in 20% yield. The resultant compound, 4 was finally obtained as a crystalline chloride salt by slow diffu-sion of its acetonitrile solution into toluene. The X-ray structure of 4 revealed that the aromatic amine fusion reaction occurred at the
para carbon of the pendent phenyl ring of the coordinated HL1a
ligand. This organic transformation is associated with substitution of two Cl− by two PhNH2 groups. In this reaction the starting metal
ion, Ir(V) underwent two-electron reduction to yield an Ir(III) sys-tem. A view of the molecule is shown in Fig. 7. In it, the iridium(III) center is surrounded in a distorted-octahedral coordination environ-ment by two cis-chloride ligands, two trans PhNH2 and an extended
N,N donor formed due to para fusion of PhNH2 at the coordinated
HL1a ligand, in 2a. The complex as a whole is monocationic and
the crystallographic asymmetric unit also contains one chloride as a counter ion. The phenyl ring bonded to N(4) is disordered. In this compound, the Ir–N bond lengths of the neutral chelate viz. Ir–N(1) and Ir–N(3) are shorter than the other two Ir–N bonds. A similar trend was noted23 before in a mixed ligand ruthenium(II) complex
[Ru(PhNH2)2Cl2(diim)]. In fact, the Ir–N(5) and Ir–N(6) lengths
in the present iridium complex are similar to the Ru–N(PhNH2)
Scheme 1
Fig. 6 ORTEP representation of the molecular complex [IrCl2(L1a
)-(HL2)] 3.
Fig. 7 ORTEP representation of the complex [IrCl2(HL2)(PhNH2)2]Cl 4.
lengths in the above noted ruthenium complex. It is believed that prior para-amination of coordinated HL1a ligand in the pentavalent
iridium complex is followed by chloride substitution and reduction of the intermediate complex.
The positive ion FAB mass spectra of the two compounds 3 and 4 showed a peak at m/z 684 and 723, respectively. These complexes are diamagnetic (IrIII, t26). While the cationic complex 4 is a 1 : 1
electrolyte, complex 3 is a non-electrolyte in CH3CN. Both of
them showed complex 1H NMR spectra with overlapping of proton
signals. Like all other complexes of 2-[(4-(arylamino)phenyl)azo]-pyridine, HL2, these iridium complexes are also blue and their
electronic spectra are dominated6a,b by intense transition(s) in the
range 590–620 nm (Fig. 5). This transition(s) is (are) ascribed as intra-ligand charge transfer from the amine donor to the azo acceptor function.
E. Conclusion
The isolation and characterization of two ortho-metallated com-plexes of iridium(III) along with two rare examples of iridium(V) complexes are one of the main issues of this report. The normal coordination mode of the ligand, 2-(arylazo)pyridine (HL1) is
neutral (N,N); C,N-coordination as in the present iridium(III) complexes, has not been observed previously. In the C,N-coor-dination mode, the ligand binds as an anionic ligand, [L1]− and
its two nitrogens (a pyridyl and an azo nitrogen) remain unused. Hence, it may be anticipated24 that like azobispyridine (abpy), the
ligand [L1]− is potentially a bridging ligand. Aromatic ring
amina-tion of the coordinated ligand in these iridium systems yielded intense blue complexes. Notably, the resultant para-aminated ligand in compounds 3 and 4 bears an uncoordinated donor amine function, which is separated from the coordinated acceptor azo-function by a conjugated spacer. Low energy transitions in these systems originate due to intra-ligand charge excitation. Examples of such systems are scarce in the literature. Our work in this area is ongoing; some of these systems might turn out to be useful photoactive materials.6b
Experimental
Materials
IrCl3·xH2O was obtained from Arora Matthey and was digested
twice with concentrated HCl before use. Solvents and chemicals used for syntheses were of analytical grade and used as received. Supporting electrolyte (TEAP) and solvents for electrochemical work were obtained as before.2c 2-(Arylazo)pyridines were
pre-pared following the reported procedure.25
Physical measurements
A Shimadzu UV2100 UV/VIS spectrophotometer was used to record electronic spectra. The IR spectra were recorded with a Perkin-Elmer 783 spectrophotometer. A Perkin-Elmer 240 C elemental analyzer was used for microanalyses. 1H and 13C NMR
Electrochemical measurements were performed under a dry nitrogen atmosphere on a PAR 370–4 electrochemistry system. All potentials in this work are referenced to the saturated calomel electrode (SCE) and are uncorrected for junction contribution. The value for the ferrocenium–ferrocene couple under our experimental conditions was 0.42 V.
Syntheses of [IrCl2(L1a)(HL1a)] 1a and [IrCl4(HL1a)]Cl 2a
100 mg (0.28 mmol) IrCl3·3H2O and 110 mg (0.60 mmol)
2-(phenylazo)pyridine were taken in 100 ml methanol. The mixture was refluxed on a steam bath. The yellowish-brown colour of the mixture slowly became dark brown. The reflux was continued for 4 h and then the mixture was cooled and filtered. The brown fil-trate was evaporated to dryness. The crude residue was extracted with dichloromethane. The extract, which contained mainly the compound 1a, was further purified on a preparative TLC (silica gel) plate using chloroform as eluent. A yellowish band of un-reacted 2-(phenylazo)pyridine moved first followed by a major brown band of compound 1a, which was collected and recrystal-lized from a dichloromethane–hexane mixture. A few minor and overlapping brown bands were observed in the plate and could not be purified.
The residue from the dichloromethane extract was dissolved in acetonitrile and loaded on a TLC (silica gel) plate and was eluted with a 3 : 2 chloroform–acetonitrile mixture. A major reddish brown band was collected and recrystallized from acetonitrile–toluene. Some minor overlapping brown and pink bands were observed near the spot, which however could not be isolated. Yields and analyses of 1a and 2a are as follows:
1a. Yield: 41 mg, 20%. Anal. Calc. for C22H17N6Cl2Ir: C, 42.04;
H, 2.73; N, 13.37. Found: C, 42.16; H, 2.76; N, 13.42%. 13C NMR
(CDCl3): 167.88, 166.89, 161.49, 154.95, 151.73, 148.74, 148.31,
141.75, 137.04, 132.71, 132.30, 132.07, 131.43, 128.73, 128.29, 126.92, 125.75, 124.63, 122.85, 118.78. MS: m/z: 629 [M]+
2a. Yield: 40 mg. 25%. Anal. Calc. for C11H9N3Cl5Ir: C, 23.90;
H, 1.64; N, 7.60. Found: C, 23.98; H, 1.62; N, 7.73%. 13C NMR
(CD3CN): 150.31, 142.11, 132.24, 128.07, 126.75, 126.21,
126.11, 117.66 (2 C). MS: m/z: 517 [M − Cl−]+
The compounds 1b and 2b were synthesized similarly follow-ing the above procedure usfollow-ing 2-(m-tolylazo)pyridine in place of 2-(phenylazo)pyridine.
1b. Yield: 18%. Anal. Calc. for C24H21N6Cl2Ir: C, 43.90; H, 3.22;
N, 12.80. Found: C, 43.83; H, 3.15; N, 13.92%. 13C NMR (CDCl3):
168.29, 167.46, 161.89, 155.66, 152.06, 149.07, 144.46, 142.06,
139.35, 137.39, 135.86, 133.72, 133.13, 132.83, 129.02, 128.44, 127.28, 127.20, 124.76, 123.89, 120.35, 118.75, 21.68, 20.99.
2b. Yield: 22%, Anal. Calc. for C12H11N3Cl5Ir: C, 25.89; H, 1.99;
N, 7.55. Found: C, 25.82; H, 2.03; N, 7.51%. 13C NMR (DMSO-d6):
171.90, 154.58, 150.72, 142.44, 137.81, 133.17, 128.03, 126.79, 126.65, 126.11, 124.59, 21.72.
Amination reactions
A. Synthesis of [IrCl2(L1a)(HL2)] 3. A mixture of
[IrCl2(L1a)(HL1a)] (100 mg, 0.12 mmol) and PhNH2 (0.5 ml) was
heated on an oil-bath at 120 °C for 1 h. The initial brown colour of the mixture gradually became dull violet. The mixture was cooled and washed thoroughly with diethyl ether several times. Further purification was made by repeated recrystallization of the crude mass from a dichloromethane–hexane mixture. Finally the product was purified by slow diffusion of a dichloromethane solution of the compound into hexane.
Yield: 57 mg, 50%. Anal. Calc. for C29.5H26N7Cl4O0.5Ir : C, 43.18;
H, 3.19; N, 11.95. Found: C, 42.65; H, 3.49; N, 11.35%. MS: m/z: 684 [M − Cl−]+.
B. Synthesis of [IrCl2(HL2)(PhNH2)2]Cl 4. A mixture of
[IrCl4(HL1a)]Cl (100 mg, 0.13 mmol) and PhNH2 (0.5 ml) was
heated at 140 °C on an oil-bath for 2 h. The resultant greenish-blue mixture was cooled and washed with diethyl ether several times. The crude mass was then purified on a preparative TLC (neutral alumina) plate using a 1 : 1 chloroform–acetonitrile mixture as the eluent. A major bright blue band was collected and other minor blue and brown bands were discarded. The blue compound was recrys-tallized from an acetonitrile–toluene solvent mixture.
Yield: 27 mg, 20%. Anal. Calc. for C29H28N6Cl3Ir: C, 45.88; H,
3.72; N, 11.07. Found: C, 45.67; H, 3.75; N, 11.25. MS: m/z: 723 [M − Cl−]+.
Crystallography
Suitable X-ray quality crystals of 1a were obtained by slow diffusion of a dichloromethane solution of the compound into hexane while those of 3 were obtained by slow diffusion of a dichloromethane solution of the compound into heptane. Suitable X-ray quality crystals of 2a and 4 were grown by slow diffusion of an acetonitrile solution of the respective compounds into toluene. Intensity data for the above compounds 1a, 2a, 3 and 4 were measured on a Bruker SMART diffractometer (Mo-K radiation, = 0.71073 Å) and data were corrected for Lorentz-polarisation effects. The structures were solved by employing the SHELXS-9726 program package and
re-Table 3 Crystallographic data
1a·CH2Cl2 2a 3·CH2Cl2·0.5CH3OH 4
Empirical formula C23H19Cl4N6Ir C11H9Cl5N3Ir C29.50H26Cl4N7O0.50Ir C29H28Cl3N6Ir
M 713.44 552.66 820.57 759.12
T/K 295(2) 295(2) 150(1) 150(1)
Crystal system Triclinic Orthorhombic Triclinic Monoclinic
Space group P1 Pca21 P1 P21/c
a/Å 10.6393(5) 13.1574(5) 10.4245(5) 14.3247(7) b/Å 11.0054(5) 16.6804(6) 10.9234(5) 8.5842(4) c/Å 12.3368(6) 7.1069(3) 13.0744(6) 23.3471(11) /° 102.928(1) 90 95.667(1) 90 /° 113.200(1) 90 92.225(1) 103.431(1) /° 97.590(1) 90 91.641(1) 90 V/Å3 1254.34(10) 1559.76(10) 1479.61(12) 2792.4(2) Dc/Mg m−3 1.889 2.353 1.842 1.806 Z 2 4 2 4 Cryst. dimens./mm 0.36 × 0.20 × 0.05 0.50 × 0.10 × 0.06 0.30 × 0.10 × 0.06 0.33 × 0.12 × 0.02 GOF 1.019 1.131 1.071 1.303 Reflections collected 16229 14933 17193 20774 Unique reflections 5736 3565 6772 6405 Rinal R indices R1 = 0.0315 R1 = 0.0286 R1 = 0.0378 R1 = 0.0802 wR2 = 0.0639 wR2 = 0.0798 wR2 = 0.0912 wR2 = 0.1596
fined by full-matrix least squares based on F 2 (SHELXL-97).27 All
the hydrogen atoms were added in the calculated positions. All the relevant data are given in Table 3.
CCDC reference numbers 238601–238604.
See http://www.rsc.org/suppdata/dt/b4/b407209j/ for crystallo-graphic data in CIF or other electronic format.
Acknowledgements
Financial support received from the Department of Science and Technology, New Delhi is gratefully acknowledged. M. P. and C. D. are thankful to the Council of Scientific and Industrial Research, New Delhi for their fellowships.
References
1 (a) M. Kakoti, A. K. Deb and S. Goswami, Inorg. Chem., 1992, 31, 1302; (b) A. K. Deb, M. Kakoti and S. Goswami, J. Chem. Soc., Dalton Trans., 1991, 3249; (c) M. N. Ackermann, C. R. Barton, C. J. Deodene, E. M. Specht, S. C. Keill, W. E. Schreiber and H. Kim, Inorg. Chem., 1989, 28, 397; (d) V. Ferreira and R. A. Krause, Inorg. Chim. Acta, 1988, 145, 29; (e) B. K. Ghosh, A. Mukhopadhyay, S. Goswami, S. Ray and A. Chakravorty, Inorg. Chem., 1984, 23, 4633; (f) D. Datta and A. Chakravorty, Inorg. Chem., 1983, 22, 1085; (g) S. Goswami, A. R. Chakravarty and A. Chakravorty, Inorg. Chem., 1981, 20, 2246; (h) R. A. Krause and K. Krause, Inorg. Chem., 1980, 19, 2600. 2 (a) P. Ghosh, A. Pramanik, N. Bag and A. Chakravorty, J. Chem.
Soc., Dalton Trans., 1992, 1883; (b) G. K. Lahiri, S. Bhattacharya, S. Goswami and A. Chakravorty, J. Chem. Soc., Dalton Trans., 1990, 561; (c) B. K. Ghosh and A. Chakravorty, Coord. Chem. Rev., 1989,
95, 239; (d) S. Wolfang, T. C. Strekas, H. D. Gafney, A. R. Krause
and K. Krause, Inorg. Chem., 1984, 23, 2650; (e) S. Goswami, R. N. Mukherjee and A. Chakravorty, Inorg. Chem., 1983, 22, 2825; (f) S. Goswami, A. R. Chakravarty and A. Chakravorty, Inorg. Chem., 1983, 22, 602.
3 (a) A. K. Ghosh, P. Majumdar, L. R. Falvello, G. Mostafa and S. Goswami, Organometallics, 1999, 18, 5086; (b) G. K. Lahiri, S. Goswami, L. R. Falvello and A. Chakravorty, Inorg. Chem., 1987,
26, 3365; (c) S. Goswami, A. R. Chakravarty and A. Chakravorty,
J. Chem. Soc., Chem. Commun., 1982, 1288; (d) S. Goswami, A. R. Chakravarty and A. Chakravorty, Inorg. Chem., 1982, 21, 2737. 4 P. Bandyopadhyay, D. Bandyopadhyay, A. Chakravorty, F. A. Cotton,
L. R. Falvello and S. Han, J. Am. Chem. Soc., 1983, 105, 6327. 5 B. K. Santra, G. A. Thakur, P. Ghosh, A. Pramanik and G. K. Lahiri,
Inorg. Chem., 1996, 35, 3050.
6 (a) C. Das, A. Saha, C.-H. Hung, G.-H. Lee, S.-M. Peng and S. Goswami, Inorg. Chem., 2003, 42, 198; (b) C. Das, A. K. Ghosh, C.-H. Hung, S.-M. Peng, G.-H. Lee and S. Goswami, Inorg. Chem., 2002, 41, 7125; (c) K. K. Kamar, A. Saha, C.-H. Hung, A. Castiñeiras and S. Goswami, Inorg. Chem., 2002, 41, 4531; (d) A. Saha, P. Majumdar, S.-M. Peng and S. Goswami, Eur. J. Inorg. Chem., 2000, 2631; (e) A. Saha, P. Majumdar and S. Goswami, J. Chem. Soc., Dalton Trans., 2000, 1703; (f) A. Saha, A. K. Ghosh, P. Majumdar, K. N. Mitra, S. Mondal, K. K. Rajak, L. R. Falvello and S. Goswami, Organo-metallics, 1999, 18, 3772.
7 B. Divisia-Blohorn and G. Kyriakakon, J. Org. Mass Spectrom., 1985,
20, 463.
8 M. Shivakumar, J. Gangopadhyay and A. Chakravorty, Polyhedron, 2001, 20, 2089.
9 J. J. Robertson, A. Kadziola, R. A. Krause and S. Larsen, Inorg. Chem., 1989, 28, 2097.
10 L. J. Yellowlees and K. G. MaCnamara, in Comprehensive Coordina-tion Chemistry, ed. D. E. Fenton, J. A. McCleverty and T. J. Meyer, Pergamon Press, Oxford, 2004, ch. 6.2, pp. 147–246.
11 (a) W. H. Bernskoetter, E. Lobkovsky and P. J. Chirik, J. Chem. Soc., Chem. Commun., 2004, 764; (b) C. E. Webster and M. B. Hall, Coord. Chem. Rev., 2003, 238–239, 315; (c) E. G. Puebla, A. Monge, M. Paneque, M. L. Poveda, S. Taboada, M. Trujillo and E. Carmona, J. Am. Chem. Soc., 1999, 121, 346; (d) R. S. H. Motherwell and G. Wilkinson, Polyhedron, 1993, 12, 2009; (e) R. S. H. Motherwell, G. Wilkinson, B. H. Bates and M. B. Hursthouse, J. Chem. Soc., Dalton Trans., 1992, 3477; (f) C. E. Housecroft, Coord. Chem. Rev., 1992, 115, 163; (g) P. J. Steel, Coord. Chem. Rev., 1990, 106, 227; (h) K. Isobe, P. M. Bailey and P. M. Maitlis, J. Chem. Soc., Chem. Commun., 1981, 808.
12 M. A. Hepworth, P. L. Robinson and G. J. Westland, J. Chem. Soc., 1954, 4269.
13 (a) S. R. Klei, T. D. Tilley and R. G. Bergman, J. Am. Chem. Soc., 2000, 122, 1816; (b) E. G. Puebla, A. Monge, M. C. Nicasio, P. J. Pérez, M. L. Poveda and E. Carmona, Chem. Eur. J., 1998, 4, 2225.
14 (a) K. K. W. Lo, C.-K. Chung and N. Zhu, Chem. Eur. J., 2003, 9, 475; (b) M. C. DeRosa, P. J. Mosher, G. P. A. Yap, K.-S. Focsaneanu, R. J. Crutchley and C. E. B. Evans, Inorg. Chem., 2003, 42, 4864; (c) A. A. Danopoulos, S. Winston and M. B. Hursthouse, J. Chem. Soc., Dalton Trans., 2002, 3090; (d) E. C. Constable, Coord. Chem. Rev., 1990, 98, 251; (e) P. Didier, I. Ortmans and A. K. De Mesmaeker, Inorg. Chem., 1993, 32, 5239; (f) S. Sprouse, K. A. King, P. J. Spellane and R. J. Watts, Inorg. Chem., 1984, 23, 3423; (g) S. Dholakia, R. D. Gillard and F. L. Wimmer, Inorg. Chim. Acta, 1983, 63, 179; (h) W. A. Wickramasinghe, P. H. Bird and N. Serpone, J. Chem. Soc., Chem. Commun., 1981, 1284.
15 G. Mord, A. C. Hazell, R. G. Hazell and O. Farver, Inorg. Chem., 1983,
22, 3429.
16 A. Saha, C. Das and S. Goswami, Indian J. Chem., Sect. A, 2001, 40, 198.
17 A. H. Velders, H. Kooijman, A. L. Spek, J. G. Haasnoot, D. d. Vos and J. Reedijk, Inorg. Chem., 2000, 39, 2966.
18 A. K. Mahapatra, B. K. Ghosh, S. Goswami and A. Chakravorty, J. Indian Chem. Soc., 1986, 63, 101.
19 P. J. Spellane, R. J. Watts and C. J. Curtis, Inorg. Chem., 1983, 22, 4060.
20 G. C. Allen, G. A. M. El-Sharkawy and K. D. Warren, Inorg. Chem., 1972, 11, 51.
21 (a) A. Das, F. Basuli, L. R. Falvello and S. Bhattacharya, Inorg. Chem., 2001, 40, 4085; (b) Z. Shirin and R. N. Mukherjee, Polyhedron, 1992,
11, 2625.
22 (a) K. K.-W. Lo, C.-K. Chung, T.-K. M. Lee, L.-H. Lui, K. H.-K. Tsang and N. Zhu, Inorg. Chem., 2003, 42, 6886; (b) R. Acharyya, F. Basuli, R.-Z. Wang, T. C. W. Mak and S. Bhattacharya, Inorg. Chem., 2004,
43, 704.
23 K. N. Mitra, P. Majumdar, S.-M. Peng, A. Castiñeiras and S. Goswami, Chem. Commun., 1997, 1267.
24 M. Krejik, S. Záliš, J. Klima, D. Skora, W. Matheis, A. Klein and W. Kaim, Inorg. Chem., 1993, 32, 3362.
25 N. Campbell, A. W. Henderson and D. J. Taylor, J. Chem. Soc., 1953, 1281.
26 G. M. Sheldrick, Acta Crystallogr., Sect. A., 1990, 46, 467.
27 G. M. Sheldrick, SHELXL97, program for the Refinement of Crystal Structures, University of Göttingen; Göttingen, Germany, 1997.
![Fig. 4 ORTEP representation of the complex [IrCl 4 (HL 1a )]Cl 2a.](https://thumb-ap.123doks.com/thumbv2/9libinfo/8666968.195595/3.918.498.806.431.714/fig-ortep-representation-complex-ircl-hl-a-cl.webp)
![Fig. 7 ORTEP representation of the complex [IrCl 2 (HL 2 )(PhNH 2 ) 2 ]Cl 4.](https://thumb-ap.123doks.com/thumbv2/9libinfo/8666968.195595/5.918.86.437.82.803/fig-ortep-representation-complex-ircl-hl-phnh-cl.webp)
