Modeling IT relationship quality and its determinants: A potential
perspective of network externalities in e-service
Chieh-Peng Lin
a, Yuan Hui Tsai
b, Yi-Ju Wang
b,c, Chou-Kang Chiu
d,⁎
a
Institute of Business and Management, National Chiao Tung University, Taipei, Taiwan, R.O.C.
bDepartment of Finance, Chihlee Institute of Technology, Banciao City, Taipei County, Taiwan, R.O.C. cNankai University, Tianjin, China
d
Graduate Institute of Business Administration, National TaiChung University of Education, TaiChung, Taiwan, R.O.C.
a r t i c l e i n f o
a b s t r a c t
Article history: Received 10 June 2009
Received in revised form 7 March 2010 Accepted 9 April 2010
This article addresses the development of relationship quality in the service context of information technology (IT) based on the network externalities theory. The model predicates the IT relationship quality is influenced by both synchronization value and autarky value, whereby autarky value is influenced by the availability of complementary goods. At the same time, synchronization value is influenced by relationship commitment and perceived critical mass, while availability of complementary goods is influenced by perceived compatibility and overall installed base. Note that the autarky value represents the value generated by the product itself even if there are no other users (e.g., the printing and copying functions of a fax/printer machine), while synchronization value represents individuals’ perceived value obtained through interaction (e.g., chatting functions of Skype). The model is examined using data obtained from employees of different companies in Taiwan. The empiricalfindings and their implications are discussed herein. © 2010 Elsevier Inc. All rights reserved.
Keywords: Network externalities Autarky value Synchronization value Complementary goods 1. Introduction
Electronic commerce represents business activities over electronic systems (e.g., Internet or other computer networks), and such commerce has continued to penetrate the value chains of business organizations. Many business organizations have developed Internet-based initiatives to get more customers and retain them. Particularly, developing direct service to online customers via interactive information technologies (IT) is the dominant e-commerce strategy among information technology (IT) firms[91]. Thesefirms devote a large amount of their investment to IT service (e.g., instant messaging service) and promoting users’ continuous patronage with the service, because the continuance of IT service is crucial to e-commerce firms, such as ISPs (Internet service providers), online retailers, online bankers, online brokerages, online travel agencies, and so on[12]. For example, many online bankers offer discounts on handling charges or provide gift items to retain a continuance of IT users for stock trading. Nevertheless, such a continuance of IT users relies on achieving IT relationship quality[12].
Previous studies have demonstrated the importance of relationship quality and its impact onfirm profitability and customer retention (for example,[17,37,82]), but thefirst step in effectively managing IT relationship quality in the IT service context is by identifying its antecedents. This study identifies the critical determinants of IT relationship quality based on the network externalities theory and also clarifies its importance on Internet-based service. Investigating the meaning of human–computer relationship (e.g., IT relationship quality) and presenting techniques for constructing, maintaining, and evaluating such relationship quality are important to both researchers and practitioners[13]. The overall theory that guides this study and its proposed hypotheses includes network externalities which are positive consumption externalities often seen in a society, whereby the values that users derive from a good or product increase with the number of other users of the same or similar good or product in society.
⁎ Corresponding author. No. 140 Min-Sheng Rd., Taichung, 40302, Taiwan, ROC E-mail address:ckchiu@ntu.edu.tw(C.-K. Chiu).
0040-1625/$– see front matter © 2010 Elsevier Inc. All rights reserved. doi:10.1016/j.techfore.2010.04.015
Contents lists available atScienceDirect
IT relationship quality (e.g., human–computer relationship) evaluates the relationship strength or interaction between IT and its users (e.g.,[36,52]) and also represents the extent to which IT meets the needs and expectations of the users involved based on a history of successful or unsuccessful encounters or experiences[17]. IT relationship quality can be conceptualized as involving users’ trust on specific IT and their satisfaction with the IT. Collectively, IT relationship quality is regarded as a construct comprising at least two components: (1) user trust in the IT service (e.g.,[81]) and (2) user satisfaction with the IT service (e.g.,[17]). Hence, this study assumes that improved IT relationship quality is accompanied by increased IT satisfaction and trust. This study next briefly expands on these two important dimensions of IT relationship quality.
Satisfaction with IT in this study means IT users’ emotional status occurs in response to an assessment of interaction experiences with their IT service [66]. User satisfaction depends directly on managing and monitoring individual service encounters—namely, the periods of direct user interaction with IT service (e.g.,[74]). Trust is usually considered necessary for a successful interactive relationship between IT and its users. More specifically, trust can be viewed as users’ confidence in the reliability and integrity of IT service[64].
This study differs from previous works (e.g.,[62,72]) in two important ways. First, this work focuses on IT relationship quality in an intangible service rather than a tangible one such as clothing store service[85]and electrical appliance store service[61]. Intangibility is often defined in marketing as the inability to evaluate the benefit (or invisible product or service value) obtained from engaging in an activity by using any tangible evidence[87,88]. As consumers or users have more difficulty in evaluating the quality of an intangible service than they do towards physical goods prior to, during, and after consumption[32], it is important that intangible IT service is treated differently from tangible goods provided by, for example, car dealers[62]and food shops[72]. Second, this study empirically examines the causative drivers of network effects in the e-service context. Though some prior studies have employed analytical models to explore such causes (e.g.,[42,68]), most prior empirical studies on network effects rely on secondary or archival data[50]. This study uses primary survey data collected from actual IT users to test the causes and outcomes of network effects. Collectively, it investigates users using an IT service and through an examination of the network externalities theory helps bring about implications for IT providers.
The rest of the paper proceeds as follows. The next section presents the theoretical underpinnings of the network externalities theory and formulates a research framework and hypotheses of IT relationship quality based on the theory. The third section describes the research methods, containing the choice of empirical context, subject sample, and instrumentation for this study. The fourth section presents data analysis procedures and test results. Thefifth section outlines the implications of our findings for future IT usage research and practice and the limitations of this study.
2. Theory of network externalities
Network effects refer to the utility or benefit that a user derives from using a product or service based on the number of other users employing similar or compatible products[41]. The source of this utility (e.g., number of other users) is called a network externality, and products or services exhibiting such effects are called network effects goods[45]. The network externalities show evidence of being important in generating and diffusing technical change[40]. Such externalities are even more pervasive in IT industries, which are subject to drastic technical change.
Although classic instances exist in a social society involving physical networks, such as railroads or telecommunications, network externalities also arise in a society that does not have physical networks, such as a mobile software or wireless sensor network (e.g.,[71]). Network effects goods are unique in that the value of each unit of good increases with the number of units sold. In the case of network effects goods, the demand curve still slopes down, but the entire curve shifts upward with an increasing number of units sold or expected to be sold[22]. Social networking websites are good examples in which the more IT users register onto such websites, the greater the websites’ value is to its registrants [4], consequently strengthening IT relationship quality. Similarly, a survey on purchasing professionals indicates that customers base their evaluation not only on general features (e.g., compatibility), but also on network effects[89].
Katz and Shapiro[41]described two types of network externalities: direct and indirect. There is quite a distinction between direct and indirect network effects. Direct effects occur as an immediate result of participation in a network, while indirect effects are due to an emergence of complimentary products and services[33]. Whereas direct externalities result from the demand side of a network, indirect externalities stem from the supply side. These two types of network externalities are introduced in more detail below.
Direct network externalities are based on the number of participants in a given network. Typical examples include the number of sellers and the number of buyers in an online auction network such as eBay, the number of customers in a given cellular network like Verizon or T-Mobile, the number of gamers on an online gaming website like PartyPoker.com, or the number of Skype users online. As new participants enter these networks, existing users gain more choices for communicating, trading, and playing games, and thereby gain network utility. Direct network effects pertain to how properties of the customer network affect the perceived value of the service[84]. Such direct network effects are applied in both social network theory and industrial economics to explain the“bandwagon effect”: the more existing customers there are for a service, the more attractive the service becomes even for potential customers[26]. Previous literature argues that the adoption of information systems requires the participation of many individuals to create a sense of collective action[54].
Indirect network externalities are ancillary benefits accruing to network participants, such as the development of complementary goods, services, formation of standards, and the lowering of prices as a network grows, but they do not directly result from other network participants. A traditional instance of complementary goods is motor oil and gasoline: if gasoline consumption falls due to a price increase, the consumption of motor oil will fall as well, because motor oil and gasoline are used
together[15]. Complementary goods can be extended to the idea that people seek products with characteristics that are different from and complement their own ones, also known as the idea that opposites attract[5,21,59]. The theory of indirect network effects argues that the availability of a complementary product (or service) affects the perceived value of a networked product (or service). The prototypical example of indirect network effects is how the supply of software and the demand for hardware affect each other positively[84]. For example, the value of a digital music (DM) player counts heavily on the availability of digital music, thus indirect network externalities have a significant influence on customer perceptions of the value of a DM player[78].
Network externalities can be positive or negative. The examples described above are typical for positive network externalities, but sometimes there can also be instances of negative externalities where larger networks may decrease the value of those networks for other users[47]. For instance, with the popularity of iPhone in 2009, AT&T's wireless network is not able to fully support the bandwidth required by millions of their iPhone customers in the U.S. due to network congestion problems. Likewise, more users logging onto a shared ftp site (e.g., to download music or movies) slow down the transmission speed of the site; more homebuyers drive up the cost of homes, making them less affordable to others. While many products/services exhibit negative externality (e.g., highway congestion), positive externalities are unique primarily to IT products and services[42]—that is, with few exceptions most IT products and services are characterized by positive externalities rather than negative ones[50]. Hence, this study focuses on positive externalities, leaving negative externalities as an opportunity for future research.
Among prior empirical research on network externalities, Gandal[27]used econometric modeling on the features and price data of different spreadsheet packages tofind that consumers are willing to pay a significant premium for spreadsheets that are compatible with the Lotus platform. Brynjolfsson and Kemerer [14]observed similar results,finding a positive relationship between the installed base of spreadsheet software and their prices. Studying the adoption of automated teller machines (ATMs) among banks, Saloner and Shepard[70]and Kauffman et al.[43]presented that the timing of ATM adoption among banks is related to the size of their customer base, the expected future size of their customer base, the value of their deposit base, the extent of their service coverage, the number of local branch locations, and the size of their ATM network. Analyzing user contributions in peer-to-peerfile-sharing networks, Asvanund et al.[6]noted that additional users gain value from a network at a decreasing rate while adding costs (e.g., congestion) at an increasing rate, such that there exists an optimal point, beyond which the costs of network adoption will exceed the expected value, negative network effects will emerge, and user participation will decrease.
Though the above research used secondary archival data to generate support for the network externality hypotheses, few research studies have empirically investigated this effect using primary data collected directly from network users[50]. This study attempts to fill this void in network externalities research by using primary data. Furthermore, this study differs from prior research by integrating network externalities within extant models of IT acceptance research in order to build a theoretical model of interactive IT relationship quality. In essence, the effort of this study is geared towards advancing IT relationship quality research by providing an important consideration to network externalities.
Before establishing the research framework and hypotheses in the next section, this study summarizes the research constructs and their definitions inTable 1to help explain our following development of the hypotheses.
2.1. Research framework and development of the hypotheses
Network value is an important motivation for using network IT (e.g., Internet, wireless network, or mobile network). This phenomenon allows, in principle, the value received by IT users to be separated into two distinct parts, including direct and indirect network effects[47,48]. The direct effects, which are called synchronization value, represent the value derived from being able to interact with other users of the product[47,48]based on a perspective of social utility. Accordingly, the indirect network effects, which are labeled the autarky value, are the additional value generated by the product even if there are no other users
[47,48]based on a perspective of technical utility.
The term“autarky” is originally Greek and means “self-sufficiency”[7]. The autarky value represents the value generated by the product itself even if there are no other users (e.g., the printing and copying functions of a fax/printer combo machine)[29,80]. Distinguishing between autarky value and synchronization value helps ITfirms develop their critical product strategies for future business growth (e.g.,[53]). An autarky is often used to express an economy that is self-sufficient and does not participate in any
Table 1
Research constructs and their definitions. Research construct Definition
Synchronization value The value perceived by individuals through the interaction with others using the same product. Autarky value The value generated by individuals using the product itself even if there are no other users.
Relationship commitment The psychological and emotional attachment to a relationship between individuals and their specific friends or relatives. Perceived critical mass Individuals’ perception about a small segment of the population that chooses to make big contributions to a collective action. Availability of
complementary goods
The accessibility of the products with characteristics that complement the individuals’ product
Perceived compatibility The degree to which a specific product is perceived as being consistent with the existing values, needs, and past experiences of potential adopters during the interaction between the adopters and their product.
Overall installed base The overall number of used units of a particular product in the entire market or a product segment.
IT relationship quality The relationship strength or interaction between IT and its users and represents the extent to which the IT meets the needs and expectations of the users involved based on a history of successful or unsuccessful encounters or experiences.
international trade with others, or strictly limits trade with the outside world[38]. Likewise, the term refers to a social system that relies heavily on its own resources. Autarky value represents individuals’ perceived value obtained without their social interaction with others (that is, to experience a product's benefit solely by themselves), whereas synchronization value represents the individuals’ perceived value obtained through interaction (that is, to get no benefit without others). A typical example of synchronization value for users in instant messaging is that they experience joyful text chats with others online, whereas a typical example of autarky value for users is that they experience interesting video games disregarding their social interactions with others.
Empirical studies by Gandal [27] and Brynjolfsson and Kemerer [14] demonstrated that users who are satisfied with spreadsheets are willing to pay a higher price for spreadsheets with a larger number of participants such as Lotus (e.g., direct network effects), or those having great compatibility with Lotus (e.g., indirect network effects). This phenomenon suggests that those who turn to a specific IT service due to their satisfaction with and trust on the IT service are likely driven by synchronization value and autarky value. More specifically, the more IT users are able to interact with other users by using the same IT (i.e., synchronization value), the better the satisfaction and trust towards the IT they will have, leading to stronger IT relationship quality. Accordingly, the more fringe benefits that are generated by using specific IT without social interaction with others (i.e., autarky value), the better the satisfaction and trust they will obtain towards the IT, resulting in stronger IT relationship quality and implying a positive influence of autarky value on relationship quality.
Specific IT that helps users establish interpersonal ties with other people is likely to achieve emotional, instrumental, and informational communication (e.g., a form of synchronization value) for the users and thus can be a source of satisfaction[19]. Emmers-Sommer [23] tracked research subjects’ assessments of communication quality and quantity (e.g., a form of synchronization value) within either romantic relationships or friendships and found that both indicators (aggregated across 1 week) independently predict relationship satisfaction[19], suggesting the potential influence of synchronization value on relationship quality. Consequently, this expectation leads to the next hypotheses.
H1. The synchronization value perceived by IT users is positively related to IT relationship quality. H2. The autarky value perceived by IT users is positively related to IT relationship quality.
Relationship commitment can be seen as an individual's intrinsic motivation that boosts the expected persistence in a supportive relationship with others[2]. Network IT provides virtually a social system for online users to develop their social relationships with online others. Thus, relationship commitment should be effectively taken into practice in the service context of network IT.
Relationship commitment indicates a psychological and emotional attachment to a relationship between individuals and their specific friends or relatives[69]. The popularity of network IT provides confirming evidence that the expected communication of maintaining interpersonal relationships drives users’ satisfaction and trust towards the IT service (e.g.,[52,73,77]), implying a critical role of relationship commitment in network IT. More specifically, because one's relationship with others is the foundation of social interaction[45], the commitment to maintaining the relationship is fundamental to the synchronization value that the IT users care so much about. To put it differently, the network IT is helpful particularly for users with a high commitment to cultivating relationships with friends or relatives, leading to a strong synchronization value of the IT perceived by the users. Thus, the hypothesis is stated as below.
H3. The relationship commitment of IT users is positively related to the synchronization value perceived by the users.
The importance of perceived critical mass has been indicated in previous research in that users may use IT according to a subjective perception of the critical number of current IT users in the market [54]. Significantly applied to the diffusion of interactive communication media, perceived critical mass reflects individuals’ perception about a small segment of the population that chooses to make big contributions to a collective action[63]. Perceived critical mass is particularly important to network IT, because IT often requires social interdependence collectively between two or more users simultaneously [46], suggesting a positive relationship between perceived critical mass and synchronization value perceived by the users.
IT users often base their affections on how many of their friends, colleagues, or others in their social circle use a specific target IT, because this perceived critical group defines the universe of users with whom they can interact with while using the IT[47]. A case in point is Skype, which is an Internet telephony software allowing users to talk to other Skype users anywhere in the world without using expensive telephone connections, simply by using their computer and an Internet connection. Naturally, the attractiveness of Skype to a given user increases as more friends and acquaintances (i.e., the critical mass) adopt and use this software. In our particular instance, the larger a given user's perceived critical mass is, the more synchronization value she experiences from the IT, and consequently the greater is her motivation to use the IT. Hence, we propose the next hypothesis.
H4. The perceived critical mass of IT users is positively related to the synchronization value perceived by the users.
The availability of complementary goods for IT users is extended to the idea of the accessibility of products with characteristics that complement users’ IT[5,21,59], enhancing the value of IT usage in which social interaction is not required (i.e., autarky value). Many IT products are heavily affected by the availability of complementary goods or services that enhance the value of the product. In many cases, the lack of sufficient availability of complementary products impedes the success of a product [11]. Complementary relationships often arise in consumer IT products. For instance, the supply for online video games is highly dependent upon the availability of video-game websites—that is, with more video-game websites available on the Internet, it is more likely that consumers
are able to obtain more online video games (i.e., the value increases). Many technologies are not desirable to customers without an associated set of complementary goods such as software for computers and memory cards for digital cameras, weakening their autarky value. Indirect network externalities are those that result from the availability of complementary goods and services that enhance users’ benefit from being a part of the network. In other words, indirect network externalities that generate autarky value are ancillary benefits particularly due to the development of complementary services.
More and more complementary goods that are available for a specific target IT means that people who use the IT are likely to upgrade the functions of the IT easily by, for example, paying an inexpensive fee for complementary goods due to economies of scale, suggesting higher autarky value. Though indirect network externalities (i.e., autarky value) are commonly expected for network effects, goods such as online reservation systems and online auctions, many non-network and/or physical goods such as automobiles, videocassette recorders, and computer software still experience indirect network externalities in the form of complementary services, product standardization, and so forth. For example, Apple and Google have traditionally operated at different and complementary parts of the value chain in which Google's Android recently works to match iPhone Store's mobile software market[57].
The theory of network externalities suggests that the availability of complementary products ultimately influences users’ perceptual benefit (or productivity benefit) from using interactive IT such as e-mail systems and online video games, and even many non-network IT such as operating systems and spreadsheets[75]. This further implies that the availability of complementary goods may affect users’ perceived autarky value. Given that the autarky value represents the technical value generated by the service or product even without other users for mutual interaction[47,48], the availability of complementary goods that increase technical value is thus positively related with the autarky value of IT users. Specifically, a given user's IT usage depends heavily on the extent to which the user perceives the IT as having complementary goods, suggesting the importance of the availability of complementary goods. Users that perceive a given IT as having a higher available level of complementary goods and services generate greater network benefit from that complementarity than those who perceive it as being less complementary. This expectation leads to our next hypothesis. H5. The availability of complementary goods for IT users is positively related to the autarky value perceived by the users.
Compatibility (e.g., interpersonal compatibility, compatibility between personality attitudes) is a concept that describes the long-term interaction between two or more subjects in terms of the ease and comfort of communication[1]. In this study, perceived compatibility refers to the degree to which a specific IT is perceived as being consistent with the existing values, needs, and past experiences of potential adopters during the interaction between the adopters and their IT[58]. When the compatibility is perceived strongly by many users in the market, it is likely that the invention and supply of complementary goods are driven by a large user demand, suggesting a positive relationship between perceived compatibility and the availability of complementary goods. Previous research indicates that IT users’ benefits may increase with the number of users of the same good when compatibility is important[71], implying the importance of perceived compatibility as an antecedent variable. Examples include the compatibility of memory cards with digital cameras and the compatibility of existing computerfiles with new software.
The proliferation of an incompatible product or service to users may prove detrimental, however, because it will likely cut up the market and create uncertainty among product or service providers[86]. Without IT compatibility, users of network IT may be discouraged and may not achieve economies of scale, leading to a low availability of complementary goods. Consequently, this hypothesis is derived as below.
H6. The perceived compatibility of IT users is positively related to the availability of complementary goods for the users.
Thefirst important contribution of the network externalities literature concerns formalization through the concept of an overall installed base. This means an equilibrium market for the goods is unlikely to exist unless the overall installed base is greater than a minimum level[86]. When an industry is characterized by network externalities, the overall IT installed base and the availability of complementary goods likely play major roles in network effects[71]. For example, when bankers launch payment instruments, the bankers (or issuers) are faced with a‘chicken-and-egg’ problem: merchants will be reluctant to invest in new equipment or software needed to accept such payments unless an amount of sufficient consumers shows their interest. Consumers, on the other hand, will not use the new means of payment if they can only use it in a few places[86]. When customers compare the value of a new technology to an existing one, they weigh a combination of subjective information (e.g. perceived technological compatibility, perceived information on the installed base and complementary goods). This process is captured in this study's proposed model[18]. In other words, an insufficient installed based in a society may result in a situation in which a firm finds itself unable to develop or competitively sell products in society. Products that have a large installed base are likely to attract more providers of complementary goods.
As more IT users join a network, a growing user base becomes increasingly attractive for IT providers to offer complementary goods of potential interest to the user base. For example, the number of CD titles available is likely driven by the installed base of sets of CD players[28]. The same phenomenon applies to such IT products as iPods. In other words, the user's network benefit from Skype depends in part on the total installed base of Skype users worldwide. Similarly, a large installed base of Microsoft Windows is often credited to the availability of a larger number of application tools and software on this platform, versus competing platforms such as Linux or Macintosh. A large installed base extends the range of a user's network, attracts more developers of complementary technologies, and thus increases the number of options available to the user, therefore enhancing the value of the user's IT usage[16,50]. This phenomenon suggests that the complementary goods of a particular IT are likely provided in the market based on the overall installed base of the IT, leading to a new hypothesis as follows.
H7. The overall installed base is positively related to the availability of complementary goods for the users. In summary of our preceding hypotheses, we present our research framework inFig. 1.
3. Method
3.1. Subjects and measures
The research hypotheses described above were empirically tested using a usage survey of instant messaging (IM) technology among student subjects at an evening college of a large university in Taiwan. These students work as professionals in a variety of industries during the daytime. Using students with work experience as subjects, rather than those without work experience, helps facilitate improved external validity (e.g.,[49]). University students were recruited for this study, because this population represents one of the largest user groups of Internet and IM in particular. Previous research specifically indicates that college students constitute the major IM users in Taiwan[90]. Shiu and Lenhart[76]observed that Gen-Y-ers aged 19–27 years old represent the largest proportion (35%) of IM users and that 62% of Internet users in this age group use IM[50]. The undergraduate student population falls mainly in this age group. Furthermore, university students comprise the majority of online users in Taiwan who use IM[50].
IM is an e-service technology that allows users to communicate using text or video messages synchronously over the Internet. IM was chosen for this study, because it is an advanced network IT that lends itself particularly well to network externalities. The technology is based on the Internet and reflects the features of both direct and indirect network effects well.
A random set of classes from the management college at a university was selected for data collection purposes, with the requirement that participating subjects must have had experience with using at least one kind of IM (e.g., MSN, Yahoo IM, etc.). Two questionnaires were distributed to the same subjects for data collection. Thefirst questionnaire was distributed at time T1,
and the second questionnaire was distributed at time T2one month later. Thefirst and the second questionnaires were both
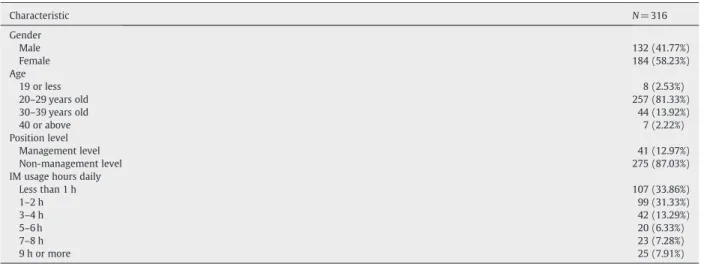
matched by a unique identifying code after data collection was completed. Note that previous research suggests a gap of one month for two surveys on the same subjects[51,83]. If the gap is too long, then the relationships between research constructs are likely moderated by unpredictable and uncontrollable factors, leading to low data validity. Of the 767 questionnaires distributed to the subjects each time, 316 matched questionnaires were collected across both time periods for an effective response rate of 41.20%.Table 2presents the characteristics of the sample.
All the constructs in this study were measured by scales drawn and modified from previous literature. Several steps were employed to refine the measurement items, as depicted in the following.
To begin with, the items from the existing literature were modified and translated into Chinese. A university professor and several graduate students familiar with IM usage were asked to provide assistance in evaluating the appropriateness of the Chinese version of the scale. Furthermore, the measurements were tried via three pilot tests respectively. Subjects were asked to fill out the survey questionnaire and comment on any confusing item in the questionnaire, and inappropriate questionnaire items were examined and refined thoroughly after the tests. The pilot tests were performed in order to refine the measurement scales (i.e., improve item readability and clarity) before the actual survey. Respondents in pilot tests were all excluded in the subsequent survey. The pilot test data were subjected to exploratory factor analysis (EFA) and reliability analysis to identify items that loaded
poorly on their hypothesized scales, which were then re-worded. This process of instrument refinement led to considerable improvement in content validity and scale reliability. Lastly, tips of back-translation suggested by[67]were used in composing an English version questionnaire and a Chinese one. A high degree of correspondence between the two questionnaires assured this research that the translation process did not substantially introduce artificial translation biases in the Chinese version of our questionnaire.
One of our eight constructs of interest, relationship quality, was measured at time T2, and the other seven constructs were all
measured at time T1(one month earlier than T2). Wherever possible, construct measures were derived from prior research, after
adjusting the wording for IM. AppendixAlists the measurement items. Except for the scale items measuring the overall installed base, all items were measured usingfive-point Likert scales anchored between “strongly disagree” and “strongly agree.” It is important to note that surveying the outcome at time T2and for the rest of constructs at time T1in this study substantially reduces
the potential risk of common method bias that often exists in survey research.
Relationship quality is measured with four items modified from Lin and Ding[52]. While synchronization value with four items is modified from Lin and Bhattacherjee[50], autarky value with four items is modified from Grewal et al.[31]. Note that autarky value and synchronization value are both related but distinct constructs. Although IM autarky value is its value standing alone (e.g., irrespective of the number of other users), this value may help amplify IM synchronization value under some circumstances. For example, when users gain access to online news reports or videos more easily for personal pleasure (i.e., autarky value), it is more likely that such information (e.g., news) can be shared to help maintain a sense of connection with others within an active communication zone (e.g.,[60]).
Relationship commitment with three items and perceived critical mass with four items are modified from Li et al.[46]. The availability of complementary goods with four items is modified from Lin and Bhattacherjee[50]. Perceived compatibility with four items is modified from Moore and Benbasat[58]and Grewal et al.[31]. Finally, overall installed base was measured using four items that asked subjects to indicate their observation about what percentage of people, university students, working adults, and senior high school students used IM, on a ten-point scale with ranges such as 0–9%, 10–19%, 20–29%, and so forth. This scale was a modified version of Schilling's [71] scale and was developed based on pre-test interviews of student subjects regarding their IM use. Note that our measurement model is a reflective one as illustrated in AppendixB.
4. Data analysis
Thefinal survey data, with a sample size of 316 matched responses from two surveys respectively at time T1and time T2, were
analyzed (with the CALIS procedural of SAS software) using a two-step structural equation modeling (SEM) approach proposed by Anderson and Gerbing[3]. The application of SEM includes two major advantages. First, all the relevant model paths are directly tested and none are omitted as in ANOVA[8]. Second, complications of measurement error, correlated measurement error, and even feedback are incorporated directly into the model[8]. It is clear that SEM is a powerful tool that is used to great benefit in psychological research[55]. Thefirst step of SEM involves developing an effective measurement model with confirmatory factor analysis, while the second step analyzes the structural model. Test results from each stage of analysis are presented next.
After considering the MI (modification index) used to examine indicator variables[39], some indicator variables were removed from the model under the circumstance that the indicator variables were multidimensional[35]. Consequently, every construct in the measurement model is measured using at least three indicator variables as inTable 3. The chi-square/df in this study meets the standard criteria, because a chi-square/df that is lower than 2.0 reveals a goodfit according to the informal rule-of-thumb criteria
[35]. The goodness-of-fit of the CFA (confirmatory factor analysis) model was assessed using a variety of fit metrics, as shown in
Table 3. Although the normedfit index (NFI) and the adjusted goodness-of-fit index (AGFI) are both slightly lower than the recommended value of 0.9, the root mean square residual (RMR) was smaller than 0.05, and the root mean square error of Table 2 Sample characteristics. Characteristic N = 316 Gender Male 132 (41.77%) Female 184 (58.23%) Age 19 or less 8 (2.53%) 20–29 years old 257 (81.33%) 30–39 years old 44 (13.92%) 40 or above 7 (2.22%) Position level Management level 41 (12.97%) Non-management level 275 (87.03%)
IM usage hours daily
Less than 1 h 107 (33.86%) 1–2 h 99 (31.33%) 3–4 h 42 (13.29%) 5–6h 20 (6.33%) 7–8 h 23 (7.28%) 9 h or more 25 (7.91%)
approximation (RMSEA) was smaller than 0.08, while the comparativefit index (CFI), the non-normed fit index (NNFI), and the goodness-of-fit index (GFI) all exceeded 0.90. These figures suggest that the hypothesized CFA model in this study fits well with the empirical data.
Note that the above indices are important in SEM for evaluating an idealfit for the measurement model. First, as an alternative to the chi-square test, Bentler and Bonett's[9] normedfit index (NFI) is regarded as the percentage of observed-measure covariation explained by a given measurement or structural model[3,35]. Second, Bentler's[10]comparativefit index (CFI) is similar to the NNFI in which it offers an accurate assessment offit regardless of sample size[35]. Third, a variation on the NFI is the non-normedfit index (NNFI) which has been proved to better reflect model fit under all sample sizes[10,35].
Convergent validity was examined and evaluated using three criteria suggested by Fornell and Larcker[25]. To begin with, all factor loadings inTable 3were statistically significant at pb0.001 to assure convergent validity of the construct[3]. Despite that one value of the average extracted is slightly smaller than 0.50, the other values of average variance extracted are all larger than the 0.50 criteria recommended by Fornell and Larcker[25], indicating that the overall hypothesized items capture a sufficient variance in the underlying construct than that attributable to measurement error. Moreover, the reliabilities for each construct exceeded 0.70 (seeTable 3), satisfying the general requirement of reliability for research instruments. Collectively, the empirical data collected by this study met all three criteria required to assure convergent validity.
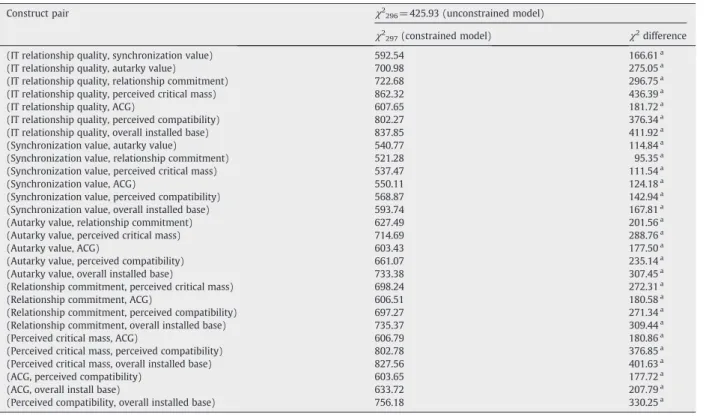
In SEM the chi-square difference test can be used to assess the discriminant validity of two constructs by calculating the difference of the chi-square statistics for the constrained and unconstrained measurement models[35]. The critical advantage of the chi-square difference test for examining discriminant validity is that it allows for simultaneous pairwise comparisons based on the Bonferroni method for the constructs. The constrained model is identical to the unconstrained model, in which all constructs are allowed to co-vary, except that the correlation between the two constructs of interest isfixed at 1. Discriminant validity is demonstrated if the chi-square difference (with 1 df) is significant, suggesting that the model in which the two constructs are viewed as distinct (but correlated) factors is superior. As this study needs to test the discriminant validity for every pair of eight constructs, this study should control the experiment-wise error rate (the overall significance level). By using the Bonferroni method under the overall 0.01 level, the critical value of the chi-square test isχ2
(1, 0.01/28) = 12.74. Since the chi-square difference statistics for every two constructs all exceed 12.74 in the model as displayed inTable 4, discriminant validity is successfully achieved.
After the measurement model testing, the CFA model in thefirst stage was transformed to a structural model that reflects the hypothesized associations described in our research model for purposes of hypotheses testing.Fig. 2presents the test results of this analysis.
Six out of our seven hypothesized model paths were validated at the pb0.05 significance level or better, as shown inFig. 2. Specifically, IT relationship quality is significantly influenced by synchronization and autarky value (H1 and H2are supported), while synchronization is influenced by relationship commitment and perceived critical mass (H3 and H4are supported). At the same time, autarky value is influenced by the availability of complementary goods, which is in turn influenced by perceived Table 3
Standardized loadings and reliabilities.
Construct Indicatorsa
Standardized loading AVE Cronbach'sα IT relationship quality RQ1 0.77 (t = 13.98) 0.57 0.84 RQ2 0.81 (t = 15.09) RQ2 0.67 (t = 11.55) RQ4 0.75 (t = 13.51) Synchronization value SV1 0.70 (t = 11.63) 0.49 0.74 SV2 0.71 (t = 11.93) SV3 0.68 (t = 11.38)
Autarky value AV1 0.80 (t = 14.79) 0.62 0.82
AV2 0.86 (t = 16.30) AV3 0.69 (t = 12.16)
Relationship commitment RC1 0.88 (t = 16.90) 0.63 0.83 RC2 0.82 (t = 15.41)
RC3 0.66 (t = 11.63)
Perceived critical mass PCM1 0.81 (t = 15.50) 0.72 0.88 PCM2 0.85 (t = 16.63)
PCM3 0.89 (t = 17.89)
Availability of complementary goods (ACG) ACG1 0.53 (t = 8.49) 0.53 0.75 ACG2 0.81 (t = 13.74) ACG3 0.80 (t = 13.43) Perceived compatibility PC1 0.81 (t = 15.39) 0.63 0.87 PC2 0.81 (t = 15.41) PC3 0.80 (t = 15.22) PC4 0.75 (t = g13.73)
Overall installed base OIB1 0.66 (t = 11.23) 0.53 0.81 OIB2 0.83 (t = 15.17)
OIB3 0.72 (t = 12.67) OIB4 0.68 (t = 11.71) Goodness-of-fit indices (N=315): χ2
296= 425.93 (p-valueb0.001); NNFI=0.95; NFI=0.88; CFI=0.96; GFI=0.90; AGFI=0.87; RMR=0.03; RMSEA=0.04. a Indicators remained after CFA purification. A few indicators are excluded from this measurement model due to their insignificance.
compatibility (H5 and H6are supported). However, the influence of overall installed base on the availability of complementary goods is insignificant, suggesting thatH7is not supported.
The unsupportedH7implies that users’ perceived availability of complementary goods is not significantly related with their perceived overall installed base in the market. This phenomenon exists perhaps on account that it is difficult for an individual user to have a clear picture about the market situation regarding the market share (i.e., overall installed base) of a specific IT or software Table 4
Chi-square difference tests for examining discriminant validity.
Construct pair χ2
296= 425.93 (unconstrained model)
χ2
297(constrained model) χ2difference
(IT relationship quality, synchronization value) 592.54 166.61a
(IT relationship quality, autarky value) 700.98 275.05a
(IT relationship quality, relationship commitment) 722.68 296.75a
(IT relationship quality, perceived critical mass) 862.32 436.39a
(IT relationship quality, ACG) 607.65 181.72a
(IT relationship quality, perceived compatibility) 802.27 376.34a
(IT relationship quality, overall installed base) 837.85 411.92a
(Synchronization value, autarky value) 540.77 114.84a
(Synchronization value, relationship commitment) 521.28 95.35a
(Synchronization value, perceived critical mass) 537.47 111.54a
(Synchronization value, ACG) 550.11 124.18a
(Synchronization value, perceived compatibility) 568.87 142.94a
(Synchronization value, overall installed base) 593.74 167.81a
(Autarky value, relationship commitment) 627.49 201.56a
(Autarky value, perceived critical mass) 714.69 288.76a
(Autarky value, ACG) 603.43 177.50a
(Autarky value, perceived compatibility) 661.07 235.14a
(Autarky value, overall installed base) 733.38 307.45a
(Relationship commitment, perceived critical mass) 698.24 272.31a
(Relationship commitment, ACG) 606.51 180.58a
(Relationship commitment, perceived compatibility) 697.27 271.34a
(Relationship commitment, overall installed base) 735.37 309.44a
(Perceived critical mass, ACG) 606.79 180.86a
(Perceived critical mass, perceived compatibility) 802.78 376.85a
(Perceived critical mass, overall installed base) 827.56 401.63a
(ACG, perceived compatibility) 603.65 177.72a
(ACG, overall install base) 633.72 207.79a
(Perceived compatibility, overall installed base) 756.18 330.25a
ACG = Availability of complementary goods.
a Significant at the 0.001 overall significance level by using the Bonferroni method.
before actually coming across complementary goods of the IT in the market. However, the unexpected result for the unsupported hypothesis may warrant further study so that the true reasons behind the unsupported hypothesis are not misinterpreted. 5. Discussion
This study provides an illustrative example of how the network externalities theory is extended to study IT relationship quality and represents such externalities as key factors in inducing social change in the contexts of IT relationship quality. The role of users in improving relationship commitment and the role of suppliers in improving their service compatibility substantiate the fact that no individual enterprise in isolation can succeed in its drive to obtain IT relationship quality in the process of technological change. For example, customers are less likely to adopt a technology when they are not told of it by others in their social circle and/or perceive the technology is poorer than that of competing and complementary technologies. Famous examples of this situation can be seen in the failure of Sony's Beta video standard (Matsushita promptly licensed its VHS format to ensure the rapid production of VHS videotapes) and the uninteresting customer response to the PowerPC (for which only a few software programs were available)[71]. The failure of these goods (Beta video standard and Power PC) is not because their product quality is bad, but rather because their providers did not generate network effects through a positive psychological response of customers in general in society, leading to low network externalities.
Given the increased interactive features of today's IT, it is essential to incorporate the notion of network externalities to enhance our current understanding of IT relationship quality particularly in a modern society. As mentioned in the previous two sections, network externalities are important not only for understanding a person's satisfaction and trust of interactive IT such as e-mail,file-sharing networks, and instant messaging, but also for many traditional non-interactive software products such as spreadsheets and operating systems. It is rather important to distinguish between the two alternative types of network externalities, given that for interactive IT, both direct and indirect externalities may influence user perceptions of network values, while for non-interactive IT only an indirect externality may be relevant.
The results of our study empirically establish the network externality hypotheses that users’ perceived value, including synchronization and autarky values, is an important predictor of their IT relationship quality. By validating the network effect hypotheses using primary data collected directly from users, this study serves as an important complement to previous works that employed secondary data (e.g., market price information) from network providers to prove similar hypotheses.
One of the importantfindings in this research reveals that user perceptions of autarky value are not arbitrary, but instead are influenced by perceived compatibility through the mediation of the availability of complementary goods. In addition to the particular vendor's product itself, other relevant and related upstream and downstream suppliers also play an equally important role by providing complementary product goods under dramatic technical change in today's society. Thisfinding also implies that externalities in the form of vendors’ suggestions and participation in the research and development of new products may be a vital source of information to induce technical change with network externalities. A large effect of the availability of complementary goods on the indirect network effect (i.e., autarky value), as observed in this study, suggests that IT providers interested in increasing their autarky value can benefit from focusing some of their product development initiatives towards developing value-added complementary services or products in order to strengthen customers’ psychological perceptions, instead of only further developing advanced technological features of the target IT. Although perceived compatibility is the only antecedent that influences the availability of complementary goods in this study, there may be additional network externalities relevant for the availability beyond perceived compatibility, which may be the subject of future investigations in this area.
It is important to note that network effects can be driven by variety or quality depending on technological or social change. Nintendo's prior dominance in the video-game market was mostly driven technically by the quality of the video games Nintendo and its licensees offered (i.e., technical change) (e.g.,[56]). Similarly, iPhone successfully presents lock-in and network effects due to its superior quality and attractive functions[20].
With regard to the significant association between relationship commitment and synchronization value, this finding suggests that marketers should provide users with demonstration programs (e.g., advertising, commercial, or promotion activities) that emphasize how IT facilitates the establishment of social relationships in a modern society, leading to their enhanced influence of relationship commitment on perceived synchronization value. Accordingly, consistent with suggestions from network theory in that the size of a network influences one's network participation behavior[47], this studyfinds the perceived critical mass reflecting the size of a network that significantly influences synchronization value, which becomes critically complementary to previous research of social networking. Previous literature[24]confirms that IM perfectly fits the classic definition of a service imbued with network effects, in which the value to each customer dependsfirst upon the IM functions (e.g., obtaining news reports, saving files on a Internet hard drive, browsing online videos and blogs) and second the number of other customers (and who they are) who also use the service (e.g., real-time chatting, photo sharing). An additional implication for selecting IM as the technology in this study is that future anticipation of users concerning the market size of a network product is crucial to the prosperity of the product. For that reason, consumer anticipation about a particular technology being a standard in the near future may result in it eventually becoming the actual standard. Of course, such anticipation counts heavily on the installed base tested in this study.
Given the significant direct and indirect network effects on IT relationship quality, marketers interested in widespread user diffusion of their IT services and/or management responsible for the implementation of interactive IT in their organizations should be cognizant of and stress the important role of network effects in their rollout plans. For example, the two strategic roles of adapting and shaping[34]have the potential to generate considerable value in the context of network externalities. Specifically, firms applying an adapting strategy (i.e., adaptors) endeavor to stay one step ahead of their competitors in response to changes in the e-commerce environment with network externality, whilefirms applying a shaping strategy (i.e., shapers) focus on the fluidity
of events and on opportunities to affect outcomes in the environment[34]. Managers making good use of the two strategic roles can effectively achieve successful IT relationship quality.
6. Limitations and future research
The results of this study should be interpreted in light of their limitations. Thefirst limitation of this study is the possibility of common method bias, given that most of the constructs based on this study's proposed research model were measured perceptually at the same instance in time. To test for this bias, this study practiced Harmon's single factor test[65]. More specifically, in case a substantial amount of common method variance exists in the data sample, either a single factor will emerge from the factor analysis or one general factor will account for the majority of the covariance in the independent and dependent variables. An exploratory factor analysis of all items for the eight constructs measured in this study revealed eight factors explaining 15.19%, 14.38%, 13.61%, 12.60%, 11.75%, 11.37%, 10.78%, and 10.32% of the total variance. These percentage numbers indicate that the variances are properly distributed among multiple factors, indicating that common method bias is unlikely a problem with the study's data sample.
Second, perceived critical mass (i.e., a form of network size) and availability of complementary goods were chosen as two key network externalities within the IT service context, because theyfit well with Katz and Shapiro's[41]description of direct and indirect externalities and also because they are salient to IT users. However, there may be additional externalities, such as the coordination of standards and path dependency, which this study did not examine. Future research should consider these potential determinants in an attempt to advance the nascent state of literature in this area.
This study has empirically validated the positive effect of network externalities in strengthening the relationship quality of interactive IT. We hope that this research offers the foundation for establishing a comprehensive knowledge base of network externalities and inspires future researchers to examine this potentially useful yet ignored area of IT relationship marketing research. Based on ourfindings, future researchers are advised to consider various IT services (e.g., banking, brokerage, e-auction, e-payment, and e-billing) by simultaneously including more critical factors such as timing (e.g.,[71]), learning (e.g.,[30]), consumer characteristics (e.g.,[79]), and price discrimination (e.g.,[44]). It would be interesting to see several consumer groups with different genders, education, or motivation be formed for a comparison based on our research model.
Acknowledgements
The authors would like to thank the support of the National Science Council of the Republic of China, Taiwan and the help of Mr. Shan-Lien Shen for data collection.
Appendix A. Measurement items
Synchronization value (1: Strongly Disagree; 5: Strongly Agree)
SV1. To me, an important value of my IM is that it allows me to synchronously send or receive text messages from friends/ relatives online.
SV2. To me, an important value of my IM is that it allows me to synchronously share photographs with friends/relatives online. SV3. To me, an important value of my IM is that it allows me to synchronously interact with others.
SV4. To me, an important value of my IM is that it allows me to synchronously send or receive voice messages from friends/ relatives online.
Autarky value (1: Strongly Disagree; 5: Strongly Agree) AV1. My IM reduces my costs associated with communication. AV2. My IM streamlines my regular work in a daily life. AV3. My IM is entertaining to me.
AV4. My IM is an efficient tool to me.
Relationship commitment (1: Strongly Disagree; 5: Strongly Agree)
RC1. I am committed to maintaining my relationship with my friends and/or relatives. RC2. I want my relationship with my friends and/or relatives to last over the long term. RC3. I feel attached to my relationship with my friends and/or relatives.
Perceived critical mass (1: Strongly Disagree; 5: Strongly Agree)
PCM1. Many of the people I keep in touch with regularly use the same kind of IM as mine. PCM2. Many of the people in my social circle use the same kind of IM as mine.
PCM3. Many of the people I socially interact with on a regular basis use the same kind of IM as mine. PCM4. My important friends and/or relatives use the same kind of IM as mine.
Availability of complementary goods (1: Strongly Disagree; 5: Strongly Agree) ACG1. A wide range of online games is available on my IM.
ACG2. A wide range of images, skins, and emoticons is available on my IM.
ACG3. A wide range of support tools (for photo sharing, broadcasting, message sharing) is available on my IM. ACG4. A wide range of radio stations is available on my IM.
Perceived compatibility (1: Strongly Disagree; 5: Strongly Agree) PC1. Using my IM is compatible with all aspects of a modern life.
PC2. Using my IM is completely compatible with the current situation in the society. PC3. I think that using my IMfits well with the way people like to work.
PC4. Using the IM I usefits into people's lifestyle.
Overall installed base (1: Under 10%; 2: 10–19%; 3: 20–29%; 4: 30–39%; 5: 40–49%; 6: 50–59%; 7: 60–69%; 8: 70–79%; 9: 80–89%; 10: more than 90%)
OIB1. What percentage of people in Taiwan do I think use the same kind of IM as mine: ___ %
OIB2. What percentage of university students in Taiwan do I think use the same kind of IM as mine: ___ % OIB3. What percentage of working adults in Taiwan do I think use the same kind of IM as mine: ___ %
OIB4. What percentage of senior high school students in Taiwan do I think use the same kind of IM as mine: ___ %
IT relationship quality (Measured one month after the above seven constructs) (1: Strongly Disagree; 5: Strongly Agree) RQ1. I am satisfied with my IM.
RQ2. I am pleased to use my IM.
RQ3. The service provided by my IM is trustworthy. RQ4. My IM is reliable.
Appendix B. An example of the reflective constructs of this study
References
[1] R.L. Ackoff, F.E. Emery, B.D. Ruben, On Purposeful Systems: An Interdisciplinary Analysis of Individual and Social Behavior as a System of Purposeful Events, Aldine-Atherton, Chicago, 2005.
[2] C.R. Agnew, P.A.M. van Lange, C.E. Rusbult, C.A. Langston, Cognitive interdependence: commitment and the mental representation of close relationships, J. Pers. Soc. Psychol. 74 (4) (1998) 939–954.
[3] J.C. Anderson, D.W. Gerbing, Structural equation modeling in practice: a review and recommended two-step approach, Psychol. Bull. 103 (3) (1988) 411–423. [4] Anonymous. Network effect, from http://en.wikipedia.org/wiki/Network_effect, 2009.
[5] E.B. Ansell, J.E. Kurtz, P.M. Markey, Gender differences in interpersonal complementarity within roommate dyads, Pers. Soc. Psychol. Bull. 34 (4) (2008) 502–512.
[6] A. Asvanund, K. Clay, R. Krishnan, M.D. Smith, An empirical analysis of network externalities in peer-to-peer music-sharing networks, Inf. Syst. Res. 15 (2) (2004) 155–174.
[7] V. Bala, N.V. Long, International trade and cultural diversity with preference selection, Eur. J. Polit. Econ. 21 (1) (2005) 143–162.
[8] R.M. Baron, D.A. Kenny, The moderator–mediator variable distinction in social psychological research: conceptual, strategic, and statistical considerations, J. Pers. Soc. Psychol. 51 (6) (1986) 1173–1182.
[9] P.M. Bentler, D.G. Bonett, Significance tests and goodness-of-fit in the analysis of covariance structures, Psychol. Bull. 88 (3) (1980) 588–606. [10] P.M. Bentler, EQS Structural Equations Program, BMDP Statistical Software, Los Angeles, 1989.
[11] S.R. Bhaskaran, S.M. Gilbert, Selling and leasing strategies for durable goods with complementary products, Manage. Sci. 51 (8) (2005) 1278–1290. [12] A. Bhattacherjee, Understanding information systems continuance: an expectation–confirmation model, MIS Quart. 25 (3) (2001) 351–370.
[13] T.W. Bickmore, R.W. Picard, Establishing and maintaining long-term human–computer relationships, ACM Trans.Comput. Hum. Interact. 12 (2) (2005) 293–327. [14] E. Brynjolfsson, C.F. Kemerer, Network externalities in microcomputer software: an econometric analysis of the spreadsheet market, Manage. Sci. 42 (12)
(1996) 1627–1647.
[15] A. Chernev, Feature complementarity and assortment in choice, J. Consum. Res. 31 (4) (2005) 748–759.
[16] T. Cottrell, Software variety and hardware value: a case study of complementary network externalities in the microcomputer software industry, J. Eng. Technol. Manage. 15 (4) (1998) 309–339.
[17] L.A. Crosby, K.R. Evans, D. Cowles, Relationship quality in services selling: an interpersonal influence perspective, J. Mark. 54 (3) (1990) 68–81. [18] B. Dattée, H.B. Weil, Dynamics of social factors in technological substitutions, Technol. Forecast. Soc. 74 (5) (2005) 579–607.
[19] J.J.A. Denissen, L. Penke, D.P. Schmitt, M.A.G. van Aken, Self-esteem reactions to social interactions: evidence for sociometer mechanisms across days, people, and nations, J. Pers. Soc. Psychol. 95 (1) (2008) 181–196.
[20] J. Dörr, A. Benlian, C. Grau, T. Wilde, T. Hess, Will abandoning DRM have a boomerang effect on Apple?—an empirical analysis of lock-in and network effects, hicss, The Proceedings of 42nd Hawaii International Conference on System Sciences, 2009, pp. 1–10.
[21] D.C. Dryer, L.M. Horowitz, When do opposite attract? Interpersonal complementarity versus similarity, J. Pers. Soc. Psychol. 72 (3) (1997) 592–603. [22] N. Economides, The economics of networks, Int. J. Ind. Organ. 14 (1996) 673–699.
[23] T.M. Emmers-Sommer, The effect of communication quality and quantity indicators on intimacy and relational satisfaction, J. Soc. Pers. Relationship. 21 (3) (2004) 399–411.
[24] G. Faulhaber, Network effects and merger analysis: instant messaging and the AOL–Time Warner case, Telecommunications Pol. 26 (5/6) (2002) 311–333. [25] C. Fornell, D.F. Larcker, Evaluating structural equation models with unobservable variables and measurement error, J. Mark. Res. 18 (1) (1981) 39–50. [26] J.K. Frels, T. Shervani, R.K. Srivastave, The integrated networks model: explaining resource allocations in network markets, J. Mark. 67 (1) (2003) 29–45. [27] N. Gandal, Hedonic price indexes for spreadsheets and an empirical test for network externalities, Rand J. Econ. 25 (1) (1994) 160–170.
[28] N. Gandal, M. Kende, R. Rob, The dynamics of technological adoption in hardware/software systems: the case of compact disc players, Rand J. Econ. 31 (2000) 43–61. [29] D. Ge, Value pricing in presence of network effects, J. Prod. Brand Manage. 11 (2) (2002) 174–183.
[30] A. Goolbsee, P.J. Klenow, Evidence on learning and network externalities in the diffusion of home computers, J. Law Econ. 45 (2) (2002) 317–343. [31] R. Grewal, J.M. Comer, R. Mehta, An investigation into the antecedents of organizational participation in business-to-business electronic markets, J. Mark. 65
(3) (2001) 17–33.
[32] S.J. Grove, G.M. Pickett, D.N. Laband, An empirical examination of factual information content among service advertisements, Serv. Ind. J. 15 (2) (1995) 216–233.
[33] A. Gupta, D. Zhdanov, Growth and sustainability of managed security services networks: an economic perspective, Working paper, 2006. [34] J. Hagel III, Spider versus spider, McKinsey Quart. 1 (1996) 5–18.
[35] L. Hatcher, A Step-by-Step Approach to Using the SAS System for Factor Analysis and Structural Equation Modeling, SAS Institute Inc, Cary, NC, 1994. [36] M. Holmlund, A definition, model, and empirical analysis of business-to-business relationship quality, Int. J. Serv. Ind. Manage. 19 (1) (2008) 32–62. [37] M.H. Huang, The influence of selling behaviors on customer relationships in financial services, Int. J. Serv. Ind. Manage. 19 (4) (2008) 458–473. [38] D.A. Irwin, The welfare cost of autarky: evidence from the Jeffersonian trade embargo, 1807-09, Rev. Int. Econ. 13 (4) (2005) 631–645.
[39] K.G. Jöreskog, D. Sorbom, LISREL VI: Analysis of Linear Structural Relationships by Maximum Likelihood, Instrumental Variables, and Least Squares Methods4th ed, Scientific Software, Mooresville, IN, 1986.
[40] V. Kathuria, Role of externalities in inducing technical change: a case study of the Indian machine tool industry, Technological Forecasting Soc. Change 61 (1) (1999) 25–44.
[41] M.L. Katz, C. Shapiro, Network externalities, competition, and compatibility, Am. Econ. Rev. 75 (3) (1985) 424–440. [42] M.L. Katz, C. Shapiro, Technology adoption in the presence of network externalities, J. Polit. Econ. 94 (4) (1986) 822–841.
[43] R.J. Kauffman, J. McAndrews, Y.M. Wang, Opening the“black box” of network externalities in network adoption, Inf. Syst. Res. 11 (1) (2000) 61–82. [44] S.P. King, R. Lampe, Network externalities, price discrimination and profitable piracy, Inf. Econ. Policy 15 (2003) 271–290.
[45] Y. Lee, G.C. O'Connor, New product launch strategy for network effects products, J. Acad. Mark. Sci. 31 (3) (2003) 241–255.
[46] D. Li, P.Y.K. Chau, H. Lou, Understanding individual adoption of instant messaging: an empirical investigation, J. Assoc. Inf. Syst. 6 (4) (2005) 102–129. [47] S.J. Liebowitz, S.E. Margolis, Are network externalities a new source of market failure? Res. Law Econ. 17 (1995) 1–22.
[48] S.J. Liebowitz, S.E. Margolis, Should technology choice be a concern of antitrust policy? Harv. J. Law Technol. 9 (2) (1996) 284–317. [49] C.P. Lin, To share or not to share: modeling knowledge sharing using exchange ideology as a moderator, Pers. Rev. 36 (3) (2007) 457–475.
[50] C.P. Lin, A. Bhattacherjee, Elucidating individual intention to use interactive information technologies: the role of network externalities, Int. J. Electron. Commer. 13 (1) (2008) 85–108.
[51] C.P. Lin, A. Bhattacherjee, Understanding online social support and its antecedents: a socio-cognitive model, Soc. Sci. J. 46 (4) (2009) 724–737. [52] C.P. Lin, C.G. Ding, Opening the black box: assessing the mediating mechanism of relationship quality and the moderating effects of prior experience in ISP
service, Int. J. Serv. Ind. Manage. 16 (1) (2005) 55–80.
[53] L. Lin, N. Kulatilaka, Strategic growth options in network industries, Adv. Strateg. Manage. 24 (2007) 177–198. [54] H. Lou, W. Luo, D. Strong, Perceived critical mass effect on groupware acceptance, Eur. J. Inf. Syst. 9 (2) (2000) 91–103.
[55] R.C. MacCallum, J.T. Austin, Applications of structural equation modeling in psychological research, Annu. Rev. Psychol. 51 (2000) 201–226.
[56] S. Markovich, J. Moenius, Winning while losing: competition dynamics in the presence of indirect network effects, Int. J. Ind. Organ. 27 (3) (2009) 346–357. [57] P. McLean, Inside Google's Android and Apple's iPhone OS as Software Markets, , 2009 Retrieved at http://www.appleinsider.com/articles/09/11/21/
inside_googles_androi d_and_apples_iphone_os_as_software_markets.html, November 21.
[58] G.C. Moore, I. Benbasat, Development of an instrument to measure the perceptions of adopting and information technology innovation, Inf. Syst. Res. 2 (3) (1991) 192–222.
[59] D.S. Moskowitz, M.H.R. Ho, A.M. Turcotte-tremblay, Contextual influences on interpersonal complementarity, Pers. Soc. Psychol. Bull. 33 (8) (2007) 1051–1063.
[60] B. Nardi, S. Whittaker, E. Bradner, Interaction and outeraction: instant messaging in action, Proceedings of CSCW 2000, 2000, pp. 79–88, Philadelphia. [61] G. Naylor, K.E. Frank, The impact of retail sales for responsiveness on consumers’ perceptions of value, J. Serv. Mark. 14 (4) (2000) 310–322.
[62] G. Odekerken-Schröder, H. Ouwersloot, J. Lemmink, J. Semeijn, Consumers trade-off between relationship, service package and price: an empirical study in the car industry, Eur. J. Mark. 37 (1/2) (2003) 219–242.
[63] P.E. Oliver, G. Marwell, R. Teixeira, A theory of the critical mass. I. interdependence, group heterogeneity, and the production of collective action, Am. J. Soc. 91 (3) (1985) 522–556.
[64] P.A. Pavlou, Consumer acceptance of electronic commerce: integrating trust and risk with the technology acceptance model, Int. J. Electron. Commer. 7 (3) (2003) 101–134.
[65] P.M. Podsakoff, D.W. Organ, Self-reports in organizational research: problems and prospects, J. Manage. 12 (4) (1986) 531–544. [66] J. Preece, Sociability and usability in online communities: determining and measuring success, Behav. Inf. Technol. 20 (5) (2001) 347–356.
[67] N. Reynolds, A. Diamantopoulos, B.B. Schlegelmilch, Pretesting in questionnaire design: a review of the literature and suggestions for further research, J. Mark. Res. Soc. 35 (2) (1993) 171–182.