國立交通大學
環境工程研究所
碩士論文
利用三辛基氧化膦包覆之二氧化鈦奈米晶粒
光降解內分泌干擾物質研究
Photoactivity of TOPO-capped TiO
2nanocrystals for the degradation of endocrine disrupting
chemicals
研究生:羅品涵
指導教授:張淑閔 博士
利用三辛基氧化膦包覆之二氧化鈦奈米晶粒光降解內分
泌干擾物質研究
Photoactivity of TOPO-capped TiO
2nanocrystals for the
degradation of endocrine disrupting chemicals
研 究 生:羅品涵
Student: Pin-Han Lo
指導教授:張淑閔
Advisor:
Sue-Ming
Chang
國 立 交 通 大 學
環 境 工 程 研 究 所
碩 士 論 文
A Thesis
Submitted to Institute of Environmental Engineering
College of Engineering
National Chiao Tung University
In Partial Fulfillment of the Requirements
for the Degree of
Master In
Environmental Engineering
September 2008
Hsinchu, Taiwan, Republic of China
致謝
承蒙指導教授 張淑閔博士悉心指導,學習獨立思考與作研究應有的
態度,自此學生向老師敬上最由衷的感謝之意。承蒙中央大學化材系陳郁
文教授、清華大學醫環系董瑞安教授與孫毓璋教授,透過不同專業領域,
提供許多寶貴的意見與討論,使本論文得以順利完成。
感謝傑耀學長、品欣學姐帶領我進入光催化世界與熟悉實驗室的學習
環境,也讓我學到很多做人處事的道理;謝謝文彬學長無條件讓我使用
HPLC,教導我許多儀器分析上應有的知識;同窗好友維斯、棈榮、阿苦、
璧如、奕甫、嘉玲、俊竹等謝謝你們的陪伴,讓我在實驗苦悶時有人可以
聊天與分享;與董老師實驗室的大家互相切磋,使我獲益良多;與學弟妹
們彼此協助與討論,更是讓我的研究所生涯忙碌且充實。
感謝我的家人,因為你們的支持讓我沒有後顧之憂的完成論文,你們
的微笑更是我繼續努力的原動力,我愛你們。最後要謝謝亮毅,在我無助
時鼓勵我與包容我,我只能說有你真好。
僅以本文獻給所有關心我與曾經幫助過我的大家。
品涵 謹誌
中華民國 97 年 9 月
中文摘要
近年來,利用異相光催化反應分解內分泌干擾物質之議題備受矚目,
其中,加強光觸媒中電子-電洞對轉移能力與促進污染物吸附於光觸媒上,
於提升光催化反應過中污染物分解之效率有著十分重要的貢獻。本研究利
用 非 水 解 性 溶 膠
-凝膠法合成三辛基氧化膦包覆之二氧化鈦奈米晶粒
(TOPO-capped TiO
2),並探討此光觸媒對三種不同親疏水性的環境荷爾蒙:
酚(log K
ow= 1.46)、丙二酚(log K
ow= 2.2)與雌酮(log K
ow= 3.13)的光催化
分解特性。結果證明有機修飾光觸媒對於內分泌干擾物質有優越的吸附能
力,具有最高log K
ow的雌酮於TOPO-capped TiO
2的分配係數最高為28.64
l/g,其次為丙二酚,其分配係數為 3.09 l/g,最低為酚,其分配係數為0.15
l/g,反之,P25對於水中內分泌干擾物質之分配能力則是十分微弱。光催化
結果可以Langmuir-Hinshelwood反應動力式描述,發現TOPO-capped TiO
2分解酚與丙二酚的速率分別優於商用觸媒P25的1.4和3.2倍;動力速率常數
分別為7.3×10
-2和1.4×10
-1ppm×g×min
-1×m
-2,為P25之0.9與2.7倍 (8.2×10
-2和5.2×10
-2ppm×g×min
-1×m
-2),由於表面修飾的有機物會佔據二氧化鈦表面
的活性位置,因此於降解酚的過程中,其速率常數略低於P25的表現,而
TOPO-capped TiO
2對酚與丙二酚的吸附常數分別為2.2×10
-2and 6.4×10
-2l/mg , 為 P25 之 2.2 與 5.8 倍 (1.0×10
-2and 1.1×10
-2l/mg) 。 由 此 可 知
爾蒙降解能力。此外,
EPR結果發現在TOPO-capped TiO
2系統中,光催化反
應產生的氫氧自由基含量低,可知環境荷爾蒙主要利用電子電洞對進行直
接光催化降解,且TOPO-capped TiO
2中捕捉住的電子與電洞量明顯大於
P25,可知TOPO-capped TiO
2能有效抑制電荷再結合,以致於增進有效電荷
利用率。總而言之,本研究合成有機物修飾之光觸媒具有良好有機物吸附
能力與電子電洞對分離能力,因而大幅提升對環境荷爾蒙分解的光催化活
性。與商用光觸媒
P25 相比,在處理不同親疏水性的環境汙染物上
TOPO-capped TiO
2對於催化極高疏水性的汙染物展現出優越的吸附與光催
化能力,此種利用有機修飾光觸媒表面的材料為未來的環境汙染物降解議
題提供了新的可行方案。
關鍵字: 異相光催化反應、內分泌干擾物質、三辛基氧化膦、分配能力、
Langmuir-Hinshelwood、氫氧自由基
Abstract
Heterogeneous photocatalytic reaction for decomposition of endocrine disrupting chemicals (EDCs) has attracted much attention. The efficiency of photodecomposition is limited by the recombination of electrons and holes and the adsorption ability between catalysts and target compounds. In this study, modification of titanium dioxide (TiO2) with
trioctylphosphine oxide (TOPO) was prepared by a non-hydrolytic sol-gel method. The TOPO-capped TiO2 exhibited high adsorption ability for EDCs. The partition coefficients
of phenol, BPA and estrone in the presence TOPO-capped TiO2 are 0.15, 3.09, and 28.64 l/g,
respectively. In contrast, Degussa P25 adsorbs EDCs inefficiently. In the case of photocatalytic reaction, photocatalysis of EDCs follows Langmuir-Hinshelwood model. The initial rates for decomposition of phenol and bisphenol A (BPA) by TOPO-capped TiO2
are 1.4 and 3.2 times, respectively, higher than those by Degussa P25. The kinetic rate constants of phenol and bisphenol A are 7.3×10⁻² and 1.4×10⁻¹ ppm×g×min-1×m-2,
respectively, in the presence of TOPO-capped TiO2, which are 0.9 and 2.7 times, respectively,
higher than those in the P25 slurry (8.2×10⁻² and 5.2×10⁻² ppm×g×min-1×m-2). The smaller
rate constant of TOPO-capped TiO2 for decomposition of phenol is due to that the modifier
occupied active sites. The adsorption coefficients of phenol and bisphenol A are 2.2×10⁻²
and 6.4×10⁻² l/mg, respectively, in the presence of TOPO-capped TiO
2, which are 2.2 and 5.8
times, respectively, higher than those in the P25 slurry (1.0×10⁻² and 1.1×10⁻² l/mg). The
photocatalytic mechanism of TOPO-capped TiO2 mainly involves direct photodecomposition
of these adsorbed EDCs by photo-generated charges rather by hydroxyl radicals which is normally occurred in the P25-based system. In addition, the intensity of trapped holes and electronsin TOPO-capped TiO2 are much higher than that in P25. These results reveal that
TOPO-capped TiO2 improved interfacial charge transfer. In summary, the TOPO assists
contributions improve photocatalytic activity of TOPO-capped TiO2.
Keywords: Heterogeneous photocatalytic reaction; Endocrine disrupting chemicals;
trioctylphosphine oxide (TOPO); Partition; Langmuir-Hinshelwood kinetics, Hydroxyl radical
Content Index
致謝...I 中文摘要... II Abstract...IV Content Index...VI Figure Index...VIII Table Index ... X Chapter 1. Introduction ...1 1.1 Motivation...1 1.2 Objectives ...2Chapter 2. Background and Introduction...4
2.1 Photocatalysis ...4
2.1.1 Principle of photocatalysis...4
2.1.2 Photocatalysts ...6
2.2 Sol-gel method ...8
2.2.1 Hydrolytical Sol-Gel process...8
2.2.2 Non-Hydrolytic Sol-Gel process...9
2.3 Surface Modification ...11
2.4 Endocrine Disrupting Chemicals ...15
2.5 Photocatalytic Degradation for EDCs...16
2.5.1 Photocatalytic degradation technology for phenol ...16
2.5.2 Photocatalytic degradation technology for BPA...19
2.5.3 Photocatalytic degradation for estrone...22
Chapter 3. Experimental Materials and Methods ...23
3.1 Chemicals...23
3.2 Preparation of TOPO-capped TiO2 with NHSG method ...26
3.3 Characterization ...28
3.3.1 X-ray powder Diffractometer (XRPD) ...28
3.3.2 High Resolution Transmission Electron Microscopy (HR-TEM) ...28
3.3.3 X-ray photoelectron Spectroscopy (XPS)...28
3.3.4 Specific Surface Area...29
3.3.7 Thermo gravimetric Analysis (TGA)...30
3.3.8 Dynamic Light Scattering (DLS) and Zeta Potential...31
3.3.9 Electron Paramagnetic Resonance (EPR)...31
3.4 Partition ability of EDCs...32
3.5 Photodegradation of EDCs ...32
3.6 High Performance Liquid Chromatography (HPLC) ...33
Chapter 4. Results and discussion...35
4.1 Physicochemical properties of TOPO-capped TiO2...35
4.1.1 Microstructures of TOPO-capped TiO2...35
4.1.2 Isoelectric point and Hydrodynamic diameter of TiO2...39
4.2 Partition Study ...43
4.2.1 Partition equilibrium ...43
4.2.2 Partition isotherm...45
4.3 EPR spin trapping of hydroxyl radicals for TiO2 powders...49
4.4 Photocatalysis Study ...55 4.4.1 Photocatalytic activity...55 4.4.2 Competitive photocatalysis...65 4.4.3 After photocatalysis ...68 Chapter 5. Conclusions ...70 References...71
Appendix A. Experimental parameters...78
Figure Index
Figure 1- 1 Photocatalytic reaction between TiO2 and EDCs. ...3
Figure 2- 1 Reaction diagram of photocatalysis at a semiconductor by illumination……. 5
Figure 2- 2 The redox potentials of various semiconductors related to the energy levels.32..7
Figure 2- 3 Structure of rutile and anatase TiO2.32...7
Figure 2- 4 Hydrolytic sol-gel process...9
Figure 2- 5 Synthesis mechanism of TiO2 by NHSG.45...10
Figure 2- 6 Photocatalysis decomposition pathway of phenol.68...17
Figure 2- 7 Photocatalysis decomposition pathway of BPA.58...20
Figure 3- 1 Flow chart of experimental design in this study………... 25
Figure 3- 2 The apparatus for preparation of TOPO-capped TiO2 with NHSG method...26
Figure 3- 3 A flow diagram for preparation of TOPO-capped TiO2 with NHSG method. ...27
Figure 3- 4 Photoreactor and the wavelength of UV-lamp is 305 nm in our study...33
Figure 3- 5 A flow diagram for photocatalysis of EDCs. ...34
Figure 4- 1 XPS spectra of TOPO-capped TiO2.. ……….35
Figure 4- 2 FTIR spectra of TOPO and TOPO-capped TiO2...36
Figure 4- 3 The TGA curve of TOPO-capped TiO2...37
Figure 4- 4 The XRD pattern of TOPO-capped TiO2. ...38
Figure 4- 5 HRTEM image of TOPO-capped TiO2. ...38
Figure 4- 6 UV-Vis absorption spectrum of TOPO-capped TiO2. ...39
Figure 4- 7 Zeta potential of TOPO-capped TiO2 and mix with phenol and BPA solution..41
Figure 4- 8 Zeta potentials after photodegradation of phenol or BPA by TOPO-capped TiO2. ...41
Figure 4- 9 Partition equilibriums for (a) phenol, (b) BPA and (c) estrone on TOPO-capped TiO2 at 25 °C...44
Figure 4- 10 Partition equilibriums for phenol (20 ppm), BPA (20 ppm) and estrone (5 ppm) on Degussa P25...45
Figure 4- 11 Partition activity for (a) phenol, (b) BPA and (c) estrone in the presence of TOPO-capped TiO2...47
Figure 4- 12 Partition activity for phenol (a), BPA (b) and estrone (c) in the presence of Degussa P25...47
Figure 4- 13 EPR spectra of the radicals formed upon irradiation of UV and/or microwave of photocatalysts at room temperature...52
Figure 4- 14 EPR spectra of the radicals formed upon irradiation of UV and/or microwave of photocatalysts at 77K...53
Figure 4- 15 EPR spectra of radicals formed contained hole scavenger, DMPO, upon UV irradiation at room temperature. ...54
...59 Figure 4- 17 Time courses of photodegradation of BPA with TOPO-capped TiO2 and P25.
...60 Figure 4- 18 Time courses of photodegradation of estrone with TOPO-capped TiO2 and P25.
...64 Figure 4- 19 Time course of photodegradation in the presence of two kinds of EDCs with TOPO-capped TiO2 for mixing (a) phenol (10ppm) and BPA (10ppm), (b) phenol (10ppm)
Table Index
Table 2- 1 Surface modification of TiO2 and its advantages...13
Table 2- 2 Photocatalytic degradation of phenol with modified TiO2. ...18
Table 2- 3 Photocatalytic degradation of BPA with TiO2. ...21
Table 3- 1 The structures of chemicals used in this study...24
Table 4- 1 Particle size distribution of TOPO-capped TiO2 in EDCs solution. ...42
Table 4- 2 The log Kow value and partition coefficient for phenol, BPA and estrone with TOPO-capped TiO2 and P25...49
Table 4- 3 The intensities of Ti4+-O--Ti4+-OH- obtained from the integrations of the spectra. ...52
Table 4- 4 The intensities of the Ti4+-O2- on anatase obtained from the integrations of the spectra. ...53
Table 4- 5 The intensities of DMPO-OH· obtained from the integrations of the spectra. ....54
Table 4- 6 Apparent initial rates (ppm×g×min-1×m-2) of various initial concentrations for phenol degradation with TOPO-capped TiO2 and P25 and the kinetic rates constant and partition coefficients for Langmuir-Hinshelwood model. ...61
Table 4- 7 Apparent initial rates (ppm×g×min-1×m-2) of various initial concentrations for BPA degradation with TOPO-capped TiO2 and P25 and the kinetic rate constants and partition coefficients for Langmuir-Hinshelwood model. ...62
Table 4- 8 Apparent initial rates (ppm×g×min-1×m-2) of various initial concentrations for estrone degradation with TOPO-capped TiO2 and P25. ...65
Table 4- 9 Apparent initial rates (ppm×g×min-1×m-2) of various initial concentrations for competitive degradation with TOPO-capped TiO2. ...68
Chapter 1. Introduction
1.1 Motivation
Over the past decades, considerable studies have been devoted on endocrine disrupting chemicals (EDCs). The presence of EDCs in the environment may disrupt the normal functions of the endocrine system in the wildlife and human health. There is sufficient evidence to believe that EDCs could impact: (a) mimicking and antagonizing of normal hormonal activity, (b) the effect of metabolism and abnormal of sexual development, (c) modifying hormone receptor levels. Some of these chemicals can cause the feminization of fish, sex transposition of wildlife, and hormone-related cancers in humans.1-5 Environmental scientists concern to develop the effective treatment method for removal of EDCs.
Many researches showed that the traditional water and wastewater treatment plant (WWTP) is not efficient for removing EDCs. Wasteroff and Nakada et al. reported that combination of 5 mg/l of activated carbon, ozonation and sand filtration in the WTP can improve the removal efficiency.1, 6, 7 Moreover, TiO2-based photocatalysis attracts much
attention on elimination of the hazardous chemical wastes because it is non-toxicity, low cost, high reactivity, photochemical stability, suitable excited energy.8-10 Ohko et al.11 decomposed BPA using TiO2 and found that the photocatalysis reduced the estrogenic activity
without generating secondary pollutants. In recent years, surface modification of TiO2
surface with surfactants has proved to have advantage to enhance the photoactivity. Kurinobu et al.12 decomposed methylene blue, red basic dye, blue basic dye, nonylphenol, and octylphenol by adsorption and photocatalytic reaction with magnetic photocatalyst. Kohtani et al.13 enhanced the adsorption capacity and photocatalytic efficiency of 4-n-octylphenol by Ag loaded on BiVO4 photocatalyst. Silica-immobilized polyoxometalate
degrade the 4-nonylphenol polyethoxylate efficiently.15 The most likely explanations of the high photocatalytic efficiency of the modified TiO2 are (a) to increase the adsorption ability
of TiO2 surface;16-20 (b) to maintain well dispersed TiO2 nanoparticles;21 (c) to inhibit charge
recombination;22-24 (d) to cause the red shift of photocatalysts.20, 22, 25, 26
Chang and Doong27 have successfully synthesized the surface-modified Zr-doped TiO2
nanoparticles by a non-hydrolytic sol-gel process (NHSG) and demonstrated high photocatalytic activity for decomposition of RhB. The NHSG process can obtain the well crystalline phase, controlled particle size and well distribution of metal oxides.28 However, there are few studies discussing the photocatalytic activity with respect to the adsorption behavior induced by hydrophobic/hydrophilic charaters between EDCs and the modified TiO2 so far. In addition, the effect of the surface modifier, TOPO, on the inhibition of
charge recombination is not clear yet.
1.2 Objectives
This research have successfully synthesized the trioctylphosphine oxide (TOPO) modified titania via NHSG process. This study presents the EDCs partition and photocatalysis kinetics on TOPO-capped TiO2 and compared with Degussa P25. (Figure 1-1)
Thus, the mechanism of photocatalysis by TOPO-capped TiO2 illumination needs to be
identified. The dominant rate-limiting step of the photodecomposition is investigated in this study. Moreover, many organic chemical-modification of TiO2 surface will be damaged
after photocatalysis. Then, calculate and compare the surface quantities ratio of carbon and phosphorous atoms before and after photocatalysis.
cb
vb
e-h+
h+
hν
O
2O
2·
-OH
-H
2O
·
OH
cb
vb
e-h+
h+
hν
O
2O
2·
-OH
-H
2O
·
OH
Chapter 2. Background and Introduction
2.1 Photocatalysis
2.1.1 Principle of photocatalysis
The treatment technique of waste water and air by semiconductor photocatalysis is a new milestone in this century. They aim to enhance the efficiency of treatment of environmental pollutants. We can use metal oxides (TiO2, ZnO, ZrO2 and CeO2) and metal
chalconides (CdS, ZnS) as our photocatalysts to degrade the organic compounds in waste water by photocatalytic degradation processes.10, 14 The most widely used photocatalyst, TiO2, has high photo-efficiency, low cost and environmentally friendly.9, 29 Recently,
photocatalysis of TiO2 materials have been focused on the purification of air and water,
sterilizing and offensive odor.30
When the energy of photon is equal to or higher than the band gap energy of semiconductors, the semiconductors will photogenerate the electron and hole pairs. Electrons are excited from the valence band of the irradiated particles to its conduction band with simultaneously leaving holes in the former. The electron and hole can recombine on the surface or in the bulk of the catalyst in few nanoseconds. Furthermore, the generated electron and hole can easily and quickly migrate to the surface. In this photocatalytic (redox) reaction, these charges can directly react with organic pollutants adsorbed or close to the surface of the particles. An electron transfer proceeds towards acceptor molecules, whereas positive holes are transferred to donor molecules. Holes in the valence band may react with OH- and H2O molecules adsorbed at the semiconductor surface to produce hydroxyl radicals
(·OH). In addition, the conduction band is negative enough to reduce adsorbed oxygen to form superoxide radicals (O2·-), that can further disproportionate to form ·OH through various
pathways. The redox reactions resulting from the hole-electron pairs at the surface of the semiconductor can then convert organic compounds into oxidized or reduced products.
Finally, the mineralization of organic pollutants to CO2, H2O and mineral acid is achieved by
radicals attack. (Figure 2-1)8, 10, 31-34.
cb vb e-h+ h+ +3.1eV -0.1eV Redox Potential O2 O2
·
-OH -H2O·
OHhν
Figure 2- 1 Reaction diagram of photocatalysis at a semiconductor by illumination.
The steps representing the proposed mechanisms can be expressed by following set of simplified equations:31
Band gap illumination (hν) onto a photocatalyst causes the electronic transitions.
TiO2
⎯
⎯→
ν
h
TiO2 (e- and h+ pairs)
Photogenerated holes oxidize the adsorbed water and OH-. h+ + H2Oads → ·OH ads + H+
h+ + OH-ads → ·OH ads
Photogenerated electrons react with adsorbed O2.
e- + O2ads + H+ → HO2· ⇔ O2·- + H+
H2O2 + O2·- → ·OH + O2 + OH-
H2O2 + hν → 2·OH
H2O2 + e- → ·OH + OH-
The overall photocatalytic reactions.
Organic pollutants + O2
⎯
⎯
⎯
⎯
⎯
→
ysis photocatal
CO2 + H2O + mineral acid
2.1.2 Photocatalysts
Numerous photocatalysts, including TiO2, ZnO, ZnS, WO3, CdS and SnO2, have
recently been investigated for the destruction of organic containments in global water and air pollution,. Figure 2-2 shows the band edge position of various semiconductors. From the available semiconductors, TiO2 has received much attention and been frequently utilized due
to their exceptional electronic and optical properties, high photocatalytic activity, chemical stability, non-toxicity, low cost and suitable band gap energy with wavelength less than 400 nm.8-10
TiO2 has three kinds of crystal phases, anatase, rutile and brookite. The commonly
used phases are anatase and rutile, as displayed in Figure 2-3. Anatase is a metastable phase which can transfer to rutile phase above 550 °C. The band gap energies of anatase and rutile are 3.2 eV and 3.0 eV respectively. Generally, anatase has several advantages in the photocatalytic region, including low h+-e- recombination possibility, more surface adsorbed water and hydroxyl groups, larger surface area than rutile, which can enhance the photocatalytic efficiency, obviously. Comparatively, rutile is less active. However, the Germany Company Degussa, they mixed 80% anatase and 20% rutile to produce P25, are contributing to excellent photocatalytic activity. Nowadays, P25 is a mostly widely used photocatalyst. For P25, it has band gap around -0.3 eV to +2.9 eV.9, 31, 32, 35
Figure 2- 2 The redox potentials of various semiconductors related to the energy levels.32
2.2 Sol-gel method
2.2.1 Hydrolytical Sol-Gel process
The sol-gel method is a versatile process and comprehensively utilized in making various nanostructure materials. In a typical synthetic procedure, the colloidal sol suspension is formed from the hydrolysis and polymerization reaction of the precursors which usually are metal salts and metal alkoxides. In general, sol-gel method exhibits a distinct advantage in several folds: (1) the process can be carried out at room temperature (2) easily control the morphology of the materials (3) highly regular and homogeneous materials (4) low costs. As a result of above advantages, the sol-gel can be one of the candidates of preparing nanostructure materials.
Figure 2-4 represents the typical process of sol-gel method as follows. First of all, the precursors dissolving in water rapidly hydrolyze and condense subsequently. Eventually, the polymerization and gelation of the condensed intermediates lead to the formation of the colloidal gel.36-38
Hydrolysis
Polycondensation
M Cl Cl Cl Cl+
4 HOH M+
OH OH OH HO 4 HCl M Cl Cl Cl Cl+
4 HOH M+
OH OH OH HO 4 HCl M OR OR OR RO+
4 HOH M+
OH OH OH HO 4 HOR M OR OR OR RO+
4 HOH M+
OH OH OH HO 4 HOR+
M OH OH HO M OH OH HO+
M M OH HO OH OH OH OH O+
HOH M OH OH HO M OH OH HO+
M M OH HO OH OH OH OH O HOHGelation
Figure 2- 4 Hydrolytic sol-gel process.
2.2.2 Non-Hydrolytic Sol-Gel process
Using non-hydrolytic sol-gel method can get the homogeneous multicomponent oxides, such as Al2TiO5 and ZrTiO4. Moreover, the organic and inorganic molecules can be
hybridized with NHSG method.37-43
The considerable purpose of non-hydrolytic sol-gel method is devoted to synthesize the dispersible TiO2 nanoparticles. Figure 2-5 shows the synthesis mechanism of TiO2 with
NHSG process. The major reactions under 80 to 150 °C could be thermal condensation or etherolysis. Thermal condensation occurs between metal chlorides and metal alkoxides, more exactly, the lone pair of electrons from alkoxyl oxygen will move to metal center, and followed by the cleavage of halide and alkyl groups. On the other hand, etherolysis forms the alkoxide function groups between metal chlorides and ether. Both reactions form metal oxide and alkyl halides. If the temperature is low (ambient temperature), ligand exchange between metal chlorides and metal alkoxides will take place. 37, 39, 40, 42-44
However, there are several differences between conventional sol-gel process and non-hydrolytic sol-gel route. Two reasonable consider seem to be helpful to elucidate: (a) homogeneous metal oxide can be synthesized at low temperature; (b) increasing the thermal stability; (c) enhancing the crystalline growth; (d) to control the crystalline size; (e) to prepare the dispersible powders.37, 39, 40, 43
+
M M OH HO OH OH OH OH O M M OH HO OH OH OH OH O M M M M OH HO OH OH OH OH OH O O O O HO+
M M OH HO OH OH OH OH O M M OH HO OH OH OH OH O M M M M OH HO OH OH OH OH OH O O O O HOCondensation
M-OR + M-X M O R M X M-O-M + R-X M-OR + M-X M O R M X M-O-M + R-X
Etherolysis
Ligand Exchange (redistribution)
M-Cl + M-OR M-OR + M-ClM-Cl + M-OR M-OR + M-Cl
Figure 2- 5 Synthesis mechanism of TiO2 by NHSG.45
M-Cl + R-O-R M-OR + R-Cl M-Cl + R-O-R M-OR + R-Cl MCln+ n/2 R-O-R MOn/2 + n R-Cl MCln+ n/2 R-O-R MOn/2 + n R-Cl MCln+ M(OR)n 2 MOn/2 + n R-Cl MCln+ M(OR)n 2 MOn/2 + n R-Cl
2.3 Surface Modification
In the recent years, TiO2 has been the most extensive and intensive investigated
nanomaterials, because it can eliminate pollutants chemicals in air, solid and water environments. Large effort has been devoted to improve the photocatalytic activity, determine their chemical composition, surface characteristics, and physical properties. Many efforts have been focused on surface modification technologies in order to enhance photocatalytic efficiency and perform widely applications, including doping impurities, coupling with metal oxide, and coating with organic or inorganic compounds and treating TiO2 with acid.
Several researches may consider the purposes of the modified TiO2 under the following
heads: (a) to increase the surface coverage of target compounds onto TiO2 surface;16-20 (b) to
avoid agglomeration of TiO2 powders;21 (c) to inhibit the recombination of electrons and
holes;22-24 (d) to expend the wavelength response range;20, 22, 25, 26 (e) to control the structural properties,46-49 and (f) to greater control the resulting photoproducts. For these reasons, surface modifier systematically shows the important role in the photocatalytic reaction. Table 2-1 summarizes using organic molecule modified TiO2 surface has proved highly
effective in the photodegradation ability of target compounds.
Compared with the unmodified TiO2, surface modification of TiO2 by pseudo-boehmite
and salicylic acid proved to be the higher amount of bromate and 4-chlorophenol adsorbed than unmodified TiO2. Subsequently, the degradation efficiencies by TiO2 could be
enhanced after surface modification.18, 20 Surfactant cover can make TiO2 surface
hydrophobic and enhance the adsorption of hydrophobic organic compounds (HOCs) on the surface. Yuan and Ravikrishna et al. found that fluorocarbon-based surfactant, potassium perfluorooctylsulfonate (PFOS) on to TiO2 surface acts to promote the adsorption and
degradation of 1,2-dichlorobenzene (DCB). However, sodium dodecylsulfate (SDS) may competitively decomposed with DCB, lead to decreasing the photocatalytic ability.19 Yu et al. were covered thin layer of carbon on ST-01 particles, namely carbon-coated anatase.
After 900 °C treated catalysts, pyrone-like basic structures have been formed on the surface and performed the higher phenol adsorption and photodecomposition.17
Surface modification method of titanium dioxide (TiO2) can prevent irreversible
agglomeration, and obtain the well-dispersed TiO2 nanoparticles. When the calcination
temperature up to 760 °C, surface modifier, diethylene glycol monomethyl ether, suppressed the sintered nanoparticles and the particle size maintained lower than 50 nm.21
On the other hand, more and more studies have been published that organic modification on TiO2 surface can expand the absorption wavelength into visible region.20, 22, 25, 26 For
example, TiO2 modified with ascorbic acid, photoinduced electrons can migrate from
modifier to the conduction band of TiO2 by visible light illumination. This photocatalyst
can inhibit the charge pair recombination, and then enhance the methyl orange photocatalytic decolorization rate.22, 25 The -NCO groups of tolylene diisocyanate (TDI) react with the surface hydroxyls of TiO2 to form TDI-modified TiO2 nanomaterials. The photocatalytic
efficiency increased with increasing the TDI content.26
Korosi et al. founded that phosphoric acid modifier affects the surface area, pore volume and pore size of titanium dioxidematerials.46, 47 PO43- ions are bonded to the surface of
titanium dioxide, and the surface hydroxyl groups may react with the phosphate ions, leading to cross-linking. The phosphorus was chelated to the framework of TiO2 particles and
formed Ti-O-P bonds. Additionally, phosphate ions incorporated with TiO2 has high
thermal stability at high temperature treatment. Moreover, thermal stability plays an important role in the crystalline growth during the calcination process which can effectively prevent condensation and inhibit the growth of crystals.48 The surface area and pore volume of phosphate-modified TiO2 particles increased and crystalline size decreases with increasing
phosphate content. Quantum crystal TiO2 with intrinsically wider range of adsorption edge
can be observed after phosphoric acid treatment. However, the larger specific surface area may promote the photodegradation of target molecules.46, 47, 49
Table 2- 1 Surface modification of TiO2 anditsadvantages.
Advantages Surface
modifier
Objective
Reference
Pseudo-boehmite Increase in the amount of
adsorbed BrO3- on the
photocatalyst surface.
Noguchi et al.18
Salicylic acid Improve the surface coverage
of 4-nitrophenol.
Li et al.20
3-aminopropyl- triethoxysilane
Adsorption of C.I. Acid Orange 7 on TiO2 surface.
Andrzejewska et al.16
Carbon Adsorption of phenol onto
carbon layer coating anatase particles.
Tryba et al.17
PFOS and SDS Enhance 1,2-dichlorobenzene
adsorption and degradation.
Yuan et al.19
Adsorption
Arginine Enhance nitrobenzene
adsorption and decomposition.
Makarova et al.24
Trifluoroacetic acid Reduce the electron-hole recombination.
Yu et al.23
Ascorbic acid Enhance the generation of
superoxidesand and occur on the surface modified TiO2 with
AA.
Ou et al.22
Charge recombination
Arginine Facilitate the transfer of
photogenerated electrons from the TiO2 conduction band to
the adsorbed nitrobenzene.
Dispersed capacity
Diethylene glycol monomethyl ether
Simakov et al.21
Ascorbic acid The incident-photon-to-current
efficiency presents at 415 nm.
Xagas et al.25
Ascorbic acid Enhancing utilization of the
solar spectrum.
Ou et al.22
Tolylene diisocyanate (TDI)
Under visible light irradiation. Jiang et al.26
Red shift
Salicylic acid Absorption in the region from
320 to 420 nm.
Li et al.20
Thermal stability Phosphoric acid The specific surface area
increases with increasing phosphate content at a given calcination temperature.
2.4 Endocrine Disrupting Chemicals
Several types of environmental pollutants referred to as endocrine disrupting chemicals (EDCs) at listed by Environmental Agency of Japan. A wide range of pollutants present in the industrial effluent containing EDCs, such as pulp and paper mill, dye industry, pharmaceuticals, and detergent metabolites has been detected in the rain, lakes, ground water, coastal zones and ocean. The presences of EDCs are accumulated in rivers and oceans, and possible impact on wildlife and human health even at low concentration. These pollutants cause the mimicking and antagonizing of normal hormonal activity, the effect of metabolism and abnormal of sexual development. Moreover, the endocrine effects for humans are including decrease the sperm count and quality in male and increase frequency of breast cancer in women.2, 4, 5, 7, 50-53
For example, 1950s in Great Lakes in North America, researchers found 100% of thyroid enlargement in 2-4 years old salmon and high prevalence of acceleration of sexual maturation.4 Female mosquito fish in the paper mill effluent became to male specific gonadopodia and other species.54
In this research, we choose three kinds of endocrine disrupting chemicals (EDCs) as our target compounds, phenol, BPA and estrone. Recently, BPA is widely applied in various polycarbonate plastics, poly(vinylchloride) (PVC), epoxy resins such as the inner coating of food cans, powder paints, plastic containers, dental fillings and baby bottles. The harmful compounds, BPA, can be released during autoclaving and lead to human exposure to BPA. Furthermore, EDCs can accumulate in the surrounding ecosystem, and the effective treatment technologies of EDCs are required urgently.51, 55-58
The limitations of EDCs discharge in the industrial effluent and municipal sewage have been monitored and controlled. In America, the scientists have confirmed that EDCs may disrupt endocrine and affect estrogenic activity. The government order to forbid using pesticides containing lindane. In Europe, they also forbid using pesticides and cleansers contained environmental hormones. In Japan, they don’t use the plastics manufacture by
polyvinyl chloride (PVC).
2.5 Photocatalytic Degradation for EDCs
Many pollutants have been used in industrial advances and these may cause effects severely to environmental living organisms. Recently, the use of heterogeneous photocatalytic reaction of organic pollutants is a promising and emerging treatment for effluent decontamination since the conventional biological treatment processes are not effective. Photocatalytic processes take place when the semiconductor adsorbs enough energy to excite electrons and holes. Then, the formation of ·OH radicals behave strong oxidants, which can decompose pollutants into non-toxic then mineralizes to carbon dioxide finally.55, 59-61
2.5.1 Photocatalytic degradation technology for phenol
Table 2-2 shows the photodegradation of phenol using modified TiO2. Several
tradition ions modified TiO2 were observed to encourage the photoactivity of phenol in
water.59, 62, 63 For examples, surface modification methods including platinum doping and photodeposition of metal silver on TiO2 can act as trapping sites to efficiently suppress the
charge recombination and increase the photoactivity.59, 64 Using iron as dopant can increase photocatalytic degradation of phenol in domestic water suspensions.62, 63 The co-doped Zr and Fe TiO2 samples enhance thermal stability and reduce the crystalline size after annealing.
Moreover, the dopants arrange randomly on the TiO2 surface, the band poison can separate
the charge carrier significantly.63
Further, the photo-Fenton reactions is meaning that H2O2 and Fe2+ react to form ·OH,
OH- and Fe3+. Then, the photoexcited electron affords to Fe3+ to become Fe2+ from semiconductor, and this process can start again.65, 66 Tryba et al. have been found that the addition of H2O2 in the photocatalytic system, the Fe-modified carbon-coated TiO2 and
sulfuric and phosphoric acid pre-treatment TiO2 has higher thermal stability lead to hinder
anatase-rutile conversion and relatively high surface area.67
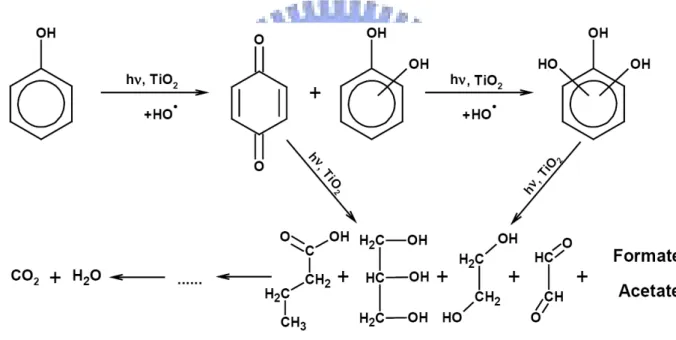
Figure 2-6 suggests the photocatalytic decomposition pathway of phenol and generated intermediate products. Under photocatalysis, the ·OH are a powerful oxidant to attack phenol, then the ring has been opened, causing hydroquinone (HQ), benzoquinone, catechol (CC) and some organic acids. And, finally the complete mineralization is achieved to CO2
and water.29, 68
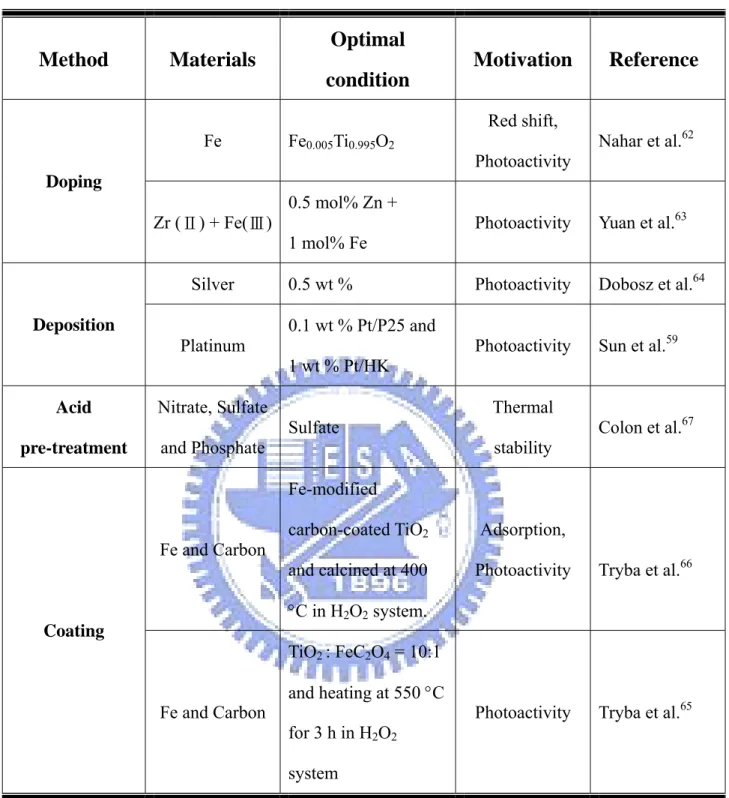
Table 2- 2 Photocatalytic degradation of phenol with modified TiO2.
Method Materials
Optimal
condition
Motivation Reference
Fe Fe0.005Ti0.995O2 Red shift,Photoactivity Nahar et al.
62
Doping
Zr ( ) + Fe( ) Ⅱ Ⅲ
0.5 mol% Zn +
1 mol% Fe Photoactivity Yuan et al.
63
Silver 0.5 wt % Photoactivity Dobosz et al.64
Deposition
Platinum 0.1 wt % Pt/P25 and
1 wt % Pt/HK Photoactivity Sun et al.
59
Acid pre-treatment
Nitrate, Sulfate
and Phosphate Sulfate
Thermal
stability Colon et al.
67 Fe and Carbon Fe-modified carbon-coated TiO2 and calcined at 400 °C in H2O2 system. Adsorption,
Photoactivity Tryba et al.66
Coating Fe and Carbon TiO2 : FeC2O4 = 10:1 and heating at 550°C for 3 h in H2O2 system
2.5.2 Photocatalytic degradation technology for BPA
Many researches have been reported to improve the photocatalytic efficiency of BPA (Table 2-3). The following serves as several examples:
At acid situation (pH 3), the BPA molecules are the un-ionized form and the TiO2
surface exhibits positive charge. BPA could be more easily adsorbed onto TiO2 surface and
could be decompose by adsorbed radicals. On the contrary, even, the TiO2 surface
concentration of [·OH] increases with [H+] concentration increasing in the alkaline situation. But, BPA can’t be adsorbed on the catalyst surface and attacked by the surface ·OH. Therefore, in the acidic condition, the photoefficiency of optimum platinum loading (between 0.2 wt % and 1.0 wt %) is 3-6 times faster than that of bare TiO2.55, 60
Impurities other than titanium were mostly used to dope into the lattice of TiO2 to
increase the photoactivity. Doping metals such as Mg2+ and Ba2+ can replace the Ti4+ space, and provide an additional energy level. Mg2+ and Ba2+ loadings can decrease the particle size and enhance the adsorption of BPA on the TiO2 surface. However, according to the
quantum size effect, the entry of Mg2+ in the crystalline structure suppresses the crystal growth and consequently increases the photoinduced wavelength. Besides, the Ba2+ ionic radius (1.49 Å) is larger than Ti4+, the BaCO3 on the external surface of TiO2 is established.
Further, the carbonate layer can adsorb BPA via hydrogen bonds and lead to higher adsorption ability. It’s clearly explained that photocatalytic degradation of BPA with Mg2+ and Ba2+ doped TiO2 nanoparticles has higher efficiency than both pure TiO2 and Degussa
P25.69
Several novel metals and transition metals (Au, Ag and Pt) have been deposited on the surface of TiO2 powder can induce Schottky barrier effect to help the electron redistribution
and prevent the electron-hole recombination rate. It can be expected to be an effective treatment technology for removing BPA from waste water.61, 70-72
Photo-fenton process for wastewater treatment has been developed for the degradation of BPA by mixing Fe2+ and H2O2.73 Ioan et al. found that sono-fenton can produce
more ·OH radicals in the ultrasonic physical and chemical processes, then enhance the photocatalysis of BPA.74
During photooxidation of BPA, the intermediates including 4-isopropylphenol (m/z = 135), 3-(4-hydroxyphenyl)-3-methyl-2-oxobutanoic acid (HPMOBA, m/z = 208), 4-vinylphenol (VP, m/z = 134) and 4-hydroxyacetophenone (HAP, m/z = 136) can be identified by LC/MS and summarized the photodegradation mechanism in Figure 2-7. Then, the formic acid and acetic acid were produced and CO2 gas evolution finally.11, 58
Table 2- 3 Photocatalytic degradation of BPA with TiO2.
Methods Reference
TiO2 coated on glass tubes Lee et al.50
Photodeposition of silver and
platinum Coleman et al.
70
Au-TiO2/ITO Li et al.71
Pt-loaded TiO2 Zhang et al.60, 61
Mg2+ and Ba2+ doped TiO2 Venkatachalam et al.69
Photocatalysis
Addition of H2O2 in Au-TiO2/Ti
system (electron scavengers) Xie et al.
72
Addition of β-cyclodextrin in reaction system
(adsorption ability) Wang et al.
55 Fenton-process Katsumata et al.73 Ioan et al.74 Degradation Method
Ultrasonic destruction Gultekin et al.75
2.5.3 Photocatalytic degradation for estrone
The estrone (E1) and 17β-estradiol (E2) were affected by several parameters such as initial concentration of pollutants, pH value, ionic strength and the presence of humic acid and H2O2 obviously.76, 77 Humic acid can competitively adsorb on the surface of TiO2,
leading to accelerate of the electronic energy transfer from humic acid to E1 and E2. Hydroxyl radicals attack, photogenerated electrons and holes attack directly will be affected the photoefficiency, depending on the initial pH value.78 They calculated that E1 and E2 have the best performance at optimum pH value of 7.6.77
Estradiol (E2), estrone (E1) and estrogen conjugates (estradiol-3-glucuronide (E23G),
estradiol -17-glucuronide (E217G), estrone-glucuronide (E1G), estrone-sulfate (E1S) and E3
3-sulfate 16-glucuronide (E33S16G)) were subjected to photocatalytic degradation by TiO2
immobilized on glass beads as a photocatalyst. The glucuronic acid moiety on the skeleton and sulfonic acid moiety at the phenolic hydroxy group may accelerate the degradation rate. Thus, E23G, E217G, E1G and E33S16G are degraded faster than E2 and E1.79
After 7 minutes photocatalysis, the photodegradation efficiency of estrone reached 50% and 100% removal within 1 hour. Under UVA illumination for 360 minutes, estrone has been photolyzed totally.80
Chapter 3. Experimental Materials and Methods
3.1 Chemicals
Titanium isopropoxide (TTIP, Ti(OC3H7)4, 98+ %) and titanium chloride (TiCl4, 99.9 %)
were used as the titanium precursors and obtained from Acros Organics and Showa Chemicals, respectively. Trioctylphosphine oxide (TOPO, [CH3(CH2)7]3PO, 99 %, reagent
plus; melting point: 50-52 °C) is supplied by Strem Chemicals. TOPO is moisture sensitive and need to be stored in a glove box.
Three kinds of endocrine disrupting chemicals including phenol (99.5 %, Riedel-de Haen Company), bisphenol A (BPA, 99+ %, Sigma-Aldrich Chemical Co) and estrone (99.5 %, Riedel-de Haen Company) were chose as target pollutants. The P25 photocatalyst (surface area: 50 m2/g, 80% anatase and 20% rutile, size: 30 nm), was purchased from Germany Company Degussa. Acetonitrile in analytic grade was purchased from J. T. Baker Co. All chemicals were used without further treatment and their structures were shown in Table 3-1.
Table 3- 1 The structures of chemicals used in this study.
Chemical Structure
Trioctylphosphine
oxide
P OTitanium chloride
Ti Cl Cl Cl ClTitanium
isopropoxide
Phenol
OHBPA
HO C OH CH3 CH3Estrone
O HOCharacterization
Preparation of TOPO-capped TiO
2nanocrystallites
Adsorption
Chemical
composition
Microstructure
Electronic
structure
Photocatalysis
HPLC
Results and Discussion
Conclusions
Adsorption
ability
Chemical
composition
XPS
Photocatalytic
efficiency
XPS, FT-IR, TGA, EPR, Zeta Potential BET, XRPD, HR-TEMUV-Vis EDCs EDCs
Characterization
Preparation of TOPO-capped TiO
2nanocrystallites
Adsorption
Chemical
composition
Microstructure
Electronic
structure
Photocatalysis
HPLC
Results and Discussion
Conclusions
Adsorption
ability
Chemical
composition
XPS
Photocatalytic
efficiency
XPS, FT-IR, TGA, EPR, Zeta Potential BET, XRPD, HR-TEMUV-Vis EDCs EDCs
3.2 Preparation of TOPO-capped TiO
2with NHSG method
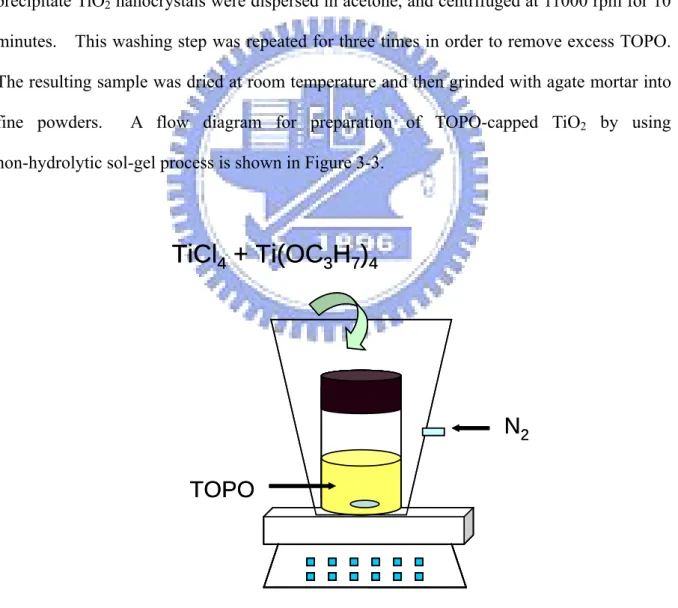
TOPO-capped TiO2 are prepared by non-hydrolytic sol-gel process. TOPO (5.22 g, 13.5
mmol) was melted at 80 °C. By syringe, 0.2744 ml (2.5 mmol) of titanium chloride and 0.7633 ml (2.5 mmol) of Ti(OC3H7)4 were injected into the dissolved TOPO. The
suspensions were heated to 150 °C at 500 rpm and kept for 15 minutes. Following, the well mixed solution was heated to 400 °C under N2 atmosphere and maintained for 3 hours. The
procedure for preparation of the TiO2 nanoparticles was illustrated in Figure 3-2. When the
synthesis was completed, the solution became milk-white, then cooled down to 80 °C. The precipitate TiO2 nanocrystals were dispersed in acetone, and centrifuged at 11000 rpm for 10
minutes. This washing step was repeated for three times in order to remove excess TOPO. The resulting sample was dried at room temperature and then grinded with agate mortar into
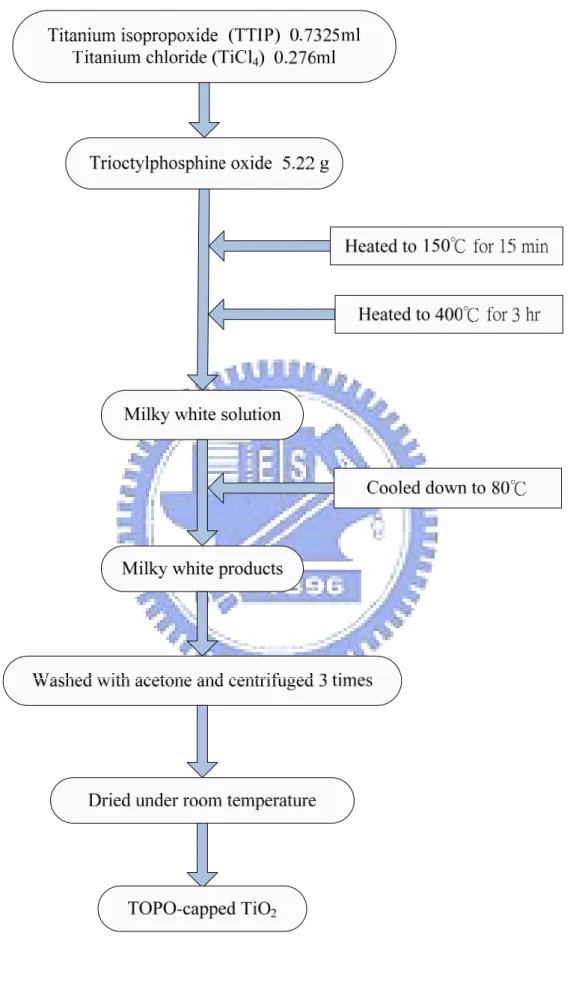
fine powders. A flow diagram for preparation of TOPO-capped TiO2 by using
non-hydrolytic sol-gel process is shown in Figure 3-3.
TOPO
N
2TiCl
4+ Ti(OC
3H
7)
4TOPO
N
2TiCl
4+ Ti(OC
3H
7)
43.3 Characterization
3.3.1 X-ray powder Diffractometer (XRPD)
The crystal structure and grain size were examined by X-ray powder Diffractometer (XRPD, Rigaku XRD) using CuKα radiation (λ = 1.5405 Å). The operating conditions are at an emission voltage of 30 kV and an emission current of 20 mA. XRPD patterns were obtained between 20∘and 90 2θ range at sample width of 0.02 with scan speed of ∘ ∘ 4 /min. The diameter of the crystal was estimated using ∘ Scherrer’s equation81
θ β λ cos K D= D: crystalline size K: shape constant, 0.89
λ: wavelength of X-ray source (Cu kα = 0.15406 nm) β: full width at half-maximum (FWHM)
θ: scattering angle
3.3.2 High Resolution Transmission Electron Microscopy (HR-TEM)
The morphology and particle size of the NHSG-derived TiO2 were identified using high
resolution transmission electron microscopy (HR-TEM, JEOL JEM-2010) operated at a 200 kV accelerating voltage. Suitable transmission specimens were prepared by ultrasonic vibration to disperse TOPO-capped TiO2 in acetone. And a drop of the suspension was
directly on TEM Cu grids.
3.3.3 X-ray photoelectron Spectroscopy (XPS)
characterized by X-ray photoelectron spectroscopy (XPS, Physical Electronics, ESCA PHI 1600) using an Al Kα X-ray source (1486.6 eV). The pressure in the analysis chamber was maintained less than 1.4
×
10-9 Torr during all analytical process. The photoelectron was collected with pass energy of 23.5 eV. The collection step size in wide range scan and high-resolution scan analysis are 1.0 eV and 0.1 eV, respectively. In order to quantify and qualify of each element, the curves were fitted by using XPS fitting programs. After performing a subtraction of the “Shirley-shaped” background, the original spectra were fitted using a nonlinear least-square fitting program and combination of Lorentzian and Gaussian lines of variable proportions. The binding energy (BE) scales for the TOPO-capped TiO2were referenced by setting the O (1s) line at 530.2 eV.
The integrated peak areas of spectra were calculated using sensitivity factors to determine the surface atomic ratios. The atomic ratio equation is in the following manner:
2 1
n
n
=
2 2 1/ASF
I
/ASF
I
=
2 2 1 1/ASF
A
/ASF
A
n: atomic number I: intensity of XPS spectra ASF: atomic sensitivity factor A: peak area of XPS spectra3.3.4 Specific Surface Area
The specific surface area of the TiO2 nanocrystals was calculated from
Brunauer-Emmett-Teller model based on the N2 adsorption and desorption isotherm at 77 K
by Micromeritics, ASAP 2020. Prior to N2 adsorption, the sample was pre-dried at 90 °C for
3.3.5 Fourier Transform Infrared Spectrometer (FTIR)
The surface functional groups of the TOPO-capped TiO2 nanoparticles were recorded
with Fourier Transform Infrared spectrometer (FTIR, HORIBA FT-720) scanning from 400-4000 cm-1. All spectra were collected at a resolution 4 cm-1 for 100 scans. Samples for FTIR measurement were mixed with KBr (sample: KBr = 1:99, weight ratio) and pressed as a wafer. Further, the spectrum of KBr is the background.
3.3.6 UV-vis Spectrometer
The wavelength response range of the TiO2 was estimated using UV-vis spectrometer
(HITACHI U-3010) using Al2O3 as reference. Absorption spectroscopy was carried out in
the wavelength region of 200-800nm. The band gap of the TiO2 was determined from the
onset of the absorption spectra which were obtained by conversion of the reflectance spectra using Kubelka-Munk equation.82
F(R) = 2R ) R -(1 2 = S κ . k: absorption coefficient S: scattering coefficient R: %R reflectance
3.3.7 Thermo gravimetric Analysis (TGA)
Thermo gravimetric analysis (TGA) of the nanoparticles was carried out on a TG 209 F1, NETZSCH, Germany. Samples placed in alumina crucibles were heated from 20 °C to a maximum temperature of 900 °C at a heating rate of 10 °C/min under 20 ml/min air flow rate. TGA provided information on weight variation during temperature increase. A weight loss of the sample results from the oxidation of sample to form volatile compounds.
3.3.8 Dynamic Light Scattering (DLS) and Zeta Potential
The hydrodynamic diameter was measured by Zetasizer nano series (Malven Company). In this measurement, sample preparation based on the experiment parameter. The solution containing photocatalysts (1mg/1ml) and target EDCs well mixed by ultrasonic vibration. The concentrations of phenol and BPA were 20 ppm, and that of estrone was 5ppm, whose have been used in this experiment.
The zeta potential of EDCs solution contained nanoparticles was measured by Zetasizer nano series (Malven Company). The concentration of catalysts in the solution was 1mg/1ml. In order to obtain the surface zero point charge of nanoparticles, we use NaOH (3 N) and HCl ( 3 N) to adjust the pH value of solution.
3.3.9 Electron Paramagnetic Resonance (EPR)
EPR spectra were recorded at the X-band with a Bruker EMX-10/12 spectrometer. The spectrum was recorded using following parameters: 5.02×10⁵ receiver gain, 2 G modulation amplitude, 3400-3510 G center field, 200 G sweep width, 9.2-9.8 GHz microwave frequency, and 50.0 modulation frequency. The difference of microwave frequency was related to the catachrestic nature of cylindrical quartz EPR tube. Each catalyst powder was placed in a cylindrical quartz EPR tube with 0.1 g of photocatalysts. Computer simulations were used when necessary to check spectral parameter. The catalyst suspension containing 1g/l or 10 g/l TiO2 and diluted water were filled in the quartz capillaries with 0.2 ml. To quantify the
concentration of hydroxyl radicals generated, signals of radicals spin-trapped with 5,5-dimethyl-1-pyrroline N-oxide (DMPO, Aldrich) were recorded EPR measurement. The 1 ml of 0.03 M DMPO solution was added into 10 ml TiO2 suspension. Photoirradiation of
the samples were carried out with a 500 W Xe lamp (Ushio Inc.) with central wavelength at 365 nm. EPR samples were analyzed at room temperature or 77 K.
3.4 Partition ability of EDCs
An aqueous suspension of EDCs (phenol, BPA and estrone) and TiO2 was contained in a
Pyrex glass vessel and was stirred for 30 minutes in the dark to permit the partition equilibrium to be reached. A 3 ml aliquot was taken at various intervals and centrifuged at 15000 rpm for 3 minutes immediately for separation of the suspended solids. Then, the supernatants were analyzed by HPLC measurement. In the partition isotherm experiments, the initial concentrations were adjusted to various concentrations (20-100 ppm for phenol and BPA and 1-5 ppm for estrone) and mixed with photocatalysts. Partition behaviors were obtained by mixing EDCs and 1mg/ml of TiO2 amounts and stirred 30 minutes. EDCs
solutions with initial concentrations ranging from 10 to 100 ppm were used to get the partition behaviors.
3.5 Photodegradation of EDCs
The experimental apparatus for the photodegradation of EDCs was shown in Figure 3-4. A quartz water-jacketed reactor was carried out under illumination of UV light at 305 nm. For safety reason, the reactor was completely surrounded by stainless steel. The solutions containing photocatalysts (1mg/ml) and target phenol, BPA or estrone were well mixed using ultrasonic bath. The photocatalytic decompositions of EDCs were investigated at room temperature by varying the initial concentration from 2.5 to 50 ppm. Before illumination, the suspensions were purged with oxygen and magnetically stirred in the dark for 30 min. The degradation efficiency was examined by analyzing the changes in the concentration of the EDCs at each time interval during photocatalysis. These samples were periodically sampled by withdrawing aliquots from the photoreactor; it was centrifuged at 15000 rpm for 3 minutes prior to analysis. These clean solutions were monitored by HPLC measurement.
Figure 3- 4 Photoreactor and the wavelength of UV-lamp is 305 nm in our study.
3.6 High Performance Liquid Chromatography (HPLC)
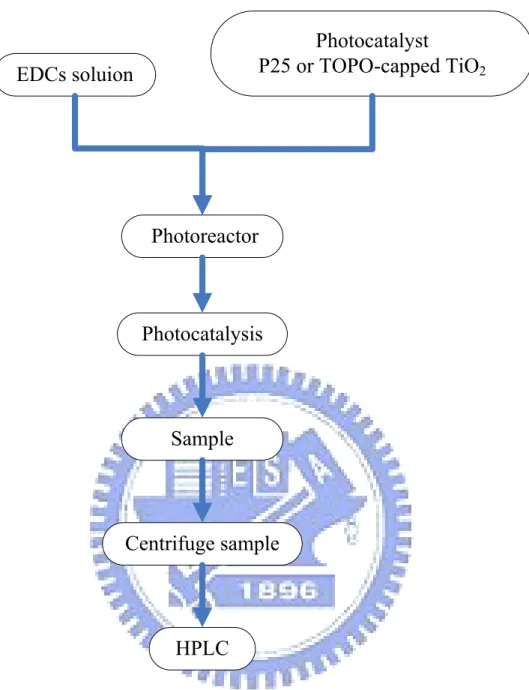
The concentration of EDCs (phenol, BPA and estrone) was analyzed by High Performance Liquid Chromatography (HPLC, Waters Alliance 2695) equipped with a Photodiode Array Detector (PDA, Waters 2996, 190-400 nm) at room temperature. The stationary phase is C18 (5μm, 4.6×250 mm) for phenol and BPA and dC18 (3μm, 2.1×20mm) column for estrone. The mobile phases for the phenol and BPA were methanol-water mixture (50/50, v/v) and acetonitrile–water mixture (50/50, v/v), respectively, at flow rate of 1.0 ml/min. Signals were detected at 280 nm. Methanol-water mixture at 50/50 volume ratio and flow rate of 0.6 ml/min with dC18 column was used for estrone analysis. Signals were detected at 195 nm. Figure 3-5 shows flow diagram of photocatalysis of EDCs in this study.
EDCs soluion
Photocatalyst
P25 or TOPO-capped TiO
2Photoreactor
Sample
Centrifuge sample
HPLC
Photocatalysis
Chapter 4. Results and discussion
4.1 Physicochemical properties of TOPO-capped TiO
24.1.1 Microstructures of TOPO-capped TiO
2The surface composition was examined using XPS. In addition to Ti(2p) and O(1s), P(2p) photoelectron peaks were also found in the XPS spectra (Figure 4-1), indicating the existence of TOPO on the TiO2 surface. FT-IR spectra of TOPO-capped TiO2 sample in the
900-1260 cm-1 region is shown in Figure 4-2. The pure TOPO molecules is characterized by P=O vibration frequency appearing strongly at 1148 cm-1. In the spectrum of the non-hydrolytic sol-gel-derived TiO2, there appeared a lower vibration frequency at 1085 cm-1.
It can be regarded that the TOPO is chelated to the TiO2 surface as P=O→Ti during NHSG
process at high temperature. The shift of the P=O absorption toward higher energy after modification is due to the strong interaction existing at the interface of TOPO and TiO2.
12000 1000 800 600 400 200 0 100 200 300 400 500 O Ti C Survey Intensity (cps)
Binding Energy (eV)
126 128 130 132 134136 138 140 142 144 146 148 1300 1400 1500 1600 1700 1800 1900 2000 2100 P(2p)
4000 3500 3000 2500 2000 1500 1000 500 0.0 0.5 1.0 1.5 2.0 2.5 3.0
-P=O
TOPO
TiO
2 -P=O..TiO 2Abso
rb
ence
(A
.U
.)
Wave numbers (cm
-1)
Figure 4- 2 FTIR spectra of TOPO and TOPO-capped TiO2.
Thermo gravimetric analysis (TGA) was applied to estimate the quantity of TOPO on the TiO2 surface. Figure 4-3 shows the TGA profile of TOPO-capped TiO2 sample. A total
weight loss of TOPO-capped TiO2 was 20.1 % from ambient temperature to 550 °C which
can be divided into two steps. The 4.01 % weight loss of the TOPO-capped TiO2 bellow
150 °C corresponds to removal of water. In the second step of weight loss suggests to the surface TOPO compound was completely decomposed at 550 °C. Moreover, 16.09 % of TOPO molecules are on the TiO2 surface.
0 100 200 300 400 500 600 700 800 900 80 85 90 95 100 105 TG ( %) Temperature (degree C) TOPO-capped TiO2 Mass Change: -4.01% Mass Change: -16.09% 0 100 200 300 400 500 600 700 800 900 80 85 90 95 100 105 TG ( %) Temperature (degree C) TOPO-capped TiO2 Mass Change: -4.01% Mass Change: -16.09%
Figure 4- 3 The TGA curve of TOPO-capped TiO2.
The crystalline properties of TOPO-capped TiO2 were determined by XRD (See Figure
4-4). The diffraction peak of (101) profile at 25.4 2θ indicates ∘ that the TiO2 sample is
mainly anatase form. From the broadness of the diffraction peak of TOPO-capped TiO2, the
average crystallite size calculated by Scherrer’s equation is 4.9 nm. The high resolution transmission electron micrograph, shown in Figure 4-5, indicates that TOPO-capped TiO2
sample have negligible agglomeration. TOPO-capped TiO2 sample were well crystallized
even for grains as small as 5 nm. There is no doubt that synthesis of metal oxide by non-hydrolytic sol-gel process can prepare homogeneous nanoparticles with well crystalline phase.37-40 Further, TOPO acts as capping agent to the TiO2 particles, leading to maintain
the nanoscale size and have well crystallinity.27 The specific surface area of the TOPO-capped TiO2 determined by BET method was 7 m2/g. This value is far less than its
theoretical one (488 m2/g). The difference between the experimental and theoretical results is mainly resulted from the TOPO which contributes 16 % to total mass of sample and leads to aggregation of nanocrystals in dry.
20 30 40 50 60 70 80 90
Intensity (A.U
.)
2 Theta (degree)
TOPO-capped TiO
2Figure 4- 4 The XRD pattern of TOPO-capped TiO2.
Semiconductor can be produced photoinduced electrons and holes when the excited energy is greater or equal to the bandgap energy. The optical property of TOPO-capped TiO2 was examined by UV-Visible spectrum. Figure 4-6 shows the UV-Vis absorption
spectrum of TOPO-capped TiO2. A steep absorption was measured below 350 nm. A
bandgap of 3.54 eV of the TOPO-capped TiO2 was obtained from the absorption edge.
According to the quantum size effect (10-100 Å), the band gap energy is blue-shifted toward the decreased particle size.32 The band gap of the TiO2 nanocrystals in this study is larger
than their bulk one (3.2 eV), indicating the quantum size scale of the non-hydrolytic sol-gel derived nanocrystals. 200 300 400 500 600 700 800 0.0 0.5 1.0 1.5 kubelka-Munk (A .U .) wavelength (nm)
TOPO-capped TiO
2Figure 4- 6 UV-Vis absorption spectrum of TOPO-capped TiO2.
4.1.2 Isoelectric point and Hydrodynamic diameter of TiO
2The affinity interaction between the catalyst TiO2 and reactants is considered to enhance
the catalytic reaction rate. The diffuse of organic compounds in the liquid phase to the TiO2
influences the surface charge of the semiconductor particles and the charge forms of the compounds. When the zeta potential of the particle closes to zero, this condition is called isoelectric point (IEP). According to the following equations, TiO2 surface is negatively
charged at the pH value higher than the IEP of TiO2 (Eqn. (4-1)), whereas positively charged
at pH< IEP (Eqn. (4-2)).
pH > IEP : Ti-OH + OH- → TiO- + H2O (4-1)
pH < IEP : Ti-OH + H+ → TiOH2+ (4-2)
The pH dependent zeta potential of TiO2 suspensions is shown in Figure 4-7. The IEP
for TOPO-capped TiO2 in the pure water, phenol or BPA solutions were located at pH 6.2,
which was equal to that for Degussa P25.83
Figure 4-8 shows the zeta potential of TOPO-capped TiO2 after photodegradation of
phenol or BPA. The zeta potential maintained around 40 eV even after 4 hours reaction. The surface quantities ratio of oxygen and titanium atoms was 1.2 which is smaller than the stoichiometric value of 2. Thus, there are substantial amounts of oxygen vacancies on the TiO2 surface due to the NHSG method. The dissociation of hydroxyl (OH-) occupied the
sites of oxygen vacancy, and the proton (H+) caused the acidic phenomenon. Thus, the mixed solution in the presence of the TOPO-capped TiO2 became acidic and the zeta
potential was 40 eV. Then, the surface charge of TOPO-capped TiO2 maintained the 40 eV
after photocatalysis, indicating that the characteristic nature of surface properties was changed insignificantly during the photocatalysis.
2 4 6 8 10 12 14 -60 -40 -20 0 20 40 60 pH value Zeta potential (mV) TOPO-capped TiO 2
TOPO-capped TiO2+Phenol TOPO-capped TiO
2+BPA
Figure 4- 7 Zeta potential of TOPO-capped TiO2 and mix with phenol and BPA solution.
0 50 100 150 200 250 0 10 20 30 40 50
Degradation time (min)
Z e ta potent ial (mV ) Phenol BPA
In order to elucidate the hydrodynamic diameters of TOPO-capped TiO2 after EDCs
partition, dynamic light scattering was used to analyze the particle sizes of TOPO-capped TiO2. Table 4-1 tabulated the particle size distribution of TOPO-capped TiO2 in different
kinds of EDCs solutions. The hydrodynamic diameter of the pure TOPO-capped TiO2 in the
DI water was 182.04 nm. The hydrodynamic diameters of TOPO-capped TiO2 in phenol,
BPA and estrone solutions were 215.38, 221.26 and 216.84 nm, respectively. The hydrodynamic diameter of the P25 was 213.97 nm in DI water, and was 278.33, 266.33 and 272.90 nm in phenol, BPA and estrone solutions, respectively. The hydrodynamic diameters of TOPO-capped TiO2 or P25 in the aqueous solutions are all much larger than their
individual particle sizes (5 nm of the TOPO-capped TiO2 and 30 nm of P25). These
phenomena mean that the agglomeration of photocatalystin the EDCs solution is shown in this experiment containing TiO2 catalyst. Moreover, the EDCs adsorb on or close to the
TiO2 surface and enlarge the hydrodynamic diameters.
Table 4- 1 Particle size distribution of TOPO-capped TiO2 in EDCs solution.
Photocatalyst
(hydrodynamic diameter, nm)
EDCs
Hydrodynamic diameter (nm) Phenol 215.38 BPA 221.26
TOPO-capped TiO
2 (182.04 nm) Estrone 216.84 Phenol 278.33 BPA 266.33P25
(213.97 nm) Estrone 272.904.2 Partition Study
4.2.1 Partition equilibrium
Figure 4-9 and 4-10 show the time domain of partition equilibriums for phenol, BPA and
estrone on TOPO-capped TiO2 and Degussa P25 particles, respectively. In the
TOPO-capped TiO2 system, the distributed plateau takes place after 1 min, indicating
partition equilibrium of EDCs. The initial concentration of phenol, BPA and estrone were 10 to 50 and 1 to 5 ppm, and the distributed quantities were 2.2 to 4.2, 13 to 50 and 0.9 to 4.4 mg/g, respectively. On the contrary, the adsorbed quantities for phenol, BPA and estrone were closed to 0.2 mg/g because of the affinity of P25 and EDCs were undesired. These finding reveal that the organic molecules were easily distributed to modified TiO2 surface.
The modification leads to the hydrophobic property, thus enhancing the affinity for the hydrophobic EDCs. 0 5 10 15 20 0 1 2 3 4 5 6 7 8
(a)
Adso rp tio n qu an tity (mg /g)Adsorption time (min)
Phenol+20ppm Phenol+40ppm Phenol+60ppm Phenol+80ppm Phenol+100ppm
0 5 10 15 20 0 10 20 30 40 50 60
(b)
Adsorption time (min)
Adsorption quantity (mg/g) BPA+20ppm BPA+40ppm BPA+60ppm BPA+80ppm BPA+100ppm 0 5 10 15 20 0 1 2 3 4 5
(c)
A d sorption quantity (mg/g)Adsorption time (min)
Estrone+1ppm Estrone+3ppm Estrone+5ppm
Figure 4- 9 Partition equilibriums for (a) phenol, (b) BPA and (c) estrone on TOPO-capped TiO2 at 25 °C.
0 10 20 30 40 50 60 0.0 0.3 0.6 0.9 1.2 1.5 Equilibrium concentration (ppm) Absorbe d q uantity (mg/g) P25+Phenol (20ppm) P25+BPA (20ppm) P25+Estrone (5ppm)
Figure 4- 10 Partition equilibriums for phenol (20 ppm), BPA (20 ppm) and estrone (5 ppm) on Degussa P25.
4.2.2 Partition isotherm
The surface coverage of organic pollutants on the TiO2 plays a crucial part in the
photocatalytic reaction. Therefore, it is necessary to explicitly determine the distributed behavior of the photocatalysts for the EDCs. Figure 4-11 shows the partition isotherms for phenol, BPA and estrone in the presence of TOPO-capped TiO2. It shows that the
distributed quantity of phenol partition maintains in 3 to 4 ppm with increasing concentration. When the equilibrium concentration of BPA is 4 to 21 ppm, the distributed behavior shows 15 to 38 mg/g ability. Saturated partition of 50 mg/g was observed above 32 ppm. Estrone can be easily distributed to the TOPO-capped TiO2 via hydrophobic character. Figure 4-12
shows the partition isotherms for phenol, BPA and estrone in the presence of Degussa P25. In contrast to the high distributed ability of EDCs on the TOPO-capped TiO2, the partitions of
hydrophobic property leads to the better affinity between TOPO-capped TiO2 and EDCs. In
the case of TOPO-capped TiO2, the distributed quantities increase with increasing the
concentrations of EDCs and attain to saturation.
0 20 40 60 80 100 0 2 4 6 8 10
(a)
Adsorbed quan tity (mg/g) Equilibrium concentration (ppm)TOPO-capped TiO2+Phenol
0 10 20 30 40 50 60 0 10 20 30 40 50 60 70 Adsorbed quantity (mg/g) Equilibrium concentration (ppm) TOPO-capped TiO 2+BPA