國 立 交 通 大 學
經營管理研究所
博 士 論 文
No. 135
台灣IC設計產業的經營能力及智慧資本管理研究
Managerial Capabilities and Intellectual Capital
Management of IC Design Industry in Taiwan
研 究 生:陳達元
指導教授:楊 千 教授
國 立 交 通 大 學
經營管理研究所
博 士 論 文
No. 135
台灣IC設計產業的經營能力及智慧資本管理研究
Managerial Capabilities and Intellectual Capital
Management of IC Design Industry in Taiwan
研 究 生:陳達元
研究指導委員會:
丁 承 教授
胡均立 教授
楊 千 教授
指導教授:楊 千 教授
中 華 民 國 一○○ 年 一 月
台灣IC設計產業的經營能力及智慧資本研究
Managerial Capabilities and Intellectual Capital
Management of IC Design Industry in Taiwan
研 究 生:陳達元
Student:Ta-Yuan Chen
指導教授:楊 千
Advisor:Chyan Yang
國 立 交 通 大 學
經 營 管 理 研 究 所
博 士 論 文
A DissertationSubmitted to Institute of Business and Management College of Management
National Chiao Tung University in Partial Fulfillment of the Requirements
for the Degree of Doctor of Philosophy
in
Business and Management January, 2011
Taipei, Taiwan, Republic of China
台灣IC設計產業的經營能力及智慧資本管理研究
研究生:陳達元
指導教授:楊 千
國立交通大學經營管理研究所博士班
摘
要
過去二十年來,台灣IC設計產業經歷了快速的成長,已經成為了僅次於美國的全球第 二大IC設計產業。IC設計產業具有變動快速、固定資產比率低以及知識密集度高等特性。 然而,由於新技術不斷出現,IC設計產業也面臨了許多不確定性及衝擊。例如單晶片系統 (SoC)技術的發展,就為台灣IC設計產業帶來了許多新的挑戰。此外,由於IC設計產業具有 高度知識密集的特性,經營能力的優劣,以及對智慧資本的管理能力,就成了決定成敗的 重要因素。 本論文回顧台灣IC設計產業的發展歷程,探討內在及外在的成功因素,進而探究單晶 片系統技術對台灣IC設計產業可能造成的衝擊。另外本論文也針對經營能力及智慧資本的 管理進行兩項實證性的研究。在經營能力的研究中,使用了三階段資料包絡法(3-stage Data Envelopment Analysis)對美國及台灣的主要IC設計公司進行相對競爭力的研究分析。在智 慧資本的研究中,則以台灣IC設計公司為樣本,分析其經營效率,並提供相關的建議及管 理意涵。 關鍵詞:IC計設、單晶片系統、模組化、標準、矽智財、經營能力、資料包絡法、智慧資 本。Managerial Capabilities and Intellectual Capital
Management of IC Design Industry in Taiwan
Student:Ta-Yuan Chen
Advisor(Advisors):Dr. Chyan Yang
Institute of Business and Management
National Chiao Tung University
ABSTRACT
IC design industry in Taiwan has experienced dramatic growth over the past two decades. Taiwan IC design industry, behind the US, has become the second largest in the world. The characteristics of IC design industry are fast-changing, asset-light and knowledge-intensive. However, the emergence of new technologies may bring about uncertainty and impact. For example, the rise of System-on-a-Chip (SoC) design methodology has brought new challenges to Taiwan IC design industry. Since IC design industry is asset-light yet knowledge-intensive, the managerial capabilities and intellectual capital management are the critical issues for the industry.
The dissertation explores the external and internal factors that make Taiwan IC design industry successful. Besides, the characteristics of Taiwan IC design industry and the impact of SoC are studied. In addition, two empirical studies on managerial capabilities and intellectual capital management are conducted. The study of managerial capabilities employed 3-stage DEA to investigate the competitive landscape of dominate players in US and Taiwan IC design industry. The study of intellectual capital management compares the managerial efficiency of intellectual capital for IC design houses in Taiwan. The implications and recommendation resulting from the studies are provided.
Keywords: IC design; SoC; system on a chip; modularity; standards; SIP; managerial capability; DEA; intellectual capital
誌 謝
年屆不惑,還有機會進修博士班,過程雖然辛苦,卻也彌足珍貴。
這一路上要感謝的人很多,首先要感謝指導教授楊千老師一路上 温暖的支
持,他的智慧,使我在研究及人生的智慧都獲得不少啟發。
此外感謝丁承老師為我們奠定了堅實的統計能力基礎,胡均立老師及周雨
田老師在數量方法上的指導,也令我獲益良多。你們的教導,使我從研究的門
外漢,到有能力一窺研究的堂奧。
準備報考博士班的期間,正逢小孩陸續出世。讀完博士班,兩個小孩已經
從小嬰兒長成小學生了。在此亦要感謝老婆大人在這個期間的奉獻與支持。
最後感謝在此研究路上所有對我有所教導啟發的老師,以及一路共同奮鬥
的同學,沒有你們的相伴與支持,我的研究亦無法完成。
陳達元 謹誌
2011 年 1 月
Table of Content
摘 要 ... i
ABSTRACT ... ii
Table of Content ... iv
List of Tables ... vi
List of Figures... vii
Chapter 1. Introduction ... 1
1.1. Research Background ... 1
1.2. Scope and Objectives ... 3
1.2.1. The “Temporary Champion Curse” of IC design industry in Taiwan... 3
1.2.2. Managerial Capabilities of IC Design Industry... 3
1.2.3. Intellectual Capital Management of IC Design Firms in Taiwan... 4
1.3. Organization of the Dissertation ... 4
Chapter 2. The “Temporary Champion Curse” of IC design industry ... 6
2.1. Research background ... 6
2.2. Modularity ... 7
2.2.1. Modular system... 7
2.2.2. Benefits of modular system... 7
2.2.3. Technological changes and modularity ... 8
2.2.4. Knowledge scope and competitiveness ... 9
2.3. IC design industry in Taiwan ... 10
2.3.1. Migration of IC design industry... 10
2.3.2. Characteristics of IC design industry in Taiwan... 12
2.3.3. The temporary champion curse... 12
2.4. Market and technological change in IC design industry... 14
2.5. The enduring champion in Taiwan IC design industry... 17
2.6. Conclusion and implication ... 18
Chapter 3. Empirical Study on Managerial Capabilities of IC Design Houses ... 21
3.1. Research background ... 21
3.2. Literature Review ... 23
3.2.1. Capability ... 23
3.2.2. Measurement of capabilities ... 24
3.3. Research methodology ... 25
3.3.1. The Three-Stage DEA Model ... 25
3.3.2. Stage 1: The Initial DEA Producer Performance Evaluation ... 26
3.3.3. Stage 2: Using SFA to Decompose Stage 1 Slacks... 27
3.3.4. Stage 3: Adjusted DEA... 27
3.5. Data ... 28
3.5.1. Data collection ... 28
3.5.2. Input and output variables ... 28
3.5.3. Environmental Variables ... 29
3.6. Empirical results ... 31
3.7. Discussion and Conclusion ... 37
4.1. Research background ... 42
4.2. Measurement of intellectual capital management ... 43
4.3. Data Envelopment Analysis... 44
4.4. Combination of DEA and PCA ... 45
4.5. Methodology... 45
4.5.1. Data Envelopment Analysis (DEA)... 45
4.5.2. Principal Component Analysis (PCA) and Biplot ... 46
4.6. Data ... 47
4.7. Results ... 48
4.7.1. DEA results ... 48
4.7.2. PCA results and biplots ... 49
4.8. Conclusion ... 53
Reference 55 Appendix 1 IC design companies in Taiwan...63
List of Tables
Table 2.1 Advantages and disadvantages of specialized firms in a modular system ... 10
Table 2.2 Technical milestones of MediaTek ... 18
Table 3.1 Characteristics of IC design houses in US and Taiwan... 21
Table 3.2 Descriptive statistics of IC design houses, 2003-2008 (sample size = 180) ... 29
Table 3.3 Profile of IC design houses in US and Taiwan ... 30
Table 3.4 SFA results (sample size = 180) ... 32
Table 3.5 Stage 1 and Stage 3 DEA results (2008) ... 33
Table 3.6 Comparison of Stage1 and Stage3 DEA results.(2008) ... 34
Table 3.7 IC design houses in different quadrants ... 36
Table 4.1 Input and output variables ... 48
Table 4.2 DEA efficiencies of IC design firms under different performance index ... 48
Table 4.3 Eigenvalues and proportion of variance ... 50
Table 4.4 Matrix of component loadings ... 50
List of Figures
Fig. 2-1 Revenue growth of top 20 IC design houses since 1999 ... 13 Fig. 2-2 CAGR and average gross margin of top 20 IC design houses between 1999 and 2009 .. 14 Fig. 2-3 Architecture shit in SoC era... 16 Fig. 3-1 Efficiency and gross margin of IC design houses in 2008 ... 35 Fig. 4-1 Oriented vectors using different performance indices ... 51
Chapter 1.
Introduction
1.1. Research Background
Taiwanese IC design industry has experienced dramatic growth over the past two decades. The compound annual growth rate (CAGR) of IC design industry in Taiwan is about 15% for the past 10 year (2000-2009). The rapid growth made Taiwanese IC design industry, behind the US, the second largest IC design industry in the world (Huang and Yang, 2003).
Compared to manufacturing, packaging and testing sectors in Taiwanese IC industry, the IC design sector is more suitable for Taiwan. Compared to other sectors in IC industry, the IC design sector generates higher gross margin and revenue per employee while consumes less capital expenditure at the same time. Furthermore, the high-quality yet relatively low-cost engineers have been the competitive edge for Taiwan. Developing IC design industry can fully utilize the valuable human resources thus strengthen Taiwan’s competitive ability.
To analyze the prosperity of Taiwanese IC industry in the past two decades, Hung and Yang (2003) applied the national system of innovation (NSI) concept to explore the successful factors of Taiwanese IC design industry. Among the elements of an NSI, four factors are selected from the literature (Chen and Sewell, 1996; Mathews, 1997; Chang and Hsu, 1998). There are four major factors- “government policy”, “human capital”, “industry clusters”, and “bridging institutions”- contributed to the success of Taiwanese IC design industry. To achieve the goal of “Green Silicon Island”, Taiwan government used lots of policies - including tax benefits, low-interest loans, Industry-University Cooperation Program, and sponsoring R&D institution focusing on applied technology - to attract investment in IC industry. Besides, the high-quality human capital in Taiwan is the most valuable asset for high-tech development. Higher salaries and stock rewards in Taiwan IC industry help recruit skillful and dedicated engineers to boost the
industrial growth. Furthermore, the Shin-Chu Science-Based Industrial Park, Taiwan’s “Silicon Valley”, has provided a superb infrastructure to attract the first-tier high-tech firms to start their business. After years of development, an IC industry cluster has formed. The network structure facilitates personnel, technological, and informational interactions within the cluster. Therefore, technological diffusion, cooperation, and mutual support are easy to take place between firms. Finally, the most famous bridging institution, Industrial Technology Research Institute (ITRI), have made a great contribution to the development and diffusion of technology for Taiwan’s high-tech industries. ITRI is responsible for scanning new technology globally, absorbing them and transferring theses new technology to Taiwanese firms for commercial development. For example, the Taiwan’s computer industry benefited a lot from the successful interaction with ITRI. (Chang et al., 1999) Furthermore, ITRI integrates government, academic, industrial and foreign resources to make the most of industrial innovation (Hsu, 2005). Since many Taiwanese firms are small-to-median enterprises and lack of R&D capability. ITRI have become the source of innovation for Taiwan IC industry. All these factors interact with each other and create synergy to enhance the growth of Taiwanese IC design industry.
The characteristics of IC design industry are fast-changing, asset-light and knowledge-intensive. The emergence of new technologies may bring about uncertainty and impact. The rise of System-on-a-Chip (SoC) design methodology has brought new challenges to Taiwan IC design industry. Since IC design industry is asset-light yet knowledge-intensive, the managerial capabilities and intellectual capital management are the critical issues for the industry. All the important issues mentioned above are summarized and defined in detail in section 1.2.
1.2. Scope and Objectives
1.2.1. The “Temporary Champion Curse” of IC design industry in Taiwan
IC design industry has been an increasingly important sector in Taiwan. Under a modular industrial structure, IC design houses in Taiwan can build their competitive advantages on speed, quality, flexibility and cost. However, modular structure of the industry also imposes restriction on the firms’ long-term growth and profitability. The “temporary champion curse” phenomenon, describing the growth ceiling and short-term competitiveness of specialized firms in a modular production system, was observed in IC design industry in Taiwan. The research depicts the “temporary champion curse” phenomenon in IC design industry and attempts to explore the reasoning through the lens of theory. The main finding is that knowledge scope is critical for firms to maintain long-term competitiveness. A firm should not only focus on their present products but expand their knowledge scope in the long run.
1.2.2. Managerial Capabilities of IC Design Industry
The IC design houses in US and Taiwan comprise 90% of market share around the world. The IC design firms, belonging to the fabless sector of semiconductor industry, rely little on physical capital investment. Capability, the central concept suggested by resource-based view (RBV), is the key factor to succeed in IC design industry. To measure relative capability, firms should be compared across similar external conditions and evaluated with multiple performance indicators. This research employed three-stage DEA to isolate environmental influence and included 30 dominant players of IC design industry to evaluate their managerial capabilities. The results showed that IC design houses in US outperform their counterparts in Taiwan. It is a warning signal that many IC design houses in Taiwan are inefficient and less profitable. The
results of this research provide practical information for managers of IC design houses to understand their relatively competitive positions and thus to frame their future strategies by benchmarking their counterparts.
1.2.3. Intellectual Capital Management of IC Design Firms in Taiwan
Management of intellectual capital has been the source of competitive advantages in the new economy. The study employed data envelopment analysis (DEA) and principal component analysis (PCA) to analyzed 62 publicly listed IC design firms in Taiwan. The DEA models using different performance indices were analyzed and their relationships were further explored with PCA. The empirical results revealed that 30 out of 62 firms are efficient in market value added (MVA) or calculated intangible value (CIV) performance dimension. About a quarter of the IC design firms still have much room to improve their intellectual capital management. The purpose of the study aims to provide a benchmark tool for firms to understand their relative strength and weakness in intellectual capital management. The empirical results may help managers frame their future strategy more correctly and enrich the empirical research on intellectual capital management.
1.3. Organization of the Dissertation
The dissertation is organized as the following order. Chapter 2 explores the “temporary champion curse” phenomenon of IC design industry in Taiwan, describing the growth ceiling and short-term competitiveness of specialized firms in a modular production system. Two empirical studies on managerial capabilities and intellectual capital management were conducted. Chapter 3 employed 3-stage DEA to investigate the competitive landscape of dominate players in US and Taiwan IC design industry. Chapter 4 compares the managerial efficiency of intellectual capital
for Taiwan IC design houses. The implication and recommendation are provided at the end of each chapter.
Chapter 2.
The “Temporary Champion Curse” of IC design industry
2.1. Research background
IC design industry, fabless sector of the semiconductor, has been increasingly important for the semiconductor industry. The revenue percentage of the IC design sector in semiconductor industry has increased from 15% in 2003 to 17% in 2005 and reach 22% in 2008 (IEK, 2005). Most of the dominant players of IC design industry are located in US and Taiwan. The IC design houses in Taiwan and US comprise 90% of market share in the world. Second only to US, Taiwanese IC design industry has been the second largest in the world (Hung and Yang, 2003). Generally speaking, US IC design firms own more advanced technology, invest more in R&D, and enjoy higher gross margins than their counterparts in Taiwan. On the contrary, Taiwanese IC design houses, adopting the strategy as quick followers, build their core competence on speed, quality, flexibility and cost (Chang and Tsai, 2002).
The whole IC industry in Taiwan builds on the structure of vertical disintegration and specialization. The level of modularity in the IC industry is quite high. Langlois (2003) noted that modularity gives rise to a set of market-supporting institutions, stable interface standards and design rules. Under stable interface standards and design rules, modularity enables firms to pursue focused strategies and outsource across the value chain. That is why Taiwan IC industry can bring all its competitive strengths (speed, quality, flexibility and cost) into full play.
Although modular production system brings about the benefits of speed, quality, flexibility and cost reduction, it also imposes restriction on specialized firms’ long-term growth. The “temporary champion curse” phenomenon, describing the growth ceiling and short-term competitiveness of specialized firms in a modular production system, was observed in IC design industry of Taiwan. This research tries to depict the “temporary champion curse” phenomenon in
Taiwan IC design industry and explore the reasoning through the lens of theory.
2.2. Modularity
2.2.1. Modular system
A complex system consists of subsystems that interact and interdependent to some degree (Sanchez and Mahoney, 1996). Complex systems can be classified into categories of decoupled, loosely coupled and tightly coupled systems according to the level of impact on the evolution of other components. In tightly coupled systems, components cannot be separated at all. On the contrary, components can change independently without impact on the evolution of other components in decoupled systems. In loosely coupled systems, components can perform a specific function separately and integrate as a whole system according to defined rules. Modular system is a loosely coupled system coordinated by specifying standard operating procedures (Cyert and March, 1963). A modular system relies on design rules which define the relationships of modules or components (Baldwin and Clark, 1997).
2.2.2. Benefits of modular system
Modular system can lower transaction costs of the whole system and thus bring about the benefits of speed, cost reduction and customization. On one hand, components in the same system can be reusable and interchangeable in other products. On the other, coordination and monitoring costs can be kept at minimum level by limiting information flows between activities.
A modular system is flexible since product variations can be achieved by replacing different modular components with no need to redesign other components (Sanchez, 1995). The flexibility of modular system allows of ‘mixing and matching’ of modular components and thus extends the
range of product variations. A firm can combine existing or new modular components to create new products to customize market demand. The strategic flexibility of modular system can be an important source of competitive edge because a firm can respond more quickly to changing markets and technologies (Sanchez, 1995). At last, by standardizing component interfaces, modular system can coordinate geographically dispersed component developers and thus make global production network possible (Kogut and Kulatilaka, 1994). This helps enhance more new product variations and enlarge scale economics.
2.2.3. Technological changes and modularity
In the early stage of product development, interdependent architectures usually predominate due to design complexity. On one hand, modular architecture may force designers to compromise and move away from advanced technological frontier in order to fit entrenched industry standards (Ulrich, 1995). On the other, employing new technologies in product design, engineers may not know what to specify, can not accurately measure important attributes and do not understand how the variation in subsystems will impact overall system performance (Christensen et al., 2002). The managerial efforts are needed to monitor developing processes closely in order to reduce transaction costs (Williamson, 1975). Therefore, it would be better to adopt the interdependent architecture and keep the developing activities in-house at the early stage of innovation.
In the late stage of product development, industry standards emerge and thus modularity creates the benefits of speed, cost reduction and customization (Baldwin and Clark, 2000). When one firm’s interface specifications were accepted by other competitors, these specifications take form as industry standards. Employing industry standards, designers and assemblers can mix and match the most effective components from the best suppliers (Christensen et al., 2002). At this stage, modular architecture brings about the benefits of scale economics, speed to market, and
flexibility for horizontally stratified firms. Gradually, the dominated integrated firms will gradually replaced by independent focused providers (Baldwin and Clark, 2000).
When firms try to upgrade their product level, product development shit back to early stage and integrating ability become critical again. To adapt the dynamic market demand, firms have to update and modify their product designs quickly to meet new market requirements. The capabilities of creating new designs by recombining existing knowledge to meet dynamic market demand are essential for firms to keep competitive. At this stage, individual firms in a modular may lack the capability of integration due to their narrow knowledge scope.
2.2.4. Knowledge scope and competitiveness
Broader knowledge may contribute to business competitiveness. The combination of technological specialization and application breadth is critical for continuous performance improvement (Iansiti, 1997). The more products employing a particular function to deliver it, the faster a firm will accumulate knowledge about barriers for functional performance and how to overcome them (Pil and Cohen, 2006). Besides, firms with multiple product lines have more diverse sets of organizational routines and broader knowledge scope. Wider knowledge scope enables firms to develop variant sets of routines to support broader search and increase routine recombination opportunities. When faced with an unexpected change, those firms with broader knowledge scope have greater chance to leverage and recombine existing knowledge to solve problems and create new opportunities. As a result, firms with broader knowledge scope gain competitive advantage in the long run. Studying the case of the building industry in the UK, Cacciatori and Jacobides (2005) propose that re-integration was necessary to build the capabilities to respond to market demand. Bercovitz and Mitchell (2007) also showed that multi-product firms will survive longer than single-product firms. An individual firm in a
modular value chain tends to specialize only in a narrow knowledge scope and thus may lack of enough re-integration capabilities to adapt changing market environment.
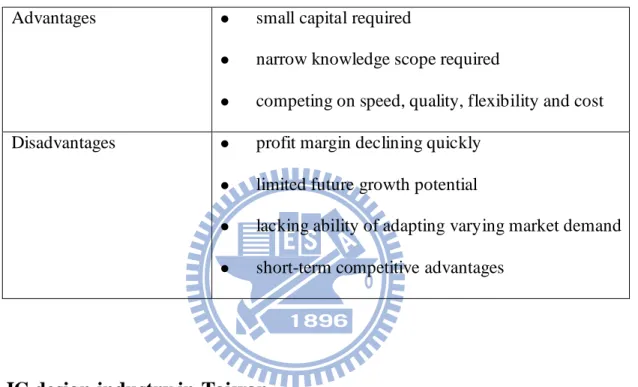
The advantages and disadvantages of specialized firms in a modular system are summarized in Table 2.1.
Table 2.1 Advantages and disadvantages of specialized firms in a modular system Advantages small capital required
narrow knowledge scope required
competing on speed, quality, flexibility and cost Disadvantages profit margin declining quickly
limited future growth potential
lacking ability of adapting varying market demand
short-term competitive advantages
2.3. IC design industry in Taiwan
2.3.1. Migration of IC design industry
Many firms today are outsourcing some of their value-added activities that do not belong to their competitive strengths to more cost-effective outside suppliers. To understand why chip design industry moved to Asia, Ernst (2005) interviewed with 60 companies and 15 research institutions in the US, Taiwan, Korea, China and Malaysia that are involved in electronic design. The author concluded that there are three factors (“pull”, “policy” and “push”) driving the chip design industry to move to Asia. “Pull” factor means: (1) the lower cost of employing a chip design engineer in Asia and (2) the rapidly growing Asian market. “Pull” factor gives global
integrated device manufacturers (IDMs) and system houses the incentives to set up their Asian design centers. Besides, to attract foreign investment, many Asian governments adopted the policy of providing low-cost yet well-established infrastructure and tax deduction to upgrade their domestic industries. “Police” factor played a catalytic role in providing necessary support to attract foreign investment and upgrade technological level. At last, “push” factor depicts that chip design has become a highly complex technology system, where different kinds of knowledge and skills need to be communicated and coordinated simultaneously. However, it’s too costly to keep a large group of diverse people at the same location. Vertical specialization in the global design network provides an efficient and flexible way to exchange the required knowledge for designing chip at a lower cost. This force push chip design industry to disperse globally and move to Asia. As a result, the migration of IC design industry brought foreign investment and advanced technologies thus helped Taiwan establish IC design industry.
Taiwanese IC design industry plays an important role in the global production network. Breznitz (2005) proposed Taiwanese IC design industry provides complementary assets to the Taiwanese OEMs and pureplay foundries and enhances the competitive advantage of the whole Taiwanese IT industry. The successful Taiwanese system houses and OEM companies, like BenQ and Quanta, created a large demand for chips based on second-generation technology. On the other hand, Taiwanese IC design firms provide system houses and OEM manufacturers with low-cost chips to lower their cost structure and thus maintain their competitive strengths. Besides, the existence of world’s second largest IC design industry supplied pureplay foundries with stable stream of orders to help them stay profitable as well as maintain and extend technological capacities. In short, the players of Taiwanese IT hardware industry – the system houses, pureplay foundries and IC design firms – strengthen each other’s competitive advantages and create synergy for the whole IT industry in Taiwan.
2.3.2. Characteristics of IC design industry in Taiwan
The successful companies in Taiwan IC industry exhibit some common characteristics. Fuller (2003) compared the success of pureplay foundries with failure of DRAM industry in Taiwan and concluded that Taiwan can become an innovator in the products with the following characteristics: “a high level of granularity in the production chain”, “high volume production”, “manufacturing-based outputs” and “no requirement for large amounts of patient capital”. Furthermore, Taiwanese companies did not try to challenge the technology leaders directly, but adopted the quick-follower strategy. Chang and Tsai (2002) analyzed the competitive strategy of Taiwan’s IC design industry and found the key competitiveness lies in “the speed to implement”, “the quality of the design output”, “flexibility in response to changes in specification and market demand”, and the “overall cost level”. The industry-wide standards allow product architecture to become modular. Modularity enables specialized firms to develop products that fit standardized interfaces without redesigning an entire product. That is why the firms in a modular value chain can beat competitors with speed, responsiveness and customization. The success of Taiwanese IC industry demonstrates all the aforementioned characteristics. Due to the modular industrial structure, Taiwanese IC design firms can bring their core competence (niche position) – speed, quality, flexibility and cost – into play.
2.3.3. The temporary champion curse
Although Taiwan IC design industry has achieved great success in the past two decades, there are still structural limits to firms’ long-term sustainable growth. The “temporary champion curse” phenomenon, describing the short-term competitiveness of IC design firms, was observed in IC design industry of Taiwan. Under a modular production system, a firm with small capital can select a focused niche product to entry market and enjoy high profit margin and high growth
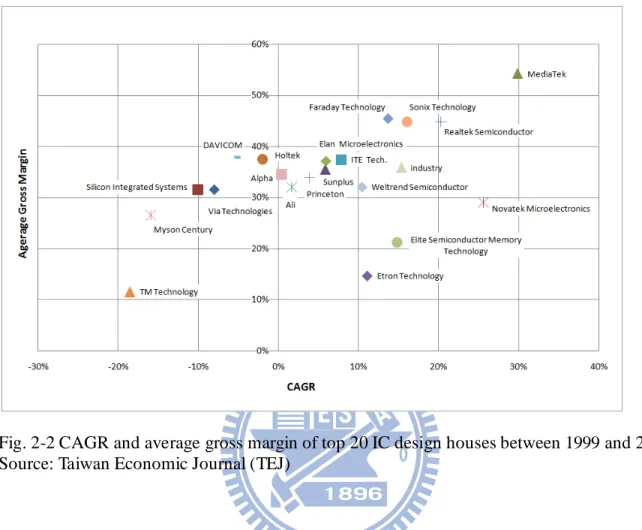
rate in early stage. As time goes by, profit margins tend to decline and growth slow down quickly due to competition from market. If the company cannot product innovative products to meet varying market demand, the competitive advantage of the firm will not last long. Besides, there is also a growth ceiling for focused firms. There are few IC design houses in Taiwan can exceed the “one-billion” revenue barrier. To conclude, the “temporary champion curse” describes the short-term competitive edge and revenue limit experienced by most firms in IC design industry of Taiwan. Fig. 2-1 shows the revenue growth curve of top 20 IC design firms since 1999. For the past ten years, only one company, Media Tek, has grown beyond the one-billion barrier. Fig. 2-2 shows annual compound growth rate (CAGR) and average gross margins of top 20 IC design firms in Taiwan. As shown in Fig. 2-2, most of the firms’ margins are below 40%. There is only one company, Media Tek, enjoying high annual growth rate and profit margin compared to other peer companies.
Fig. 2-1 Revenue growth of top 20 IC design houses since 1999 Source: Taiwan Economic Journal (TEJ)
Fig. 2-2 CAGR and average gross margin of top 20 IC design houses between 1999 and 2009 Source: Taiwan Economic Journal (TEJ)
2.4. Market and technological change in IC design industry
The performance requirements for electronic products have been increasingly demanding for the recent years. Multiple 3Cs (Computing, Communication and Consumer) functions are required to integrated in a single electronic device. To be more competitive in the market, electronic products strive to be lighter, thinner, shorter, smaller, as well as less power-consuming at the same time. Besides, time pressure to launch a new product is another critical issue. Product life cycles of electronic products have been rapidly shrinking to a few months, while designing a new chip still needs months or years. To solve all the problems mentioned above, the new design methodology, “System-on-a-Chip” (SoC), emerged as an effective solution. According to
Dataquest’s survey, the market share of SoC design grew rapidly from 18.6% in 2004 to 22.7% in 2008.
The widening productivity gap between manufacturing and design has been another main driving force to apply the SoC design methodology. Following Moor’s law, the complexity and density of ICs have increased rapidly. While the manufacturing productivity of semiconductor has seen a 58% compounded annual growth rate, improvements in the productivity of IC designer failed to keep up (only a 21% compound annual growth rate) (SIA, 1999). To bridge the productivity gap, IC design engineers need to employ new reusable design methodology to reduce recurring cost and shorten product life cycles. The physical components assembled on a PCB will be gradually replaced by the virtual components (SIPs) integrated on a software platform. Applying the “platform design” concept, the specific functions of a system are designed as modules (silicon intellectual property, SIPs) to replace IC components then integrated on a single chip. The SoC design methodology can systematically reuse as many design steps as possible thus reduce development time and related costs.
In an industry with high modularity, all the work in a value chain can be clearly defined and divided. Baldwin and Clark (2000) stated that “modularity is a particular design structure, in which parameters and tasks are interdependent within units (modules) and independent across them.” Therefore, a firm without system integration knowledge can focus on its own expertise and provide complementary service to other companies under a modular industry structure. As a result, the whole value chain can benefit from efficiency and lower cost. The same modular concept is expected to be applied in the SoC design methodology. The virtual electronic components (SIPs) will be integrated on a design platform just as physical electronic components are fabricated on a printed circuit board (PCB). However, platform design does not reduce the need for system integration knowledge. In the PCB paradigm, individual firm can manufacture
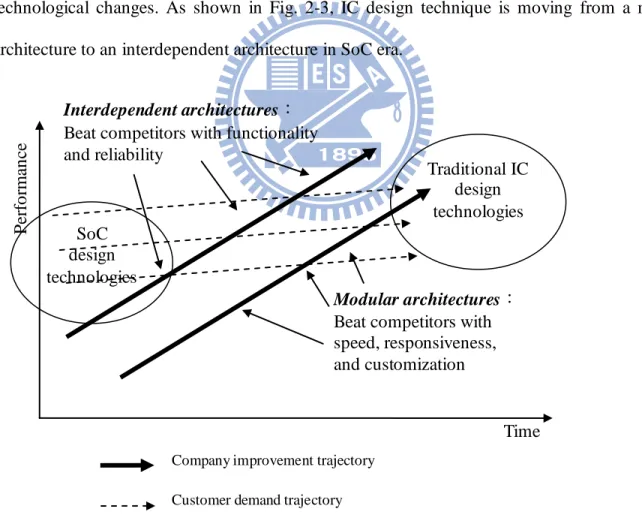
electronic components according to industry-wide standards. System integration knowledge is not a requirement for the specialized component providers. Therefore, coordination across firm boundary can keep at a minimum level. Shifting to SoC paradigm, the platform design only provides “a common base for the manifestation of differentiated systems knowledge” (Martin, 2003). Christensen (2004) stated that when a product or service is not good enough, firms with integrating ability are best suited to coordinate the complexity of developing new product. To improve product, firms often need to recombine existing technologies in new ways and thus creating new patterns of interaction and new problems. System integration capability is critical to overcome the increasing technical difficulty originating from technological complexity and fast technological changes. As shown in Fig. 2-3, IC design technique is moving from a modular architecture to an interdependent architecture in SoC era.
Fig. 2-3 Architecture shit in SoC era
Traditional IC design technologies SoC design technologies Time P erfo rm an ce Modular architectures:
Beat competitors with speed, responsiveness, and customization
Interdependent architectures:
Beat competitors with functionality and reliability
Company improvement trajectory Customer demand trajectory
2.5. The enduring champion in Taiwan IC design industry
Although many IC design houses in Taiwan suffer the temporary champion curse, there is one exception, MediaTek, for the temporary champion curse in Taiwan. As shown in Fig. 2-1 and Fig. 2-2, MediaTek has enjoyed high profit margin and broken the one-billion growth ceiling for the past ten years. MediaTek Inc., founded in 1997, is headquartered in Taiwan and has sales and research subsidiaries in Mainland China, Singapore, India, U.S., Japan, Korea, Ireland, Denmark and England. MediaTek is a leading fabless semiconductor company for wireless communication and digital media solutions. Since its establishment, the compounded annual sales growth rate of the Company has reached 30% and it enjoyed more than 40% gross margin every year. In terms of revenue perspective, MediaTek is also one of the world’s top 10 fabless semiconductor companies.
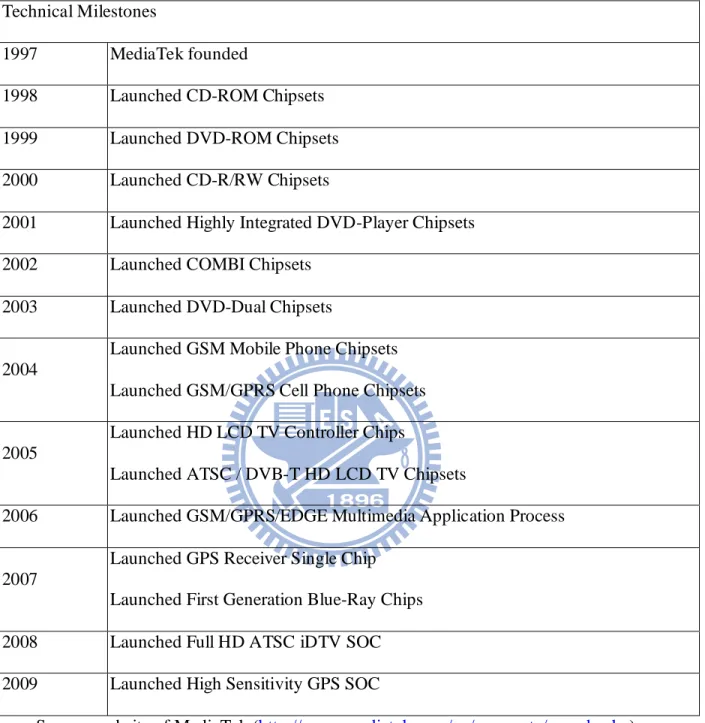
Unlike many of its counterparts in the industry, MediaTek continually expand its product range and knowledge scope. MediaTek was originally a CD/DVD chipsets manufacturer when established in 1997. To enlarge it knowledge scope, MediaTek participated aggressively in global mergers and acquisitions. The company acquired NuCORE Technology Inc., a US digital camera chipset design company. It also purchased the Othello® radio and SoftFone® baseband chipset product lines as well as certain cellular handset baseband support operations of Analog Devices, Inc. These acquisitions allowed MediaTek to break through critical technologies and expand it knowledge scope to adapt varying market demand. As shown in Table 2.2, MediaTek has transformed itself from a CD/DVD chipsets provider to an integrator of multiple advanced technologies like mobile phone, LCD TV, GPS and blue-ray disc for the past ten years. The ability of integrating multiple technologies is especially important in SoC era. That is why MediaTek can sustain its long-term competitive advantage and keep its growing dynamics.
Table 2.2 Technical milestones of MediaTek Technical Milestones
1997 MediaTek founded
1998 Launched CD-ROM Chipsets 1999 Launched DVD-ROM Chipsets 2000 Launched CD-R/RW Chipsets
2001 Launched Highly Integrated DVD-Player Chipsets 2002 Launched COMBI Chipsets
2003 Launched DVD-Dual Chipsets
2004
Launched GSM Mobile Phone Chipsets Launched GSM/GPRS Cell Phone Chipsets
2005
Launched HD LCD TV Controller Chips
Launched ATSC / DVB-T HD LCD TV Chipsets
2006 Launched GSM/GPRS/EDGE Multimedia Application Process
2007
Launched GPS Receiver Single Chip Launched First Generation Blue-Ray Chips 2008 Launched Full HD ATSC iDTV SOC 2009 Launched High Sensitivity GPS SOC
Source: website of MediaTek (http://www.mediatek.com/en/corporate/awards.php)
2.6. Conclusion and implication
This research attempts to describe the “temporary champion curse” phenomenon in Taiwan IC design industry and explore the reasoning through the lens of theory. The “temporary
champion curse” phenomenon indicates the growth ceiling and short-term competitiveness of specialized firms in a modular production system. Modular production system makes possible for firms with small capital and narrow knowledge scope to enter market. However, the success achieved in early stage may not be sustainable in the long run. The abilities of mixing existing routines to match future change are critical for firms to accommodate varying environment. The knowledge specialized firms accumulated may be too narrow to adapt to future technological or market changes. That is why “temporary champion curse” phenomenon” was observed often in modular production system.
The past success of Taiwan IC design firms relied on the structure of vertical specialized network in IC industry. The competitive strengths of Taiwanese IC design firms include speed, quality, flexibility and low costs. All these strengths originate from the modular industry structure in which industry-wide standards are ready and stable. However, at the advent of SoC era, the “plug-and-play compatible” industry-wide standards are still not ready. It is hard to duplicate the past success in the PCB paradigm when design methodology is shifting to SoC. Furthermore, in an industry with high modularity, individual firm can just focus on its expertise without the knowledge of system integration. That is just the business model adopted by most of the IC design firms in Taiwan. With the help of industry-wide standards, the production processes can be coordinated automatically across firm boundary. In the SoC paradigm, all the physical components are replaced by SIPs which will be integrated on a single chip. The knowledge of system integration has been a requirement for SoC design. For Taiwanese IC design firms, lacking integrating ability will be an obstacle to overcome in the future. The successful story of Media Tek suggests focused firms should enlarge their knowledge scope to improve their abilities of adapting changing environment.
The “temporary champion curse” phenomenon observed in IC design industry of Taiwan generates some implications for specialized firms in a modular production system. Although specialized firms can enter market by selecting a niche product, in early stage, these firms may enjoy high profit margin and growth rate. However, the knowledge scope these firms accumulate is quite narrow. Therefore, the abilities of mixing existing knowledge to match future market demand are limited. In the long run, the future growth is restricted and profit margin will be declining. Therefore, it is important for the specialized firms in a modular production system to plan their future evolving path. They should not only focus their attention on present operation but also on expanding their future knowledge scope.
Chapter 3. Empirical Study on Managerial Capabilities of IC Design Houses
3.1. Research background
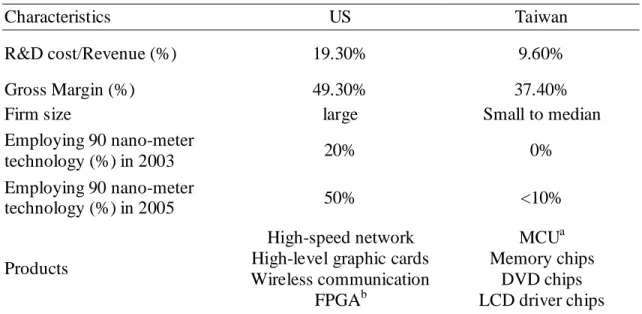
The IC design industry, fabless sector of the semiconductor, has been increasingly important for the semiconductor industry. The revenue percentage of the IC design sector in semiconductor industry has increased from 15% in 2003 to 17% in 2005 and reached 22% in 2008. (ITRI IEK, 2005). Most of the dominant players of IC design industry are located in US and Taiwan. The IC design houses in Taiwan and US comprise 90% of market share around the world. Second only to US, Taiwanese IC design industry has been the second largest in the world (Huang and Yang, 2003). Generally speaking, US IC design firms own more advanced technology, invest more in R&D, and enjoy higher gross margins than their counterparts in Taiwan. On the contrary, Taiwanese IC design houses, adopting the strategy as quick followers, build their core competence on speed, quality, flexibility and cost (Chang and Tsai, 2002). The different characteristics between Taiwan and US are listed in Table 3.1.
Table 3.1 Characteristics of IC design houses in US and Taiwan
Characteristics US Taiwan
R&D cost/Revenue (%) 19.30% 9.60%
Gross Margin (%) 49.30% 37.40%
Firm size large Small to median
Employing 90 nano-meter technology (%) in 2003 20% 0% Employing 90 nano-meter technology (%) in 2005 50% <10% Products High-speed network High-level graphic cards Wireless communication FPGAb MCUa Memory chips DVD chips LCD driver chips
Annual costs of employing a
chip design engineer (in USD) 300,000 < 60,000 Competitive advantages Technology leader Speed, quality,
flexibility and cost
a
MCU: Micro Control Unit; b FPGA: Field-Programmable Gate Array Source: ITRI IEK-ITIS project (2003-2005)
In spite of the increasing importance of IC design industry, the competitive landscape in the industry has seldom been explored. IC design houses, belonging to the fabless sector of the semiconductor industry, rely little on physical capital investment. Managerial capability is the key factor to succeed in IC design industry which relies little on physical capital investment. As suggested by resource-based view (Teece, 1980; Wernerfelt, 1984; Barney, 1991; Perteraf, 1993) capability is often embedded with the whole organization and hard to imitate or buy. Besides, capability is hard to observe or measure. In strategic literature, data envelopment analysis (DEA) or stochastic frontier analysis (SFA) have been applied to measure capability (Majumdar 1998; Dutta et al. 2005). When conducting research of comparing performance between countries, the 3-stage DEA approach is valuable for its ability of accounting for environmental factors (Avkiran and rowlands, 2008). Following previous research, this study employed three-stage DEA to inspect the capabilities of IC design houses.
This research tries to address the following issues: (1) to investigate whether the environmental differences between US and Taiwan have any impacts on efficiency ; (2) to evaluate the relative performance of dominant IC design houses after purging the influence of environmental factors and luck; (3) to reveal the relative competitive positions of IC design industry. The findings could be helpful for practitioners in IC design industry to understand their competitive positions and thus to frame their future strategies by benchmarking their
counterparts.
3.2. Literature Review
3.2.1. Capability
The central question in strategic management is to answer why some companies outperform others. The resource-based view (RBV), which tries to answer the question by inspecting the differences between companies, has been increasingly popular in strategic management field. The RBV logic links superior firm performance to the resources and capabilities owned by firms (Teece, 1980; Wernerfelt, 1984; Barney, 1991; Perteraf, 1993). Resources are stocks of available factors - property, plant and equipment, human capital, etc. - that are owned or controlled by a firm. Capabilities, in contrast, refer to a firm’s capability to deploy resources (Amit and Schoemaker, 1993). While resources are observable assets that can be individually valued and traded, capabilities, on the other hand, are embedded with the whole organization and thus can be transferred only through sale of a firm (Makadok, 2001). Since these abilities are hard to observe, as RBV theory suggests, they would also be hard to imitate or buy. In spite of its popularity in strategic management field, RBV has suffered criticism for its conceptualization and measurement. Therefore, a different approach for measurement is required to address the issues mentioned above.
RVB has been criticized for its conceptualization and measurement. On one hand, some researchers have argued that the conceptualization of RBV is a tautology (Priem and Butler 2001). Porter (1994) and Williamson (1999) pointed out that most empirical studies identity critical resources and capabilities by comparing successful firms with unsuccessful ones, and then test whether these identified resources and capabilities are critical. Needless to say, the answer is
always a yes. That is why RBV is criticized as tautology.
On the other hand, many prior empirical studies of RBV are based on the doubtful financial ratios. Accounting ratios, such as return on total asset (ROA), return on investment (ROI) and return on sales (ROS) have been widely employed to measure firms’ performance. However, relying on accounting ratios may result in some disadvantages. First, accounting ratios fail to reflect the multi-dimensional characteristic (multiple inputs and outputs) of the production process. In addition, accounting ratios may provide misleading information due to earnings management (Jones, 1991; Dechow et al., 1995; Shivakumar, 2000).
To address the issues of conceptualization and measurement in RBV, a different approach to measure capabilities is in need. First, the conceptualization and measurement of capabilities should be independent of their rent generation ability. Second, the measure of capabilities should be multi-dimensional and free from distortion. As Peteraf and Barney (2003) proposed, RBV is “an efficiency-based explanation of performance differences.” The quantitative techniques such as data envelopment analysis (DEA) or stochastic frontier analysis (SFA) may satisfy the requirements mentioned above.
3.2.2. Measurement of capabilities
The DEA and SFA techniques have been applied in much strategy literature (Majumdar, 1998; Majumdar and Venkararaman, 1998; Majumdar and Marcus, 2001; Dutta et al., 2005, Delmas and Tokat, 2005). For example, Majumdar (1998) used DEA to measure the capabilities of utilizing resources, using the U.S. telecommunications industry as a context. Dutta et al. (2005) applied SFA to demonstrate the heterogeneity of R&D capability across firms in U.S. semiconductor industry. Delmas and Tokat (2005) employed DEA efficiency scores as a dependent variable to tests the effects of deregulation and governance s structures in U.S. electric
utility sector. Since DEA compared the firms’ capabilities in a relative sense, Dutta et al. (2005) suggested researchers have to ensure that capabilities are compared across similar external conditions. However, the traditional DEA model employed in many empirical studies is deterministic. That is, the DEA efficiency scores may comprise the effects of managerial capabilities, environmental influence and luck (Fried et al., 2002). It is not clear that the superior performance of a firm in DEA analysis is due to managerial capabilities or just due to favourable environment and luck.
To address this issue, this research employed the three-stage DEA analysis (Fried et al., 2002) to isolate the effects of environment and luck from managerial capabilities. The purpose of this study is to find out the “pure” managerial capabilities of IC design firms, using the IC design houses in U.S. and Taiwan as a context.
3.3. Research methodology
3.3.1. The Three-Stage DEA Model
Producer performance may be influenced by three different factors. The first is the ability of management to coordinate the related production activities. The second is the effect of environment under which production activities are performed. The third is the influence of luck or omitted variables which will be reflected in a random error term in a regression-based evaluation of performance (Fried et al., 2002).
To isolate the environmental effects and statistical noise from managerial efficiency, Fried et al. (2002) proposed the three-stage DEA model. In the first stage, conventional DEA analysis is conducted to obtain an initial evaluation of producer performance. However, the efficiency scores generated from the first stage still compose of all the effects including managerial efficiency,
environmental influence and statistical noise. Therefore, in the second stage, SFA technique will be employed to separate environmental effect and statistical noise from managerial efficiency. In the third stage, the original efficiency scores generated from the first stage will be adjusted to eliminate environmental influence and statistical noise. The environmental effects and statistical errors estimated in the second stage will be adjusted and a more “pure” managerial efficiency score will be produced. More details are provided in the following sections.
3.3.2. Stage 1: The Initial DEA Producer Performance Evaluation
The conventional DEA analysis is employed to conduct the initial performance evaluation. This study adopts an input-oriented approach and the assumption of variable return to scale (VRS) (Banker et al., 1984) to formulate the linear programming problem:
θ
λ θ, min (1) Subject to θx0 ≥ Xλ 0 y Yλ≥ 0 ≥ λ 1 = λ T ewhere X ≧ 0 denotes N × 1 vector of inputs, Y ≧ 0 denotes M × 1 vector of outputs, X = [x1,…, xI] is an N × 1 matrix of input vectors, Y = [y1,…, yI] is an M × I matrix of output vectors,
λ= [λ1,…, λI] is an I × 1 vector of intensity variables, e = [1,…, 1], and there are I producers in
the comparison set. The optimal values of θ, solved by the above linear program equation, will fall between 0 and 1.
3.3.3. Stage 2: Using SFA to Decompose Stage 1 Slacks
The objective of the stage 2 is to decompose the slacks of the first stage into environmental influences, managerial inefficiencies and statistical noise. By applying stochastic frontier analysis (SFA), the slacks of inputs (sni = xni﹣Xnλ≧0) are regressed against observable environmental
variables (zi). The SFA regressions estimating cost frontier can be specified as:
(
,)
n
ni i n ni ni
s = f z β +ν +µ , n = 1,…, N , i = 1,…,I (2)
The fn
(
zi,β terms are the deterministic feasible slack frontiers with estimated parameter n)
vector βnand composed error structure
(
νni +µni)
. Thev
ni~N(0,σ2vn) error reflects statisticalnoise, while the µni error reflects managerial inefficiency. After all the effects are decomposed in equation (2), producers’ adjusted inputs can be constructed by the following equation:
{ }
{ }
max
max
A i i ni ni i i n i n ix
x
z
β
z
β
ν
ν
∧ ∧ ∧ ∧
=
+
−
+
−
n = 1,…, N , i = 1,…,I (3) A nix are adjusted input quantities ,while xni are observed ones. The first adjustment in equation (3) eliminates the influence of environmental factors. And the second adjustment adjusts the influence due to luck. These adjustments will be different both across producers and across inputs. Finally gamma value n 2 2 2
un/( vn un)
γ =σ σ +σ denotes the relative level of impacts originating from managerial inefficiency. When the value of gamma is close to 1, the influence of managerial inefficiency will dominates that of statistical noise.
3.3.4. Stage 3: Adjusted DEA
Stage 3 repeats stage 1 DEA analysis by employing adjusted input data. Since the effects of the operating environment and statistical noise have been removed, the efficiency scores
generated in stage 3 reflects only “pure” managerial efficiency.
3.5. Data
3.5.1. Data collection
IC design houses, belonging to the fabless sector of the semiconductor industry, rely little on physical capital investment. Managerial capability is the key factor to succeed in the industry. Thus, the IC design industry is an ideal sample for research on evaluating capability. The data employed in this study was collected from two electronic databases: Compustat and Taiwan Economic Journal (TEJ). Since top players dominate IC design industry, the top 15 IC design firms in US and top 15 ones in Taiwan were selected as samples. The aggregated revenues of these 30 companies accounted for about 70% of total IC design industry revenues in 2008, therefore the selected samples may well represent the whole industry. Panel data were collected during 2003-2008 and the total sample size is 180. To eliminate the inflation effects, all data were deflated with wholesale price index deflator to convert monetary values into constant 2006 US dollars.
3.5.2. Input and output variables
Following previous research in high-tech context, capital (CA) (Shao and Lin, 2002), R&D expense (RD) (Verma and Sinha, 2002) and number of employees (EMP) (Shao and Lin, 2002; Wu et al, 2006) were employed as inputs variables. As for outputs, this study adopted both accounting-based and market-based measures of performance. Accounting-based measures, including total revenue (TR) (Wu et al., 2006) and gross profit (GP), evaluate the past performance reported on financial statements. Since the IC design industry is highly competitive, the profit margins of IC design firms also decline rapidly. As indicated by president of MediaTek,
the largest IC design company in Taiwan, gross margin is the key performance index to keep competitive in IC design industry (Tsai, 2002). Adopting both revenue and gross profit may reflect the key performance dimension of IC design industry. Market-based measures such as market-to-book ratio (Crossland and Hambrick, 2007), on the other hand, reflect the willingness of stock market to pay premiums in excess of book value for certain firms. In general, high market-to-book ratio reflects expectation of stock market about a firm’s future growth potential. For IC design industry, this premium part reflects the intellectual capital or knowledge capital created by IC design houses which is not reported on traditional financial statements. Besides, the premium value is especially important for high-tech firms to ensure sufficient capital inflow to fuel their future growth. In this research, market value (MV) is adopted as an output measure. Table 3.2 presents the descriptive statistics of all input and output variables.
Table 3.2 Descriptive statistics of IC design houses, 2003-2008 (sample size = 180)
Variables Mean Std. Deviation Minimum Maximum Outputs: TRa 976,839.12 1,500,002.35 36,868.76 10,690,609.15 GP a 518,952.49 1,021,813.37 5,866.15 7,852,466.23 MV a 4,373,556.68 11,663,536.75 9,687.36 74,927,063.65 Inputs: CA a 1,093,651.86 2,360,117.60 10,289.81 16,290,984.22 RD a 182,841.64 325,242.66 1,569.05 2,188,590.87 EMPb 1,573.49 2,193.29 85 15,400 a
USD in thousand; b number of employees
3.5.3. Environmental Variables
Environmental variables are defined as the external factors that firms cannot change easily during the time frame of analysis. Four types of environmental variable are specified: country, products, size, and age. As shown in Table 3.1, the different characteristics between US and
Taiwan are operating environment, product category, and firm size. Since one objective of this research is to investigate whether these environmental differences cause any impact on operating efficiency, country (Taiwan, US) is the dummy variable employed to denote the operating environment of firms. Besides, there are three major product categories in IC design industry: computer-related, communication-related and consumer-related products. Product dummies (computer, communication, consumers and others) represent different product categories to which firms belong. In addition, size is an important control variable to be included, since equally efficient small and large homes will have different levels of absolute slack (Fried et al., 2002). Capital is used as a measure of size in this research. At last, the influence of age on efficiency is explored. On one hand older companies may be more efficient due to their accumulated experience (Barnett et al., 1994), and on the other aged companies tend to be less flexible, less innovative and thus less efficient (Makhok and Osegowitsch, 2000). Therefore, this study adopts age variable to investigate whether the influence of age exists. All the variables characterizing environmental differences are listed in Table 3.3.
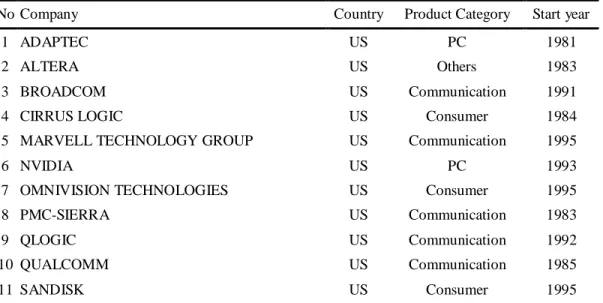
Table 3.3 Profile of IC design houses in US and Taiwan
No Company Country Product Category Start year
1 ADAPTEC US PC 1981
2 ALTERA US Others 1983
3 BROADCOM US Communication 1991
4 CIRRUS LOGIC US Consumer 1984
5 MARVELL TECHNOLOGY GROUP US Communication 1995
6 NVIDIA US PC 1993
7 OMNIVISION TECHNOLOGIES US Consumer 1995
8 PMC-SIERRA US Communication 1983
9 QLOGIC US Communication 1992
10 QUALCOMM US Communication 1985
12 SEMTECH US Others 1960
13 SILICON LABORATORIES US Communication 1996
14 SILICON STORAGE TECHNOLOGY US Others 1989
15 XILINX US Others 1984
16 MEDIATEK Taiwan Consumer 1997
17 NOVATEK MICROELECTRONICS Taiwan Consumer 1997 18 REALTEK SEMICONDUCTOR Taiwan Communication 1987 19 COASIA MICROELECTRONICS Taiwan Others 1997
20 VIA TECHNOLOGIES Taiwan PC 1992
21 ETRON TECHNOLOGY Taiwan Consumer 1991
22 RICHTEK TECHNOLOGY Taiwan PC 1998
23 SITRONIX TECHNOLOGY Taiwan Consumer 1992
24 SUNPLUS TECHNOLOGY Taiwan Consumer 1990
25 SILICON INTEGRATED SYSTEMS Taiwan PC 1987
26 FARADAY TECHNOLOGY Taiwan Others 1993
27 ELITE SEMICONDUCTOR MEMORY Taiwan Consumer 1998
28 PIXART IMAGING Taiwan Consumer 1998
29 ELAN MICROELECTONICS Taiwan Consumer 1994
30 SONIX TECHNOLOGY Taiwan Consumer 1996
3.6. Empirical results
In Stage1 DEA, initial efficiency scores were calculated year by year for Stage 2 SFA analysis. In Stage2 analysis, the efficiency scores calculated from 2003-2008 data were pooled to compute the three input slacks: capital slack, R&D expense slack and employees slack. Then each input slack is used as a dependent variable to run SFA analysis by employing environmental variables as independent variables. The results are listed in Table 3.4.
Table 3.4 SFA results (sample size = 180)
Dependent Variable
Independent Variable Capital Slack R&D Expense Slack Employees Slack
Constant -2.428 -2.170 -1.219 (2.193) (2.078) (1.257) US 0.142 0.113 -0.122 (1.598) (1.445) (0.864) Communication 1.337 1.574 0.580 (2.376) (2.041) (1.269) Consumers -0.779 -0.554 -0.347 (1.797) (1.620) (1.010) Others -0.657 -0.351 -0.213 (2.202) (1.906) (1.206)
Size -4.65E-07 -4.17E-07 -1.98E-07
(2.46E-07) (2.21E-07) (1.32E-07) Age 0.258** 0.202** 0.124** (0.081) (0.069) (0.037) sigma-squared 32.563** 24.750** 9.132** (8.957) (6.654) (2.856) gamma 0.573** 0.551** 0.606** (0.123) (0.124) (0.127) mu 6.461** 6.289** 3.332* (2.395) (2.085) (1.387) eta -0.042 -0.057* -0.050* (0.025) (0.027) (0.025) log likelihood function -519.283 -498.087 -398.344 LR test of the one-sided error 54.056 50.595 58.615
Significant at the 10% level *
Significant at the 5% level **Significant at the 1% level
As shown in Table 3.4, for all three output slacks, the coefficients of country are not significant. This implies the operating environment of Taiwan is not inferior to that of US. For different product categories, the coefficients are also insignificant. That is, product categories to which a firm’s products belong have no impact on inefficiency. The size coefficients of capital and R&D slack about are negative and significant at 10% significant level. The result suggests
larger firms tend to more efficient in usage of capital and R&D expense. Finally, age has positive relationship with all input slacks. This implies older firms tend to be more inefficient in managing all inputs.
The estimated values of gamma for all three inputs are 0.573 for capital slack, 0.551 for R&D expense slack and 0.606 for Employee slack. The result suggests that statistical noise explains about 40-45% variation of all three input slacks. In other words, more than half of slacks come from managerial inefficiency. There is still much room for individual managers to improve.
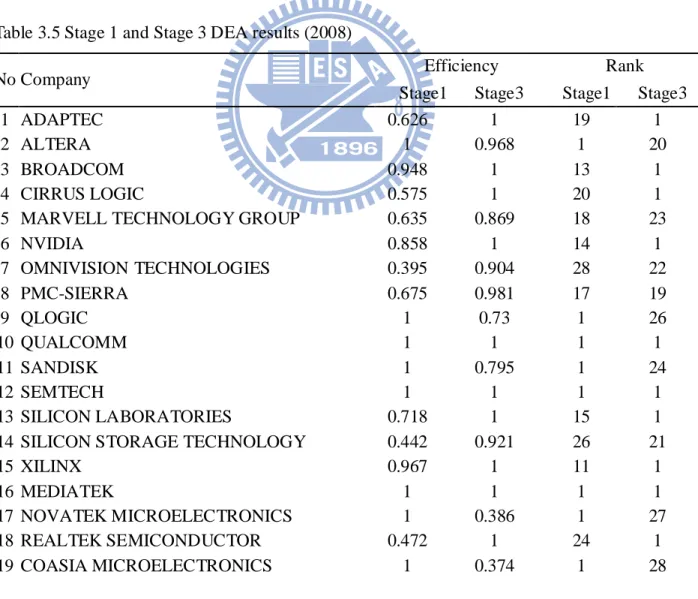
In Stage3 analysis, all input slacks were adjusted to recalculate DEA efficiency scores. The efficiency scores and rankings in Stage 1 and Stage 3 DEA are listed in Table 3.5.
Table 3.5 Stage 1 and Stage 3 DEA results (2008)
No Company Efficiency Rank
Stage1 Stage3 Stage1 Stage3
1 ADAPTEC 0.626 1 19 1
2 ALTERA 1 0.968 1 20
3 BROADCOM 0.948 1 13 1
4 CIRRUS LOGIC 0.575 1 20 1
5 MARVELL TECHNOLOGY GROUP 0.635 0.869 18 23
6 NVIDIA 0.858 1 14 1 7 OMNIVISION TECHNOLOGIES 0.395 0.904 28 22 8 PMC-SIERRA 0.675 0.981 17 19 9 QLOGIC 1 0.73 1 26 10 QUALCOMM 1 1 1 1 11 SANDISK 1 0.795 1 24 12 SEMTECH 1 1 1 1 13 SILICON LABORATORIES 0.718 1 15 1 14 SILICON STORAGE TECHNOLOGY 0.442 0.921 26 21
15 XILINX 0.967 1 11 1
16 MEDIATEK 1 1 1 1
17 NOVATEK MICROELECTRONICS 1 0.386 1 27 18 REALTEK SEMICONDUCTOR 0.472 1 24 1 19 COASIA MICROELECTRONICS 1 0.374 1 28
20 VIA TECHNOLOGIES 0.388 0.785 29 25
21 ETRON TECHNOLOGY 0.298 1 30 1
22 RICHTEK TECHNOLOGY 1 0.2 1 29
23 SITRONIX TECHNOLOGY 0.965 1 12 1
24 SUNPLUS TECHNOLOGY 0.432 1 27 1
25 SILICON INTEGRATED SYSTEMS 0.566 1 21 1
26 FARADAY TECHNOLOGY 0.451 1 25 1
27 ELITE SEMICONDUCTOR MEMORY 0.487 1 23 1
28 PIXART IMAGING 1 0.169 1 30
29 ELAN MICROELECTONICS 0.488 1 22 1
30 SONIX TECHNOLOGY 0.705 1 16 1
Spearman’s rank correlation was employed to evaluate the influence of environmental factors and luck. As shown in Table 3.6, after adjusting for the influence of environmental variable and statistical noise, mean efficiency score improves and standard deviation declines. The Spearman’s rank correlation coefficient between Stage1 and Stage3 is -0.3280 but not significant. The results suggested that many firms with high rankings in Stage 1 DEA do not necessarily perform well in Stage 3 DEA. The low correlation implies that the influence of environmental variables and luck is large. Therefore, it is important to isolate these effects before measuring managerial efficiency.
To further analyze the relative strengths of IC design houses, this study categorized all firms Table 3.6 Comparison of Stage1 and Stage3 DEA results.(2008)
Stage1 results Stage3 results Mean efficiency score 0.736 0.869 Standard deviation 0.251 0.248
Minimum 0.298 0.169
Maximum 1 1
Number of efficient firms 10 18
*Spearman’s rank correlation coefficient between Stage1 and Stage3 is -0.3280 but not significant at 5% level.
according to their efficiency and gross margins using 2008 data. All companies are divided into four groups according to their efficiency scores (X axis) and gross margins (Y axis). Following previous research, 0.8 is used as a cutoff point to specify high and low efficiency (Yang and Lu, 2006; Lu and Lo, 2007). Besides, 40% gross margin is an important threshold for IC design companies to gain competitive edge from the perspective of practitioners in IC design industry (Tsai, 2000).
` Fig. 3-1 Efficiency and gross margin of IC design houses in 2008
As shown in Fig. 3-1, the graph is divided into quadrant Ⅰ (high efficiency and high margin), quadrant Ⅱ (low efficiency but high margin), quadrant Ⅲ (low efficiency and low margin), and quadrant Ⅳ (high efficiency but low margin). These categories are characterized as follows:
(1) High efficiency and high gross margin: The best firms located in quadrant Ⅰare those with I
II
superior efficiency and high gross margin. These companies produce higher-end products and operate efficiently compared to their counterparts. As Figure 1 indicates, 10 US firms except 3 Taiwanese firms are located in quadrant 1.
(2) Low efficiency but high gross margin: There are 1 US firms and 1 Taiwanese firms falling in quadrant Ⅱ. These companies have selected right product strategies; however, they need to improve their operating efficiency further more.
(3) Low efficiency and low gross margin: The worst firms located in quadrant Ⅲ are those with low efficiency and low gross margin. There are 1 US firms and 5 Taiwanese firms located in quadrant Ⅲ. To keep competitive, these firms have to upgrade their technology level and improve their managerial capabilities at the same time. It is a warning signal for those firms located in this quadrant that they may be weeded out by their competitors in the future. (4) High efficiency but low gross margin: Quadrant Ⅳ includes 3 US firms and 7 Taiwanese ones.
Although these firms have operated efficiently, they need to improve their gross margins by developing more advanced products.
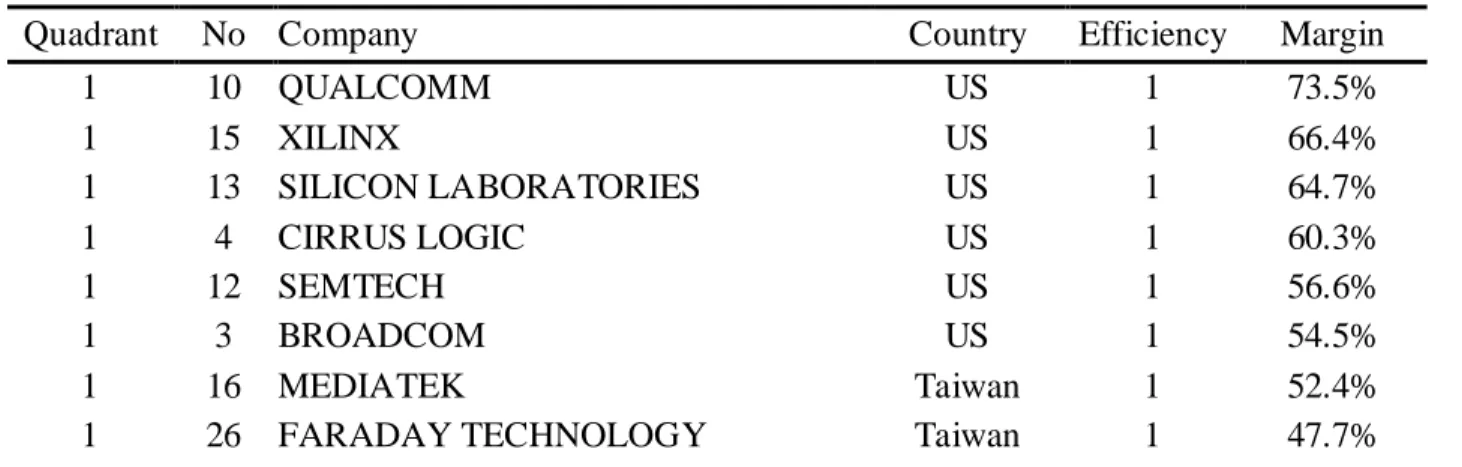
The firms in different quadrants are summarized in Table 3.7. The result shows that, in general, US firms outperform Taiwanese firms.
Table 3.7 IC design houses in different quadrants
Quadrant No Company Country Efficiency Margin
1 10 QUALCOMM US 1 73.5% 1 15 XILINX US 1 66.4% 1 13 SILICON LABORATORIES US 1 64.7% 1 4 CIRRUS LOGIC US 1 60.3% 1 12 SEMTECH US 1 56.6% 1 3 BROADCOM US 1 54.5% 1 16 MEDIATEK Taiwan 1 52.4%
1 1 ADAPTEC US 1 47.2% 1 18 REALTEK SEMICONDUCTOR Taiwan 1 41.0%
1 8 PMC-SIERRA US 0.981 68.6%
1 2 ALTERA US 0.968 69.3%
1 5 MARVELL TECHNOLOGY GROUP US 0.869 54.9%
2 9 QLOGIC US 0.73 74.0%
2 28 PIXART IMAGING Taiwan 0.169 48.6%
3 11 SANDISK US 0.795 11.7%
3 20 VIA TECHNOLOGIES Taiwan 0.785 31.8% 3 17 NOVATEK MICROELECTRONICS Taiwan 0.386 29.2% 3 19 COASIA MICROELECTRONICS Taiwan 0.374 5.2% 3 22 RICHTEK TECHNOLOGY Taiwan 0.2 38.4%
4 6 NVIDIA US 1 39.9%
4 30 SONIX TECHNOLOGY Taiwan 1 39.3% 4 29 ELAN MICROELECTONICS Taiwan 1 32.9% 4 25 SILICON INTEGRATED SYSTEMS Taiwan 1 30.7% 4 24 SUNPLUS TECHNOLOGY Taiwan 1 29.1% 4 23 SITRONIX TECHNOLOGY Taiwan 1 22.9% 4 27 ELITE SEMICONDUCTOR MEMORY Taiwan 1 14.1% 4 21 ETRON TECHNOLOGY Taiwan 1 3.5% 4 14 SILICON STORAGE TECHNOLOGY US 0.921 34.2% 4 7 OMNIVISION TECHNOLOGIES US 0.904 27.0%
3.7. Discussion and Conclusion
This study aimed to include dominant players of IC design industry and employ three-stage DEA to analyze their relative capabilities. The three-stage DEA approach has the advantages over the traditional financial ratios due to its multi-dimensional characteristics. In addition, the three-stage DEA can purge the influence of environmental factors to get the “pure” managerial efficiency and thus to measure managerial capability of firms. This research applied three-stage DEA, isolating the influence of environment and luck, to evaluate the managerial capability of IC design houses in US and Taiwan. The results of this study may provide a reference for future research in different context.