Tao, Y.-H., Guo, S. and Lu, Y., The design and the formative evaluation of a Web-based course for simulation experiences, Computers & Education, Vol. 47, No. 4, 2006, 414-432
The Design and the Formative Evaluation of a Web-Based Course for Simulation Analysis Experiences
Yu-Hui Tao
Dept. of Information Management National University of Kaohsiung
Kaohsiung, Taiwan, R.O.C. E-mail: [email protected]
Shin-Ming Guo
Dept. of Logistics Management
National Kaohsiung First University of Science and Technology Kaohsiung, Taiwan, R.O.C.
E-mail: [email protected] Ya-Hui Lu
ASE Testing Electronic Co. Kaohsiung, Taiwan, R.O.C. E-mail: [email protected]
ABSTRACT
Simulation output analysis has received little attention comparing to modeling and programming in real-world simulation applications. This is further evidenced by our observation that students and beginners acquire neither adequate details of knowledge nor relevant experience of simulation output analysis in traditional classroom learning. With the advances in the Internet learning environment, web-based computer-based training (CBT) can efficiently and effectively enhance the traditional classroom learning. This research addresses the issue of designing a web-based CBT course to assist the classroom instruction in helping students learn better simulation problem solving. The goal is to provide an effective way to learn the implicit experience of simulation output analysis via an efficient interactive environment. A prototype asynchronous web CBT system with simulation analysis guidelines was built to verify our design through a three-stage formative usability evaluation. The results showed that the simulation analysis guidelines organized by this research significantly improved the test scores and the interactive CBT system maintained students’interests longer than the written format.
Keywords: computer-based training, formative evaluation, simulation analysis, web-based course, tacit
knowledge
1.INTRODUCTION
Computer simulation has been an important skill for a seasoned professional in Operation Research/Management Science (OR/MS) (Dyer et al. 1993) and a critical OR tool in the industry (Nelson et al. 1987). A typical simulation process includes formulation, programming, verification, validation, experiment design and analysis, and recommendations (Taylor and Hurrion, 1988).
Shannon (1985) estimated that one needs to receive “at least 720 hours of formal class instruction plus another 1440 hours of outside study”to acquire the basic simulation tools. This does not include the extra effort required to gain real-world experience in order to acquire proficiency.
Students in related fields usually take only one simulation course. Due to time constraints in classroom settings, learning computer simulation is often limited to simulation concepts, modeling and programming (Rohrer and Banks, 1998; Lu, 2000). Consequently, simulation design and analysis is simplified and receives a lower priority. The situation is further evidenced by our observation that most students consider simulation design and analysis a much more difficult topic. However, a successful simulation application depends heavily on the effectiveness of simulation statistical analysis. Thus, efficient learning of effective simulation statistical analysis merits more research.
Computer-based training (CBT) has been widely applied in learning after the burgeoning popularity of personal computer in the eighties. According to the survey of Whitehouse and Pellegrin (1995), utilizing personal computer and software to raise the knowledge of students can save up to 70﹪of training time. Recent popularity of Internet has brought more benefits into traditional CBT learning, such as the 24x7 availability, better interactions between students and instructors, and virtual classroom space. Accordingly, an asynchronous web-based CBT system can serve as an after-hour teaching assistant to traditional classroom learning.
Because the tacit knowledge of experiential simulation analysis is not included in major English textbooks, nor are these simulation–related CBT systems currently available to the public to our knowledge, the objective of this research is to explore the design of a web-based CBT system that can assist the beginners to study effective simulation analysis experience in an efficient way. The
remaining paper is organized as follows: literature review in Section 2, research design and scope in Section 3, prototype system design in Section 4, and evaluations and conclusions in Section 5.
2. LITERATURE REVIEW
A web-based CBT system on tacit knowledge is not common both in practice and in literature. Newman & Lamming (1995) indicated that the usability is the key for an interactive system design while Tao (1999) pointed out that the experience as well as the theory is required for learning proficient simulation analysis. Therefore, to meet the objective of such a CBT system design, we review the content of experiential simulation statistical analysis, the concept of interactive system design, and the characteristics of web-based CBT as follows.
2.1 Content of Experiential Simulation Statistical Analysis
Teaching both the knowledge and the experiences of simulation statistical analysis are required to help novice acquire effective problem-solving skills (Tao, 1999). Tao (1999) also pointed out that experience is a broad term and the possible categories of simulation experience include high-level simulation-analysis framework, practical simulation-analysis models, collections of simulation tactics, case studies from the software companies, consulting firms or conference proceedings, and useful simulation-analysis processes in the literature. Among these, framework, model, literature and case studies are materials that can be found in the references, while tactics are not.
Nevertheless, comparing to the methodology of simulation modeling and analysis, the practical experience of simulation statistical analysis received less attention in the literature. Mellichamp and Park (1989), Ramachandran et al. (1988), Taylor and Hurrion (1988), and Tao and Nelson (1997) were the only few who had investigated simulation analysis. They proposed some theoretical framework or prototype systems with different emphases. On the applications, Goldsman et al. (1991) described their simulation problem-solving processes that solved an airline reservation system problem using three different approaches, all reaching the same conclusion. Tao and Guo (2000) proposed a mental model for simulation statistical analysis, which included two cognitive guidelines, two design indicators and a heuristic problem-solving process. Although the above experiences of simulation statistical analysis are precious, they cannot be easily organized for or shared during the classroom settings.
2.2 Concept of Interactive System Design
intention, action specification, execution, physical activity, perception, interpretation, and evaluation. The evaluation measures the final interpretation against the initial goal. Therefore, goal setting is the most important foundation for any interactive system development. In response to the importance of goal setting, Newman & Lamming (1995) pointed out that supporting activity, form of solution, user, and level of support are important elements of problem definition, where level of support specifies the usability goal. The targeted user’s involvement is essential for setting the proper usability goal.
Newman & Lamming (1995) also proposed a method for conceptual design, which includes identifying the form of mental model, hiding the mental model, encouraging the acquisition of this mental model by providing a suitable system image, analyzing the design by means of detailed cognitive walkthrough, and applications of design heuristic and guidelines. Targeted user group is important to designers not only in coming up with an appropriate mental model but also in focusing on providing an external system image that is usually the user interface in interactive system environment. Cognitive walkthrough is a method for achieving the appropriate system functionalities, and is comparable to the three-stage goal of an information system processing (Sauter, 1997): sensation, attention and perception.
When the designer is not familiar with conceptual design, he may apply empirical laws or guidelines when designing an interactive system (Shneiderman, 1998). Knowing, selecting, and applying design guidelines are very important as design guidelines may have supplemental, conflicting, or overlapping effects. When one applies too many design guidelines, the marginal effect shows. Therefore, the guideline in applying design guidelines is to select the minimum number of design guidelines required for achieving acceptable usability goals.
Good references for design guidelines, such as traditional man-machine interface design guidelines (Shneiderman, 1998), web page design guidelines (Nielsen, 2000), and bloopers (Johnson, 2000) are adequate for a good practical interface design. As the central idea of evaluation is to support the design, formative evaluation is preferred (Preece et al., 1996). Consequently, evaluation involves a repeating process of system testing, and promotes forming a solution to the design problem.
2.3 Characteristics of Web-Based CBT
Due to the rapid growth of Internet, web-based CBT, distance education, distance learning, and e learning are becoming synonymous. Dale (1999) pointed out that the United States has a tremendous growth for technology-mediated distance learning because the need was high and the technology was here. Ubell (2000) referred to a research result and an on-campus experiment to show that students can learn on line as well as they do on campus. However, Ubell (2000) also referred to some criticism which blamed schools for rushing into distance learning by offering inexpensive “plug and pay”courses, and claimed that online learning cannot replace life on a real campus. Wiesner (2000) contributed the rise of web-based courses to the historical developments of distance education and computer-assisted instruction (CAI), and debated whether today’s distance education is a rebottling or a new brew. Similarly, Ausserhofer (1999) drew attention to some of the limitations and pitfalls in web-based education as a major field of research and a hot area of applications.
Because content rather than technology is becoming a paramount concern for Web publishing, Kostur (1999) emphasized the importance of managing a web-based learning project for ultimate result. Danchak et al. (1999) proposed a web-learning model that was composed of 80% of asynchronous learning and 20% of the synchronous learning for better learning experience. The driving forces behind their 80/20 model were three learning models, including Gagné’s nine instructional events (Gagné et al., 1988); the cycle of distance learning which was proposed by Parker et al. and consisted of humanizing, participation, delivery, feedback and evaluation (Parker et al. 1996), and Kolb’s learning style inventory (LSI) (Kolb, 1984). The nine instructional events listed by Gagné et al. (1998) include guiding attention, informing learners of the lesson objective, stimulating recall of prior learning,
presenting stimulus materials with distinct features, providing learning guidance, eliciting performance, providing informative feedback, assessing performance, and enhancing retention and transfer.
Chang and Tong (1998) organized the taxonomy of learning styles for CBT, including constructive learning, situated learning, case-based learning, apprenticeship learning, project-based learning, story-based learning and collaborative learning. One example of web-based CBT systems with interactive design is a dynamic guidance using quiz functions for web education, which uses functions of on-line quiz, student profile, dynamic student grouping, and user interface agent to provide interactive guidance function during learning (Okada et al. 2000). Another example is a hybrid course delivery model emphasizing the involved activities, in which hands-on experience and mini-lecture are two major components (Siddiqui and Zubairi, 2000).
3. RESEARCH DESIGN AND SCOPE
Based on the literature review, this research intends to address the design, the development and the formative evaluation of a web-based CBT system containing the tacit knowledge of experiential
simulation analysis. Accordingly, the problem definition with intended goals is first defined, and the user profile is carefully sketched. With the goals and user profile identified, the core model of the experiential simulation analysis and the selection of interaction system design guidelines are introduced. The plan for the formative evaluation is then explained at the end.
3.1 Problem Definition
The research problem was “to design an efficient yet effective web-based CBT course to assist the simulation novice learn simulation tactics in conjunction with the traditional classroom learning”. The design of this web-based CBT course focused on the experiential part of simulation statistical analysis and the learning-enhancement interactions. The target users were college students with basic statistical training and had learned or were in the process of learning simulation.
The goal of effectiveness was accomplished by embedding simulation statistical expertise in the CBT course, while the goal of efficiency was achieved by combining the learning of basic knowledge of simulation analysis in-class and the learning of simulation statistical expertise online.
3.2. User Profile
In order to guide the design to meet the usability goals, we first profiled the targeted user group on their personality traits, knowledge and tasks experiences based on our observations: the user was computer literate but might not be at the expert level, had web experience but minimum contacts with web learning systems, had knowledge of introductory probability and statistics but might not be familiar with statistical software, liked to practice during learning, cared more about quality but not quantity of learning, wished to gain problem-solving skill in a short period of time, and was interested in learning simulation statistical analysis in a less stressful environment.
3.3. Model of Experiential Simulation Analysis
The tacit knowledge of experiential simulation analysis was designed as a three-level model, including contextual problem-solving guidelines, problem-solving process and learning-unit design, according to their roles in this CBT system. Contextual problem-solving guidelines were the finest tactics the expert applied to solving a problem, and were embedded in the problem-solving process specifically designed for the novice. The learning-unit design presented the segmentation of the learning contents, which included both the guidelines and the process.
This three-level model modularized the problem-solving guidelines and mapped them into either the problem-solving process or the learning-unit design. Therefore, it could easily provide a customized learning experience for novice through a mixture of what Change and Tong (1998) called constructive learning, situated learning and case-based learning. In particular, the situated learning was incorporated into the case-oriented learning as focused scenarios.
As indicated in the literature review, design guidelines provided a designer suggestions and solution strategies to the design problem. The challenge was to select, apply, and confirm a set of design
guidelines that aggregated to an acceptable level of usability goal. Based on our previous experience and study (Tao, 2000), we decided that the best approach for adopting design guidelines in this prototype system development is the trial-and-error approach and hoped to achieve 80% of intended goals with a minimum set of guidelines. This research applied instructional design guidelines proposed by Gragné et al. (1988) and interface design guidelines proposed by Zu and Change (1998), Dix et al. (1998), Marcus (1992) and Shneiderman (1998). We also applied self-inducted guidelines from experiences and observations over the Internet.
3.5. Evaluation Design
This research used formative evaluation to avoid finding critical problems after the prototype system development was completed. The three-stage formative evaluation, including user’s testing evaluation, experts’constructive and executive evaluation, and user’s summative evaluation, is described as follows:
a. User’s testing evaluation. The purpose was to conduct an informal evaluation on the initial design of the teaching system and the interface, so that users could provide feedback on any discrepancies as much as possible and as early as possible. The data sets were collected by means of observation and audio recording from students browsing through the initial prototype system. Retrospective interviews and verbal protocol analyses were also performed to obtain qualitative data.
b. Expert’s constructive and executive evaluation. The internal validation checks of the learning material were performed by the research team. It included two simulation-analysis professors who developed the conceptual model as well as the learning contents, and a graduate student collected and organized the learning contents from several major English simulation textbooks under the guidance of the two professors. The purpose of this stage was to evaluate the contextual design, instructional style and interface design from external experts’perspective. The data sets were collected from three experts’ heuristic evaluation. Retrospective interviews were performed for qualitative data.
c. User’s summative evaluation. The purpose was to understand the usability and learning effects of the final prototype system implemented for this research. The targeted subjects were beginners who had one year of probability and statistics, and one simulation class. Within their simulation class, simulation problem-solving in modeling, statistical analyses, simulation graphical software such as ARENA were covered. The subjects were divided into the control group who studied the written material and the experiment group who operated the CBT system. The written material and the CBT system covered the same simulation expertise prepared by this research but in different learning styles. The evaluation first compared all subjects’test scores for their performance differences before and after the learning session. Then a usability survey about the prototype system was conducted with the experiment group. The test questions were typical decision-support analysis for comparing different alternatives in, for example, plant layout, waiting line setup, and inventory policy. The learning contents included typical scenarios in a simulation problem-solving task, such as simulation run length, random number streams selection, statistical methods decisions, and so on. Evaluation results were analyzed quantitatively.
4. DESIGN OF PROTOTYPE
Based on the definition of the research problem, we designed a prototype system for this research. The design of the prototype system is as sketched in Sections 3.3 and 3.4, including the contextual problem-solving guidelines, the problem-solving process for novice, the learning-unit design, and the applied interaction design guidelines and demonstrations.
4.1. Contextual Problem-Solving Guidelines
Certain simulation concepts, such as initialization bias in the steady-state system, correlated data, and time-persistent variables, are not easily comprehensible to information-technology capable
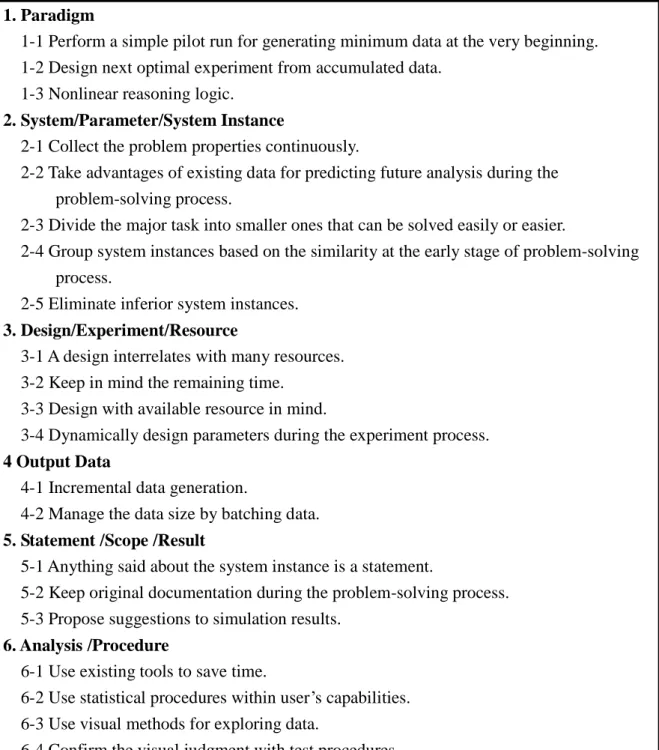
practitioners. To speed up the learning process, this research developed problem-solving guidelines based on the framework and the concept of sequential experiment from Tao and Nelson (1997) and expert experiences from Goldsman et al. (1991) and Kleijnen (1987). The guidelines collected and organized by this research is listed in Figure 1 and they were classified into six categories as defined below:
1. Paradigm: The goal of the paradigm was to provide practitioners a correct mindset about simulation
problem-solving analysis, which is an incremental and data-driven process.
2 System/Parameter/System Instance: A system is a black box with one or more parameters and takes
prescribed input to produce corresponding output. A system instance is a system with a set of fixed values of the system-dependent variables. Parameters are a collection of constants that define an instance of a system.
3. Design/Experiment/Resource: A design is subject to various resource constraints and consists of the
number of replications, the stopping time for each replication, the random number assignment, and the data aggregation technique.
4 Output Data: A user should utilize simulation data carefully in order to get more out of statistical
analysis:
5. Statement /Scope /Result: Results at various stages of the simulation sequential analysis have
different scopes and applications. Therefore, the user can record results as statements for further references:
6. Analysis /Procedure: An analysis derives statements about systems while a procedure is a function of
data and statements that produces a new statement:
The above six categories of experiential guidelines were not comprehensive due to references and time constraints. But we considered them adequate for this research to validate the experts’
problem-solving processes and to derive a simple and useful flow to assist the learning of an online simulation analysis system.
4.2 Problem-Solving Process
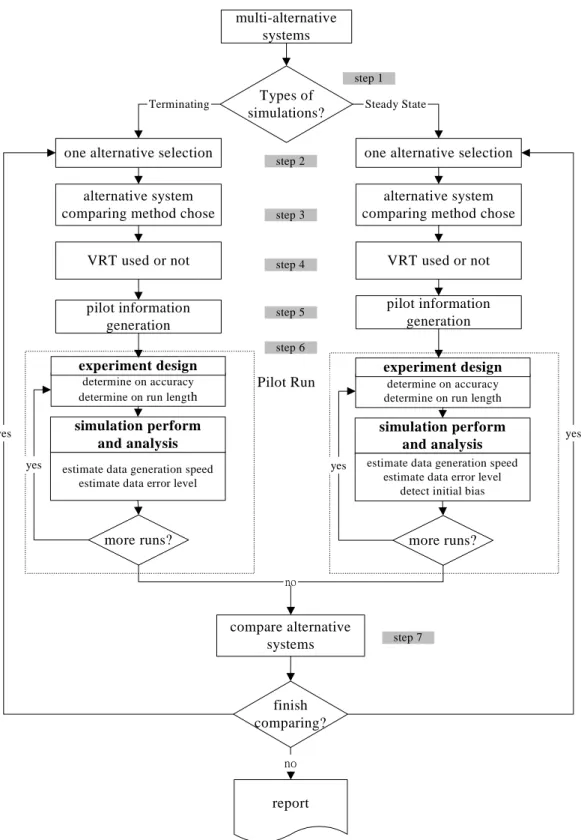
The principle of the conceptual design is to identify the intended mental model and hide the complex insight by providing a simple representation (Newman & Lamming, 1995). Therefore, we have simplified the expert’s problem-solving model as shown in Figure 2 The web-based system is intended for use after the simulation model is constructed. Thus the model starts with multiple system comparison and includes some of the experiential guidelines listed in the preceding section.
Step 1 judges the type of system and may apply guideline 2-1. Step 2 decides on a project to start with and may apply guidelines 2-3 and 2-4. Steps 3 and 4 determine whether or not to apply Variance Reduction Technique (VRT), such as Common Random Number (CRN). Step 5 simulates minimum data for planning next design and may apply guidelines 1-1 and 1-2. Step 6 enters the pilot run procedure that starts with experimental design (guidelines 3-1, 3-2, 3-3, and 3-4), followed by
simulation execution and output data analysis (guidelines 2-2, 4-2, 6-3, and 6-4). At the end, guideline 4-1 may be used to judge whether remaining execution time is enough. Step 7 compares alternative systems and draws conclusions based on guidelines 5-2, 5-3, and 6-2.
The above process is based on the multiple system comparison. For single system evaluation, the process still starts with Step 1, but skips Step 7. The purpose of this problem-solving process is to incrementally design and evaluate simulation problems. It is intended to be a simplified expert model for beginners and emphasizes learning problem solving while building an appropriate mental model.
4.3 Learning-Unit Design
The learning environment includes five major instruction units: learning guidance, introduction to simulation, simulation theory, design strategy, and case-oriented learning. Learning guidance provides a roadmap for three different skill levels of users. Introduction to simulation briefly introduces
simulation characteristics, applicable domains, and its pros and cons. Simulation theory presents fundamental simulation knowledge that includes theory and techniques in input/output data analysis. Design strategy includes both the problem-solving guidelines and problem-solving process as described in Section 4.1 and 4.2. Case-oriented learning assists the users to learn from solving a problem using embedded guidelines and expert process. This is the major interaction method designed to enhance learning in this research. The prototype system also included student record management, message board, and online discussion.
In summary, the above learning units constitute an integrated learning framework that emphasizes both the knowledge and experience during the learning process. The focal point is on the
problem-solving guidelines, problem-solving process, and case-oriented learning units to maximize the effectiveness of the system.
4.4. Interaction Design Guidelines and Demonstrations
We present two screen shots to illustrate the primary interaction design guidelines.
4.4.1 Example 1: Figure 3
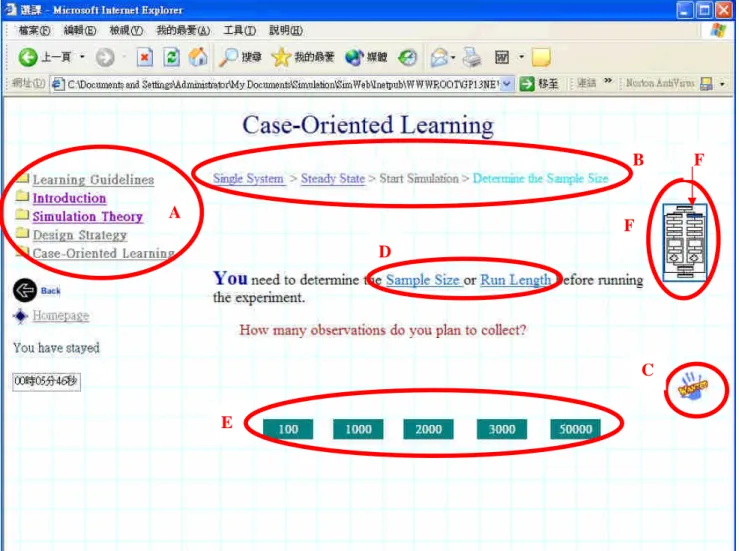
The left side of screen shows the five teaching units (circle A). The discussion of the right side of the screen is divided into eight parts as follows.
(1) The upper screen shows the path of the learning contents (circle B), “case-oriented learning>single system instance >steady state > start simulation > determining sample size”, which not only indicates current position, but also provides hyperlinks to previous screens.
(2) Clicking on the palm-like image near the right edge of the screen (circle C), a window pops up that explains the purpose of current page. This applies the guideline for providing instant online help
on an as-needed basis.
The first two parts, (1) and (2), apply guidelines of avoiding lost, reducing short-term memory
load, stimulating recalls of prior learning and providing convenience reversal browsing.
(3) The center of the main screen displays the dialog between the user and the system. As indicated by the path in (1) above, the current step is determining the initial sample size at the very beginning of the simulation process. The system prompts the user to decide the sample size and simulation time. The user can click on the hyper-linked phrases “sample size”or “simulation time”(circle D) for explanations before making decisions. The applicable guidelines are providing online help
for critical terminology and hiding unnecessary information.
(4) The prompted system message in (3) is shown in the black color with blue underline representing hyperlinks. The prompted question asking for sample size is shown in the red color with five green buttons for selection. The guidelines applied here are using up to seven colors for segmenting
different purposes of information and providing stimulus materials with distinct features.
(5) The green buttons (circle E) provide alternative answers to the current question. If an
inappropriate answer is chosen, the system brings up an explanation window instead of proceeding to the next step. After the user exits the pop-up window, the system retains the same question until appropriate answers are selected. The purpose is to provide situated learning environment,
emphasize constructing knowledge by user, provide information feedback and provide learning guidance.
(6) The question in the dialog actually represents one of the difficult decisions of simulation statistical analysis for beginners. Experiential guideline 1-1 is hidden during the process described in (5). (7) A little flow diagram (circle F) appears on the right side of the screen, just above the blue palm-like
image. Clicking on the image will display a full screen of the problem-solving flow diagram as seen in Figure 2. The shaded blue area (arrow G) within the flow diagram represents the current step of the problem-solving process. The guidelines applied are providing recall of prior
learning and providing learning guidance.
(8) The web pages are designed for paging instead of scrolling as much as possible in order to avoid
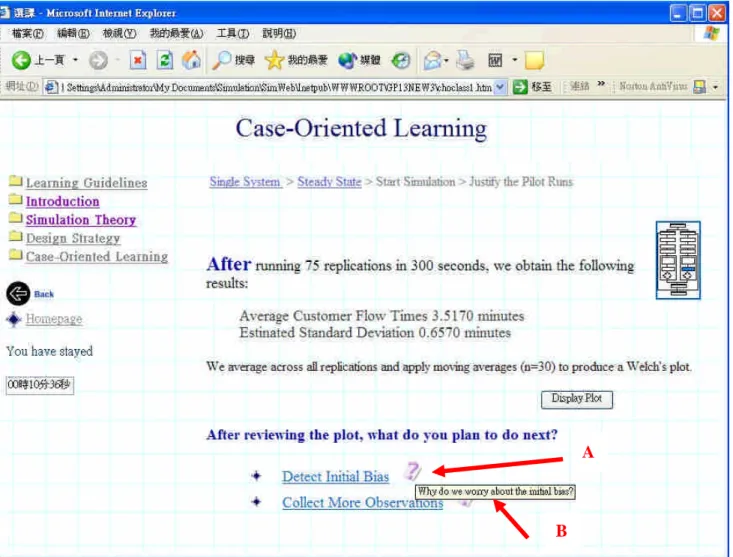
pressure of long documents. 4.4.2. Example 2: Figure 4
Figure 4displays a similar screen as shown in Figure 3 except without the palm-like image and the red color question. The purpose is to be consistent and providing only necessary information or
functions.
(1) The bottom of the screen shows a pink question mark (arrow A). Clicking the image will pop up the explanation (of initial bias detection) for that option. It is a similar function like the palm-like image in Figure 3 but only applicable when the user needs to choose the next step. The applicable guideline is also providing instance online help on a needed basis.
(2) Either the palm-like image or the pink question mark provides optional online help. However, the user may not know their usage at the first glance. Therefore, the system provides balloon help (arrow B as shown in the bottom edge of the screen) that offers a brief explanation when the cursor is near the image. The purpose is to provide interactive proactive clues.
(3) The screen layouts in Figures 3 and 4 address the concise guideline by adapting the following features: page-long content, short paragraphs, wide spacing between paragraphs and sentences, hiding unnecessary information with hyperlink, color segmentation, hierarchical information with selection buttons, and primary information in the middle with bright background color.
(4) In order to retain user’s learning interests for long hours of complicated and difficult domain
knowledge and experience, the system embeds cartoon or scenic images in the learning activities as well as background music to entertain the users.
5. EVALUATION AND CONCLUSION
We present the results of the three-stage formative evaluation and conclude this research at the end.
5.1 Testing Evaluation
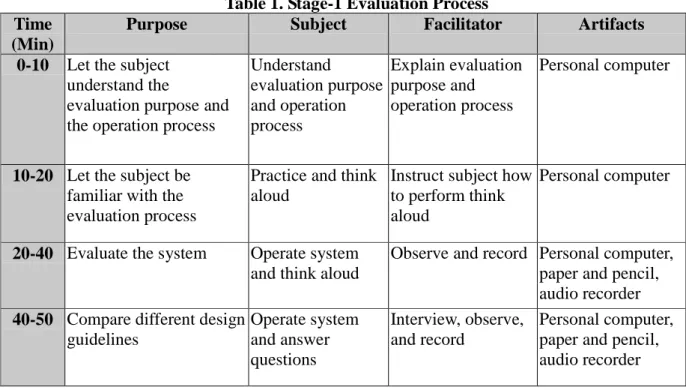
This stage evaluated the early prototyping system through observation and interviewing of users, who each performed a fifty-minute experiment as shown in Table 1. Since this was a developmental stage evaluation, the goal was to validate whether the design concept met the users’needs. Therefore, only two subjects participated in the experiment.
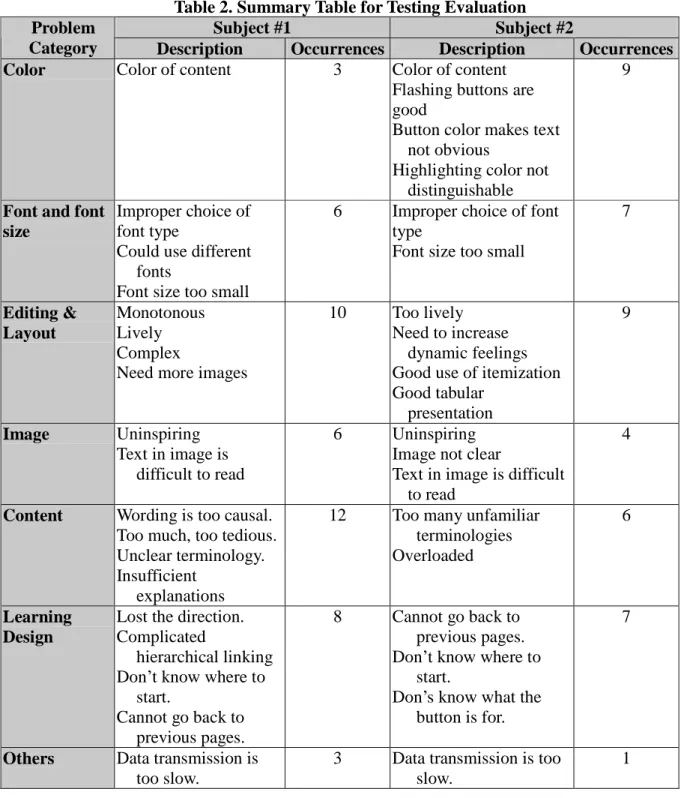
Table 2 summarizes the evaluation results. The first subject, who had a simulation course, focused more on the content and had responded with 12 questions. The second subject, who never had a simulation class, was interested on the interface and had more questions about the color design and the layout. On the content, the first subject clearly knew what to expect and thought that some descriptions of simulation concepts were too tedious and the wording should be more precise, while the second subject was obviously troubled by many unfamiliar terms. On the color design and the layout, the second subject endorsed theuseofbuttons,lists,and tables,whilethefirstsubject’smain concern was the colors of the text. Most suggestions had been modified in later versions of the prototype system.
5.2 Constructive and Executive Evaluation
This stage of evaluation was conducted after the framework of the prototype system was drafted with little details. The goal was to understand the learning material and the appropriateness of the teaching and interface design. Four domain experts participated in the evaluation of the prototype framework. Each expert explored the system differently with an average time of 80 minutes. Opinions were collected during the operations and interviews were conducted after the operations.
Table 3 summarizes the collected problems and shows that experts responded more on the multimedia presentation and content materials. Some experts suggested that background music might be a distraction and the user should be able to switch it off. Another expert suggested that simulation software images and animation icons could be used in addition to cartoon-like graphics. Other
suggestions included adding new materials to increase the depth of the system. However, adding fundamental concepts in order to accommodate students without any simulation course is beyond the scope of this research. All other suggestions were modified accordingly for next stage of testing.
5.3 Summative Evaluation
We conducted a user evaluation to 30 university students who had a 3-credit-hour simulation introductory course. The students were divided into a control group and an experiment group with the control group studying a written material, while the experiment group operating the CBT prototype system. Each session was 60 minutes long and included a 10-minute introduction, a 10-minute simulation test, a 30-minute simulation learning, and another 10-minute test. The experiment group filled out one additional questionnaire regarding the design of the prototype system. Based on the usability goals of efficiency and effectiveness, we divided the evaluation analysis into system design usability analysis and learning performance usability analysis. The system design usability analysis was based on subjective interface opinions. The learning performance usability analysis was based on objective learning scores of the control group, the experiment group, and the overall population.
(1) System design usability analysis
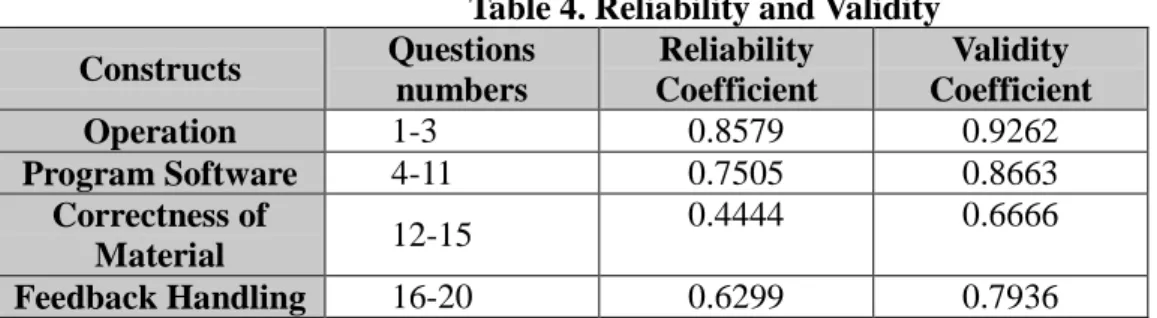
The questionnaire for the web-based learning system was designed based on the CAI program software evaluation rules by Du [2]. Questions were divided into four constructs of operation, program software, correctness of material, and feedback handling. A Likert-type scale ranging from very good (+2), good (+1), average (0), bad (-1) to very bad (-2) were used. Cronbach αcoefficient and content validity coefficient proposed by Lin [4] were used. Table 4 showed both reliability and validity of the questionnaire were acceptable.
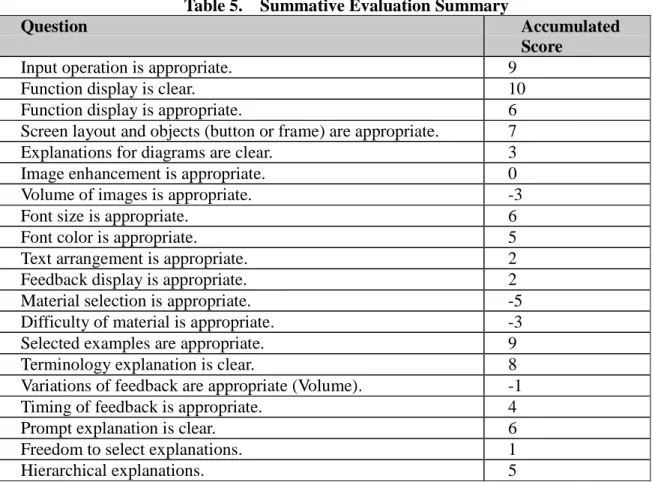
Although problem constructs did not show significant difference, most values in table 5 were positive and implied most subjects approved the system design. Input operation, function display, selected examples, and terminology explanation were rated to be most appropriate. Recall that the first stage of evaluation had indicated that some terminology explanation was unclear or tedious and the experts also raised problems about the function display. This revised version of the CBT system clearly corrected those problems. Item received negative values included volume of images, depth of material, and variations of feedback (volume). We agree that more visually appealing images are needed to enhance the appearance of the system. One can expect a low score for the depth of materials, since most students considered that simulation is difficult and most of the selected materials were not discussed in details in the traditional classroom setting. We also agree that the prototype system needs to enhance its variation in feedback.
In addition, some items were positive but close to zero, such as the visual enhancement and
freedom to select explanations. The first item was highly correlated with volume of images used. We also believe that adding more images will visually improve the appearance of the system. The second item can be attributed to the observation that most subjects were confused when facing difficult
scenarios and not realizing that some images were hidden buttons for explanations. This situation can be improved by adding mouse-over bubble help.
(2) Learning Effects Evaluation Analysis
Learning performance analysis is based on the student’s subjective opinions and the objective test scores before and after the learning period. The test scores after the learning period showed significant increases. This suggests that the intended simulation tactics in Section 4.1 are useful for assisting
learning simulation analysis.
Although the experiment group did marginally better, the t-test applied on the test scores after the learning period did not find significant difference between the two groups. That is, learning the prototype CBT system led to little improvement on the test scores. We suspect that the 30-minute learning period may not be long enough to detect possible differences. We must also point out that the experiment might produce stronger results if the evaluation were conducted with a problem-solving format on more realistic cases instead of easily memorized questions-and-answers format.
The additional questions in the second test indicated that two items “boring”and “interesting”had significant differences between the two groups with α=0.05. That is, the experiment group felt more interest and fun learning simulation analysis via the CBT system. This suggests that the prototype system retained the learners’motivation better than the written format and if learning time were increased, the experiment group may start showing significant improvement on test scores.
Furthermore, the interactions on the prototype system provided options for constructive learning that could not be included in the written format.
Even though the t-test showed insignificant difference on the “convenient”item between the two groups, the data revealed that more subjects in the control group favored the format they used. Some of them stated that the written format can be easily browsed through or carried around. Since the material contains most of the same simulation content as the prototype system, we feel that a good option is to make written material downloadable to students using the CBT system.
5.4 Conclusions
This research developed a CBT system to assist the students learning simulation output analysis, which is considered to be more difficult than the simulation modeling. The summative evaluation verified that the simulation tactics we developed did achieve significant improvements on test scores in either the CBT or written format. Although not directly supported by the test scores, the evaluation showed that the case-oriented learning interactions and design guideline-oriented interface retained learning interest better than the written format. Subjects also favored the convenience of written materials due to its portability. A major implication of the above results is that if normal classroom materials can supplement the simulation statistical expertise, students should be able to learn simulation problem-solving skill more effectively from the start. Moreover, if the supplemental material can be presented in a web-based CBT format, students should be able to achieve the same level of
understanding more efficiently.
ACKNOWLEDGMENTS
This research project was partially sponsored by National Science Council of the Republic of China with grant number NSC 87-2218-E-214-013. The authors would also like to thank the editor’s valuable comments for making this paper better presented.
REFERENCES
Ausserhofer, A. (1999) Web-Based Teaching and Learning: A Panacea? IEEE Communications Magazine, March 92-96.
Dix, A. J., J. E. Finlay, G. D. Abowd, and R. Beale. (1998). Human-Computer Interaction, 2nd ed., Prentice Hall Europe.
Du, J. (1991). Evaluation Rules for CAI Class Software, Information and Education, Vol. 25, pp.46-51. Goldsman, D., B. L. Nelson, and B. Schmeiser. (1991). Methods for Selecting the Best System, in
Proceedings of the 1991 Winter Simulation Conference, 177-186.
Gagné, R. M., L. J. Briggs and W. W. Wager. (1988). Guidelines of Instructional Design, 3rd ed., Harcourt brace Jovanovich College Publishers.
Harris, D. A. (1999). Online Distance Education in the United States. IEEE Communication Magazine, Vol. 37, Iss. 3, pp. 87-91.
Johnson, J. (2000). GUI Bloopers: Don'ts and Do's for Software Developers and Web Designers, Morgan Kaufmann Publishers.
Kleijnen, J. P. C. (1987). Statistical Tools for Simulation Practitioners, Dekker. Kolb, D.A. (1984). Experiential Learning, Prentice Hall.
Kostur, P. (1999). Designing Web-based Learning Materials. In proceedings of Communication Jazz: Improvising the New International Communication Culture. 297-298
Lu, Y. (2000). A Computer-AidedInstruction Environmentforthe DesignandAnalysis of SystemsSimulation Experiments. Master thesis, Graduate School of Management, I-Shou University.
Marcus, A. (1992). Graphic Design for Electronic Documents and User Interfaces, ACM Press, 77-92. Mellichamp, J. M., and Y. H. Park (1989). A Statistical Expert Syatem for Simulation Analysis,
Simulation, 52(4), 134-139.
Newman, W. M. and Lamming, M. G. (1995). Interactive System Design, published by Addison-Wesley. Nielsen, J. (2000). Designing Web Usability: The Practice of Simplicity, New Riders Publishing,
Indianapolis.
Norman, D. A. (1986), Cognitive engineering. In User Center System Design (Norman, D. A. and Draper, S. W., eds.), pp. 31-65. Hillsdale, NU: Lawrence Erlbaum Associates.
Parker, L. A., Hough, J. and Parker, A.L. (1996). Making the Connection: Techniques for Distance Educator, Teltraining Institute.
Preece, J., Rogers, Y., Sharp, H., Benyon, D., Holland, S., and Carey, T. (1996). Human-Computer Interaction, p. 603, Addison-Wesley.
Ramachandran, V., D. L. Kimbler, and G. Naadimuthu. 1988. Expert Post-Processor for Simulation Output Analysis, Computers Ind. Engng, 15, 1-4, 98-103.
Rohrer, M. and Banks, J. (1998). Required skills of a simulation analyst. IIE Solutions, 30, 5, 20-23. Sauter, V. (1997), Decision Support Systems, Wiley.
Shneiderman, B. 1992. Designing the User Interface: Strategies for Effective Human-Computer Interaction, 2nd ed., Addison-Wesley.
Siddiqui, K. J. and Zubairi, J. A. (2000). Distance Learning using Web-based multimedia environment, in Proceedings of Academia/Industry Working Conference on Research Challenges, 27-29, April, 325-330.
Taylor, R., and R. D. Hurrion. (1988). An Expert Advisor for Simulation Experimental Design and Analysis, AI and Simulation, 238-244.
Tao, Y. (1999). Teaching the Experience of Simulation Analysis, in proceedings of European Simulation Multi-conference, June 1-4, Warsaw, Poland.
Tao, Y. (2000). A Study of the Application Model for Interactive Web Page Design, Journal of I-Shou University, Vol. 7, pp.233-244.
Tao, Y. and S. Guo. (2000). A mental Model for Simulation Statistical Analysis, Summer Computer Simulation Conference, Vancouver, British Columbia, July 16-20, 2000.
Tao, Y. and B. L. Nelson. (1997). Computer-Assisted Simulation Analysis, IIE Transactions, Vol.29, 221-231.
Taylor, R. and Hurrion, R. D. (1988). An expert advisor for simulation experimental design and analysis. In Troy Henson, editor, AI and simulation, 238-244.
Ubell, R. (2000). Engineers Turn to E-Learning. IEEE Spectrum, October, Vol. 37, Iss. 10, pp. 59-63. Whitehouse, D., and G. Pellegrin. (1995). Computer Based Training, Is it Worth the Money, Pulp and
Paper Industry Technical Conference.
Wiesner, P. (2000) Distance education: rebottling or a new brew? In Proceedings of IEEE, Vol. 88, No. 7, July, 1124-1130.
Zu, W. and S. Chang. (1998). The analysis of user interface virtual class. Proceedings of the
International Conference on Information Management Research and Practice, Fu-Ren University, Taiwan, 58-65.
1. Paradigm
1-1 Perform a simple pilot run for generating minimum data at the very beginning. 1-2 Design next optimal experiment from accumulated data.
1-3 Nonlinear reasoning logic.
2. System/Parameter/System Instance
2-1 Collect the problem properties continuously.
2-2 Take advantages of existing data for predicting future analysis during the problem-solving process.
2-3 Divide the major task into smaller ones that can be solved easily or easier.
2-4 Group system instances based on the similarity at the early stage of problem-solving process.
2-5 Eliminate inferior system instances.
3. Design/Experiment/Resource
3-1 A design interrelates with many resources. 3-2 Keep in mind the remaining time.
3-3 Design with available resource in mind.
3-4 Dynamically design parameters during the experiment process.
4 Output Data
4-1 Incremental data generation.
4-2 Manage the data size by batching data.
5. Statement /Scope /Result
5-1 Anything said about the system instance is a statement.
5-2 Keep original documentation during the problem-solving process. 5-3 Propose suggestions to simulation results.
6. Analysis /Procedure
6-1 Use existing tools to save time.
6-2 Use statistical procedures within user’s capabilities. 6-3 Use visual methods for exploring data.
6-4 Confirm the visual judgment with test procedures.
Figure 2. Problem-solving flow of simulation analysis.
simulation perform and analysis
estimate data generation speed estimate data error level
detect initial bias determine on accuracy determine on run length
experiment design more runs? yes Pilot Run report yes no simulation perform and analysis
estimate data generation speed estimate data error level
determine on accuracy determine on run length
experiment design
more runs?
yes
Types of simulations?
one alternative selection
Steady State Terminating
alternative system comparing method chose
VRT used or not pilot information generation no compare alternative systems finish comparing? yes multi-alternative systems step 1 step 2 step 3 step 4 step 5 step 6 step 7
one alternative selection alternative system comparing method chose
VRT used or not
pilot information generation
Figure 3.. Sample screen # 1 (Translated from Chinese). A B C D E F F
Figure 4 Sample screen #2 (Translated from Chinese). A
Table 1. Stage-1 Evaluation Process Time
(Min)
Purpose Subject Facilitator Artifacts
0-10 Let the subject understand the
evaluation purpose and the operation process
Understand evaluation purpose and operation process Explain evaluation purpose and operation process Personal computer
10-20 Let the subject be
familiar with the evaluation process
Practice and think aloud
Instruct subject how to perform think aloud
Personal computer
20-40 Evaluate the system Operate system and think aloud
Observe and record Personal computer, paper and pencil, audio recorder
40-50 Compare different design
guidelines Operate system and answer questions Interview, observe, and record Personal computer, paper and pencil, audio recorder
Table 2. Summary Table for Testing Evaluation
Subject #1 Subject #2
Problem
Category Description Occurrences Description Occurrences
Color Color of content 3 Color of content
Flashing buttons are good
Button color makes text not obvious
Highlighting color not distinguishable
9
Font and font size
Improper choice of font type
Could use different fonts
Font size too small
6 Improper choice of font type
Font size too small
7 Editing & Layout Monotonous Lively Complex
Need more images
10 Too lively Need to increase
dynamic feelings Good use of itemization Good tabular presentation 9 Image Uninspiring Text in image is difficult to read 6 Uninspiring Image not clear
Text in image is difficult to read
4
Content Wording is too causal. Too much, too tedious. Unclear terminology. Insufficient
explanations
12 Too many unfamiliar terminologies Overloaded
6
Learning Design
Lost the direction. Complicated
hierarchical linking Don’t know where to
start.
Cannot go back to previous pages.
8 Cannot go back to previous pages. Don’t know where to
start.
Don’s know what the button is for.
7
Others Data transmission is too slow.
3 Data transmission is too slow.
Table3. Constructive and Executive Evaluation Summary Table Problem
Category
Item Description
Provide bubble help to some graphical buttons when the pointer is near.
Operation Functional
display
The pointer does not change to a hand when pointing at some buttons.
Explanative diagrams
Text in image is not clear.
Font color Color of some hyperlink texts is inadequate.
Content volume
Some headings are too long, not concise.
Background music
It is unnecessary to have music on every page. Too little animation
Program software presentation
Animation
Can add animation screens of simulation software.
Exchange event column with customer number in Table “Simulation Characteristics” because users are more concerned with messages in the event column.
Sample design
Add customer tolerance time before balking in the steady state example.
Add basic concepts of simulation for novice to use this system as well
Add an introduction of random numbers generation
Material selection
Add an example on the implementation of antithetic variates.
Correctness of material
Material difficulties
The“in-depth understanding”unit is too difficult to most users and should be placed after “case-oriented learning”.
Table 4. Reliability and Validity Constructs Questions numbers Reliability Coefficient Validity Coefficient Operation 1-3 0.8579 0.9262 Program Software 4-11 0.7505 0.8663 Correctness of Material 12-15 0.4444 0.6666 Feedback Handling 16-20 0.6299 0.7936
Table 5. Summative Evaluation Summary
Question Accumulated
Score
Input operation is appropriate. 9
Function display is clear. 10
Function display is appropriate. 6
Screen layout and objects (button or frame) are appropriate. 7
Explanations for diagrams are clear. 3
Image enhancement is appropriate. 0
Volume of images is appropriate. -3
Font size is appropriate. 6
Font color is appropriate. 5
Text arrangement is appropriate. 2
Feedback display is appropriate. 2
Material selection is appropriate. -5
Difficulty of material is appropriate. -3
Selected examples are appropriate. 9
Terminology explanation is clear. 8
Variations of feedback are appropriate (Volume). -1
Timing of feedback is appropriate. 4
Prompt explanation is clear. 6
Freedom to select explanations. 1