1 April 1999
Ž .
Optics Communications 162 1999 7–10
Common-path heterodyne interferometric detection scheme
for measuring wavelength shift
Ju-Yi Lee, Der-Chin Su
)Institute of Electro-Optical Engineering, National Chiao Tung UniÕersity, 1001 Ta-Hsueh Road, Hsin-Chu, Taiwan Received 7 April 1998; received in revised form 5 January 1999; accepted 2 February 1999
Abstract
When a linearly polarized light passes through a uniaxial crystal, small wavelength shifts will introduce phase difference variations between s- and p-polarizations. These phase difference variations can be measured accurately by heterodyne interferometry. Based on these facts, a common-path heterodyne interferometric detection scheme for measuring wavelength shift is proposed. This scheme has the advantages of both common-path interferometry and heterodyne interferometry.
q1999 Elsevier Science B.V. All rights reserved.
Keywords: Wavelength shift; Heterodyne interferometry
1. Introduction
An optical interferometric sensor using wavelength
w x
changes as the measurand is becoming important 1–3 . Its resolution mainly depends on how small wavelength shift can be detected. In order to increase the resolution, Ning et
w x
al. 4 developed an interferometric detection scheme for measuring the small wavelength shift. In Ning’s unbal-anced interferometric configuration, the small wavelength shift was converted into interference phase variation. To
Ž .
stabilize the optical path difference OPD , an additional stabilized light source and a feedback control system were used to lock the average OPD at the designated value. Thus, the optical structure becomes very complex and is difficult to operate.
In this paper, a novel method for measuring small wavelength shifts is presented, based on the similar
consid-w x
eration of Shyu et al. 5 who developed the technique for measuring the retardation of a wave plate with heterodyne interferometry. When a linearly polarized light passes
)
Corresponding author. E-mail: [email protected]
through a uniaxial crystal, the small wavelength shifts will introduce phase difference variations between s- and p-polarizations; these phase difference variations can be measured accurately by heterodyne interferometry. Be-cause of its common-path heterodyne interferometric con-figuration, it has both the advantages of common-path interferometry and heterodyne interferometry, such as sim-ple optical structure, easy operation, high stability against air turbulence, and high measurement accuracy.
2. Principle
For convenience, the qz axis is chosen along the propagation direction and the x axis is along the horizontal direction. Let the incident light be linearly polarized at 458 with respect to the x axis.
2.1. Phase difference Õariations resulting from waÕelength shifts
As shown in Fig. 1, when linearly polarized light
Ž .
passes through the uniaxial crystal UC whose optical axis
0030-4018r99r$ - see front matter q 1999 Elsevier Science B.V. All rights reserved. Ž .
( ) J.-Y. Lee, D.-C. Su r Optics Communications 162 1999 7–10 8
Fig. 1. Linearly polarized light passes through a uniaxial crystal.
is along the x-axis, the phase difference of s-polarization
w x
relative to p-polarization is 6 2p
f s nL,
Ž .
1l
where l is the wavelength of light, n is the birefringence index difference and L is the thickness of the uniaxial crystal. If the wavelength has a small variation D l, then the variation in phase difference is
2p nL
Df ( y 2 Dl.
Ž .
2l Ž .
Eq. 2 can be rewritten as
l2
Dl ( y Df .
Ž .
32p nL
2.2. Phase difference Õariation measurement with hetero-dyne interferometry
w x
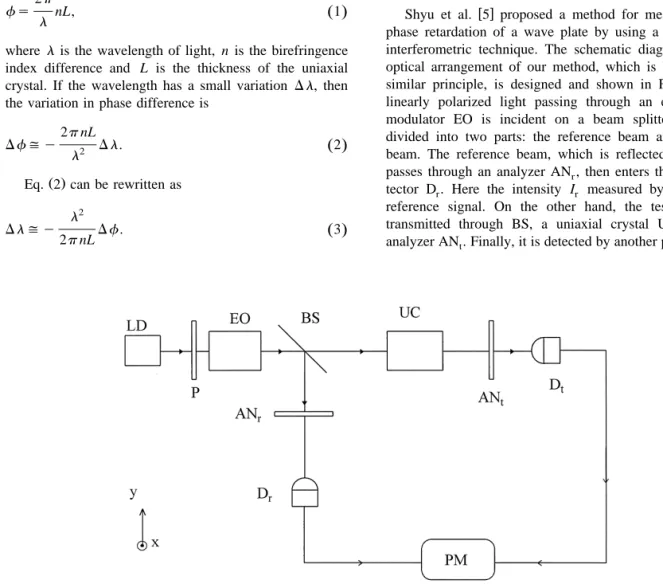
Shyu et al. 5 proposed a method for measuring the phase retardation of a wave plate by using a heterodyne interferometric technique. The schematic diagram of the optical arrangement of our method, which is based on a similar principle, is designed and shown in Fig. 2. The linearly polarized light passing through an electrooptic modulator EO is incident on a beam splitter BS and divided into two parts: the reference beam and the test beam. The reference beam, which is reflected from BS, passes through an analyzer AN , then enters the photode-r tector D . Here the intensity I measured by D is ther r r reference signal. On the other hand, the test beam is transmitted through BS, a uniaxial crystal UC and an analyzer AN . Finally, it is detected by another photodetec-t
Fig. 2. Schematic diagram for measuring the phase difference variations; LD: laser diode; P: polarizer; EO: electrooptic modulator; BS: beam splitter; UC: uniaxial crystal; AN: analyzer; D: photodetector; PM: phase meter.
( )
J.-Y. Lee, D.-C. Su r Optics Communications 162 1999 7–10 9
tor D , and the intensity I measured by D is the testt t t signal.
If the fast axis of EO is in the x-axis, and a sawtooth signal of angular frequency v and amplitude Vl r2, the half-wave voltage of EO, is applied to EO, then using the Jones calculus we can get
1 I s
w
1 q cos v t q fŽ
.
x
,Ž .
4 r r 2 and I0 I sw
1 q cos v t q fŽ
.
x
.Ž .
5 t1 1 2 Ž . Ž .In Eqs. 4 and 5 , f and f are the phase differencesr l between s- and p-polarizations owing to the reflection at BS and the passage of UC, respectively; I is the intensity0 of the test beam relative to the reference beam. These two sinusoidal signals are sent to the phase meter PM as shown in Fig. 2. The phase difference between the reference signal and the test signal,
fX1sf y f ,1 r
Ž .
6 can be obtained. In the second measurement let the wave-length be changed to l q D l, the test signal has the form10
I s
w
1 q cos v t q fŽ
.
x
.Ž .
7t2 2
2
Therefore, the phase meter at this time represents
fX2sf y f .2 r
Ž .
8Ž . Ž .
Subtracting Eq. 6 from Eq. 8 , we get a phase
difference variation
Df s f y f
Ž
2 r.
yŽ
f y f1 r.
sf y f .2 1Ž .
9Ž . Ž .
Finally, by substituting Eq. 9 into Eq. 3 , we can evaluate the wavelength shift with high accuracy.
3. Experiments and results
To show the feasibility of this technique, the small
Ž
wavelength shifts of a laser diode Model HL 6720G,
.
manufactured by Hitachi Ltd. were measured. It has a central wavelength of 672 nm and its wavelength variation is proportional to the injection current. An electrooptic
Ž
modulator Model PC200r2, manufactured by England
.
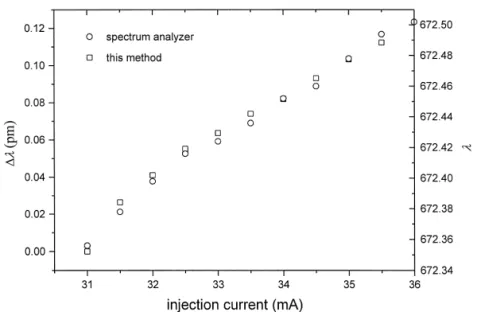
Electro-Optics Developments Ltd. with a half-wave volt-age of 220 V was used in this test. The frequency of the externally modulated sawtooth signal was 2 kHz. And a uniaxial crystal made of quartz with birefringence index difference n s 0.009 and thickness L s 10.00 mm was used. Both the electrooptic modulator and the uniaxial crystal were in contact with a temperature stabilizer which had been fixed at 25.08C. First, we measured the phase difference variations as the injection currents were varied and the laser diode temperature was fixed at 10.08C by a temperature controller. Second, the data of the phase
dif-Ž .
ference variation were substituted into Eq. 3 to calculate the corresponding wavelength shifts. The experimental results between the wavelength shift and the wavelength versus the injection current are shown in Fig. 3. In this figure, the symbols I and ` represent the values mea-sured with this method and an optical spectrum analyzer, respectively.
( ) J.-Y. Lee, D.-C. Su r Optics Communications 162 1999 7–10 10
4. Discussions
Ž .
From Eq. 3 , we can get
Lerr nerr Dferr
DlerrsDl
ž
q q/
,Ž
10.
L n Df
where D lerr, Lerr, nerr and Dferr are the errors in the wavelength shift, crystal thickness, birefringence index
< <
difference, and phase difference, respectively. L rL iserr
< <
equal to a Terr, where a is the coefficient of linear expansion of UC and Terr is the temperature drift of the temperature stabilizer. In our experiment, they are 1.22 = 10y58Cy1 and 0.18C, respectively. Under the condition
T s 0.18C, nerr err nearly equals zero. To evaluate Df , aerr He–Ne laser was introduced into the setup shown in Fig. 2 to replace LD. We found that the phase difference varied
0.038 within 1 min, i.e., Dferrs0.038. Assuming the
measured wavelength shift range D l is 0.1 nm, then the phase difference variation Df is about 7.28 according to
Ž .
Eq. 2 . Therefore, by substituting these experimental data
Ž . y4
into Eq. 10 a resolution D lerrof 4.2 = 10 nm can be obtained.
Owing to its common-path configuration, our system has high stability against air turbulence and environmental vibrations. And because it measures the phase difference instead of the light intensity, it is free of influences from the instability of a light source. Furthermore, it has a better resolution.
5. Conclusion
In this paper, a novel method for measuring a small wavelength shift is presented. If a linearly polarized light
passes through a uniaxial crystal, then there is a phase difference variation between s- and p-polarizations as the light has a small wavelength shift. This phase difference variation is proportional to the product of the wavelength shift, the birefringence index difference and the thickness of uniaxial crystal. We have measured the phase difference variation by using a heterodyne interferometric technique.
Ž .
By using Eq. 3 , the corresponding wavelength shift is obtained. This method has both the merits of common-path interferometry and heterodyne interferometry, such as sim-ple optical structure, easy operation, high stability against air turbulence, and high measurement accuracy.
Acknowledgements
This study was supported in part by the National Science Council, Taiwan, under contract NSC 86-2215-E-009-013.
References
w x1 B.T. Meggit, White light interferometric sensors, in: K.T.V.
Ž .
Grattan, B.T. Meggitt Eds. , Optical Fiber Sensor Technol-ogy, Chapman & Hall, London, UK, 1995, p. 269.
w x2 X.Q. Jiang, J. Kemp, Y.N. Ning, A.W. Palmer, K.T.V.
Grat-Ž .
tan, IEEE Photon. Technol. Lett. 8 1996 1055.
w x3 X.Q. Jiang, J. Kemp, Y.N. Ning, A.W. Palmer, K.T.V.
Grat-Ž .
tan, Appl. Opt. 36 1997 4907.
w x4 Y.N. Ning, W.J. Shi, K.T.V. Grattan, A.W. Palmer, B.T.
Ž .
Meggitt, Opt. Commun. 138 1997 27.
w x5 L.H. Shyu, C.L. Chen, D.C. Su, Appl. Opt. 32 1993 4228.Ž . w x6 Yariv, P. Yeh, Optical Waves in Crystal, Wiley, New York,