國
立
交
通
大
學
管理科學系 碩士班
碩士論文
消費者參與客製化過程以及提供範例對產品滿意度的
影響
The Effects of Providing Examples and Customer
Participation on Product Satisfaction
研 究 生 : 黃以江
指導教授 : 張家齊 博士
中 文 摘 要
大量客製化可以被廣泛的定義為一個可以讓消費者共同參與設
計產品的過程,消費者可以透過這個過程讓產品本身或是公司提
供的服務,更符合他們的需求。在這個以消費者為中心的經濟社
會裡,消費者越來越想要有機會可以自己設計自己想要的產品。
本篇研究旨在探討顧客參與設計對產品滿意度的影響,並研究在
顧客知覺到不同的客製化難易度下,滿意度的變化情形。結果指
出提供一個簡單的設計範例給顧客—顧客感受到較容易進行客
製化—較能夠有效的增加顧客滿意度;另外,客製化產品符合顧
客自我概念的程度,也在顧客參與和產品滿意度的關係中扮演的
中介的角色。
Abstract
Mass customization is broadly defined as “a customer co-design process of products and services which meet the needs of each individual customer with regard to certain product features.” In this consumer-centric economy, more and more consumers desire the opportunity to design their own product. This study investigated the effects of customer participation on satisfaction and the moderating effect of examples provided in co-design. The results showed that the effect of customer participation is contingent upon whether the example provided is easy or hard to achieve. Customer participation can yield the highest level of customer satisfaction while an example is provided in the co-design process than when no example or difficult example is provided. The author also examined the mediation effect of self-congruity on the relationship between customer participation and satisfaction.
Acknowledgement
There are many individuals who have helped guide and support me through the past several months. First of all, I must sincerely appreciate Dr. Chang Chia-Chi—a best supportive and patient advisor. Her insights and encouragement has consistently inspired me and kept me on the right track, from the beginning of this study to its finish. Chang taught me how to think more in-depth, and how to conceptualize these thoughts that could be studied and discussed. I hope that I could learn more from her, and contribute to the world just as what she has been doing.
Second, I must thank for my parents, since they could forgive me that I have not been with them for several months. Their phone calls were always my energizer. Thanks also to my best friend Sherry. I think I spent more time with her discussing my study and life than with anybody else. Other individuals who should not be unacknowledged include Vilina Chen, Wish Liao, and other “teammates” in the Chia-Chi’s group, who have provided such excellent and useful academic support to me.
Last, but certainly not least, there are my friends, Eric Wang, Felix Chuang, and other friends, who have always supported and encouraged me. Thank you for always being at my side.
Table of Contents
中 文 摘 要 ... ii
Abstract... iii
Acknowledgement ... iv
Table of Contents ... v
List of Tables... vii
List of Figures... viii
Chapter 1 – Introduction... 1
1.1 Research Background... 1
1.2 Research Objectives... 3
1.3 Research Process ... 5
Chapter 2 - Literature Review ... 6
2.1 Research Framework... 6
2.2 Customer Participation in Customization Process ... 6
2.3 Example Provided in Co-design ... 9
2.4 The Role of Self-Congruity ... 12
Chapter 3 – Research Methodology ... 16
3.1 Overview ... 16
3.2 Stimulus and Manipulation of Customer Participation ... 17
3.3 Pretest on Example Provided... 18
3.4 Experimental Design and Respondents ... 18
3.5 Procedure ... 20
3.6 Measurements ... 21
3.6.1 Measures of Independent Variable and Covariate ... 21
Chapter 4 – Results ... 25
4.1 Manipulation Check and Data Analysis ... 25
4.1.1 Manipulation Check ... 25
4.1.2 Factor Analysis ... 26
4.1.3 Reliability... 28
4.2 Hypothesis Testing ... 28
4.2.1 Hypothesis 1 and the effect of Customer Participation on Satisfactions. ... 28
4.2.2 The Mediation Analysis ... 32
Chapter 5 – Discussion and Conclusion... 38
5.1 The Summary of Results and Conclusions ... 38
5.2 Implications ... 40
5.3 Limitations and Future Research ... 42
References ... 45
Appendix 1. Measures of Dependent Variables (English Questionnaire) ... 51
Appendix 2. Chinese Questionnaire ... 53
Appendix 3. Experimental Tools... 61
List of Tables
Table 1 Cells of Experimental Design ...19
Table 2 Descriptive Statistics of Manipulation Check ...25
Table 3.1 Factor Analysis (i)...27
Table 3.2 Factor Analysis (ii)...27
Table 4 Reliability Statistics ...28
Table 5 Descriptive Statistics of Satisfaction ...28
Table 6 Summary of ANCOVA ...29
Table 7 Adjusted Means of Satisfactions...30
Table 8 Descriptive Statistics of Self-Congruity ...33
Table 9 The effect of customer participation on self-congruity when provided different example ...33
Table 10 The effect of customer participation on satisfactions when provided different example ...34
List of Figures
Figure 1 Research Flow ...5
Figure 2 Research Framework ...6
Figure 3 Differences between NoP and P group ...30
Figure 4 Interaction of Participation and Example Provided ...31
Figure 5.1 The Path Diagram (when no example was provided)...35
Figure 5.2 The Path Diagram (when an easy example was provided) ..36
Figure 5.3 The Path Diagram (when an hard example was provided) .37 Figure 6 Screenshot of Mr. Picassohead ...61
Chapter 1 – Introduction 1.1 Research Background
Since firms and enterprises can acquire their customers’ data dynamically and
effectively because of the advances in information technology, the more finer
segmentation seems possible to be realized (Kara & Kaynak, 1997). An increasing
number of companies in different industries have successfully implemented the strategy
of customization, such as Adidas and DELL. The project Mi Adidas allows consumers
to order unique footwear by specifying their preferences. Being one of the largest
computer retailers, DELL provides customers the opportunity to configure the
components of computers, including CPU, Operation System and so forth. With limited
resources, companies may not always afford the highest level of customization. Mass
customization based on efficient and flexible modulization design is the most
commonly adopted strategy. It offers firms the ability to strike the balance between
allowing customers to select and customize their products for better fit their needs and
cost effectively.
After the industrial revolution in the eighteenth century, manufacturing has been
about producing more and more stuff in an efficient way (mass production) so that
consumers can buy products at low prices yet may not be best-preferred. With the
less preferred products and more willing to pay the premium in order to obtain exactly
what they need. Pine, Peppers, and Rogers (1995, p. 103) argued that “Customers,
whether consumers or businesses do not want more choices. They want exactly what
they want—when, where, and how they want it—and technology now makes it possible
for companies to give it to them.” Mass customization is about producing the “right
stuff” (Cox & Alm, 1998).
Mass customization is also an important issue to transform and improve our
high-technology industry in Taiwan. An international conference about mass
customization was held by Industrial Technology Research Institute (ITRI) in 2006.
How to apply the concept of mass customization was mainly discussed in the
conference, and ITRI addressed that the time for the firms in Taiwan to apply
approaches of mass customization is coming up.
As mass customization becomes an increasingly popular strategy, it is important
to identify the determinants of mass-customization success. Da Silveira et al. (2001)
pointed out that customer-driven design is one of the enablers in the core of mass
customization system. They maintain that successful mass-customizing strategy for
firms involves offering suitable conditions for the customer “to initiate the design
process of a product” (Da Silveira et al., 2001, p. 6). Therefore, the purpose of this
comfortable while interacting with firms. We intend to investigate the effects of
customer participating in the design process on product satisfaction while providing
different conditions.
1.2 Research Objectives
When providing suitable conditions for customer to design a product that they
want, marketers should ensure that customers are not confused or frustrated while
facing a customizing task. Since companies engaging in mass customization tend to
offer customers various features and options for customers to configure their own
products and services, customers who are lack of prior related knowledge might have
the difficulty in finding what they really want in the huge number of potential options
(Huffman & Kahn, 1998). Customers who are lack of related knowledge or ability may
find the design process difficult for them to achieve without external help. To provide
some cues or hints may help participants when they are involving in the customization
process. Particularly, when customers are involved in co-designing their own products,
external help such as an example provided as cues as to how design customized
products might be critical in influencing a customer’s overall evaluation of the whole
customization process. However, customers be intimidated by an example that is too
less willing to participate. Maybe not all aids or external inspirations consistently are
effective in guiding customers throughout the whole customizing process. What should
firms do in order to provide the proper help so that customers will be more willing to
participate in the customizing process? Furthermore, if the co-designed product could
be higher evaluated than those not co-designed, does there any possible factors
mediated the relationship between customer participation and satisfaction? Could
participants feel the co-designed product more congruent with their self-images? These
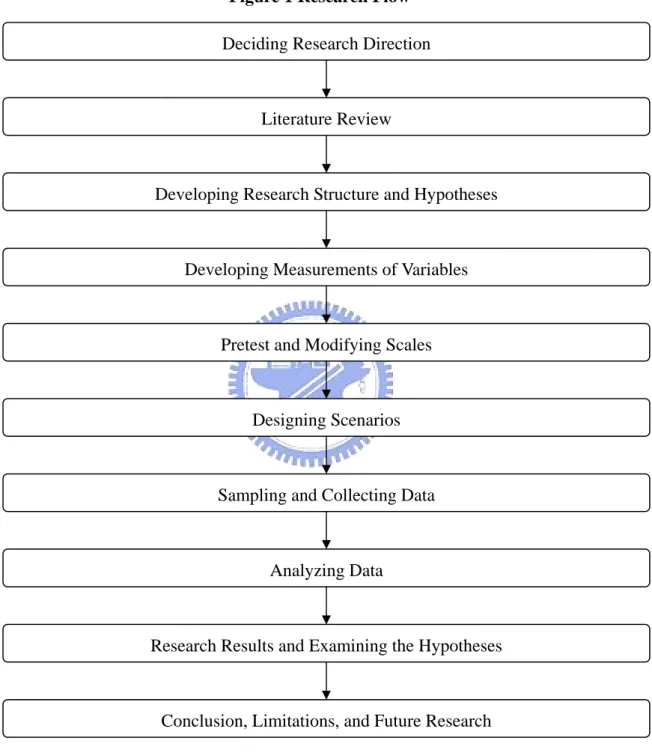
1.3 Research Process
The research flow is as followings:
Figure 1 Research Flow Deciding Research Direction
Designing Scenarios
Sampling and Collecting Data
Analyzing Data
Research Results and Examining the Hypotheses
Conclusion, Limitations, and Future Research Literature Review
Developing Research Structure and Hypotheses
Developing Measurements of Variables
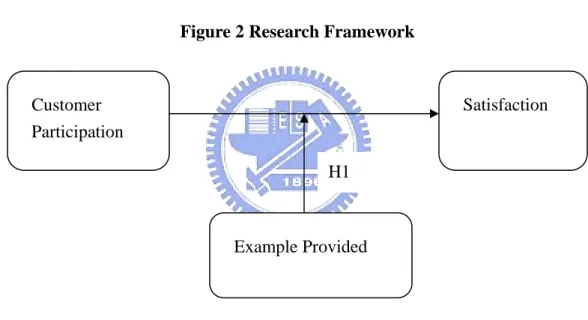
Chapter 2 - Literature Review 2.1 Research Framework
The major focus of this research is to analyze whether easy or hard or none
presence of an example provided would affect customers’ satisfactions of final outputs.
Here is our main conceptual model in this study (Figure 2), and those variables will be
discussed in the following literature reviews.
Figure 2 Research Framework
2.2 Customer Participation in Customization Process
Early research has proposed that consumption increasingly becomes part of
productive process, a feature that distinguishes between the modern and postmodern
marketer-consumer relationships (Firat, Dholakia, & Venkatesh, 1995). In the most Customer
Participation
Satisfaction
Example Provided H1
recent view, customers can play an active role in mass customizing process. They
should not be viewed as just passive receptacles, but a source of productivity gains in
service industry (Fitzsimmons, 1985; Lovelock & Young, 1979). For example,
customers can carry their food to tables and even clean the table after they finished the
meal in fast-food restaurants. Firms are increasingly providing customizing process
rather than finished products in the future. In some cases, when consumers are highly
involved in the design or development process, it is difficult to differentiate between
producer and consumer. Since the design and production is initiated by the consumer,
they becomes “prosumers” (Moffat, 1990), or “co-designers” (Kubiak, 1993).
Prior literature has distinguished the concept of personalization from
customization. Customization is performed by the user (Altan, 2003) and is more
in-depth individualization than personalization, which is performed by the company
and may be seen as an iterative process (Adomavicius & Tuzhilin, 2005; Vesanen &
Raulas, 2006). Customer Participation that we focus in this study is performed and
initiated by the user or purchaser, thus that is consistent with the denotation of
customization.
Customer participation have been defined as the extent to which customers are
involved in producing and delivering the product in previous study (Dabholkar, 1990).
ranging from pure customization to pure standardization: design, fabrication, assembly,
additional custom work, additional services, package and distribution, usage,
standardization. Design, the highest level of mass customization, referred to the process
in which a product is totally designed by a user. It allows customer to design all the
features including the product, how the product could be delivered, and to what extent
could the customer participate in the whole process.
Mass customization may be an essential determinant to increase the customer
satisfaction in the competitive cyberspace-commerce environment. Recent research
(Kramer, 2003) has demonstrated that, holding other variables constant, the product
that was co-produced by customer would be perceived to better fit to a customer’s
preferences. Evidence has shown that co-design of apparels allows customers to feel
more comfortable with the final product if customers found it easy to design (Ulrich,
Anderson-Connell, & Wu, 2003). The successful customization program of Mi Adidas
launched in selected markets in 2001 also suggests the higher customer satisfaction
associated with customization. The price of the tailored shoes were about 30% above
the price of in-line product (Berger & Piller, 2003).
When customers co-design a product, they are creating experience with and
connection to this product, Norman (2005) suggested that the most intimate and highly
themselves. He also argued that if the product could arouse some stories or memories
for the consumer, the appearances or usability of the product might not be as
important as in the other cases. This emotional link between customers and the
customized product is likely to be strengthened through customer participation, thus a
customer would be more likely to keep it.
Bateson (1985) asserted that customers might have the propensity to choose the
“do-it-themselves” approach across many services, even when the service that might
be more expensive or less convenient than traditional services.
In general, consumers who participated in designing their own products will be
more satisfied with the product than those who did not participate in the design
process. However, if customers feel like facing with “mass confusion” (Huffman &
Kahn, 1998) instead of mass customization, they would be likely dissatisfied since it
might be difficult to make choice in such large amount of options. We will discuss
more in-depth in the following section.
2.3 Example Provided in Co-design
Babyak (2006) has proposed the question as to “how many consumers will have
the creativity, desire, time, and energy to customize or design their own products,”
lifestyle and self-image would require more decision-making efforts than usual ones. It
is conceivably that not every person would like to choose customized services which
might require much customers’ input.
Huffman & Kahn (1998) asserted that customers who are frustrated or
disappointed with a series of complicated decision-making task may not be satisfied
with the customizing strategy. One of implications from their study is that the more
complex the customizing task, the more possibility that facilitating the customizing
process would lead to higher satisfactions. In our study, participants are involving with
a design task that can be viewed as facing with infinite choices, since there are millions
possible compositions of lines, abstracts, objects, and colors which provided in the
design interface. Schwartz (2004, p. 71) proposed that “although some choice is
undoubtedly better than none, more is not always better than less,” particularly a
customized offer which allows the consumer to design their own product is a task with
high degree of autonomy of decision-making. Too many choices provided for meeting
the various customers’ needs may sometimes lead to misery and thus becomes as a
psychological burden for customers, especially for “maximizers” (Schwartz, 2004). A
maximizer will always try to find the best available alternatives, whereas a “satisficer”
can accept a “good enough” option. Customers sometimes have not enough clear
Piller, 2003). Therefore, mass customization seems not always a synonym for
satisfaction, especially when the consumer perceives difficult to process the
customizing service.
In order to attain higher customer satisfaction, what firms can do to decrease the
perceived difficulty of the co-design will have the need to be focused. Decision aids
would be helpful for making online purchase process easier and increase perceived
quality (Karaatli, 2002). To extend that applications of online decision aids, customers
might expect some decision aids in traditional shopping process, especially when
customers facing with numerous options. Research showed that if customers think that
they could better identify the appropriate products than the firm, customers’
participating would empower them to perceive more behavioral control, which would
result in higher evaluations of products (Godek, Yates, & Yoon, 2002).
In our case, since we offer an opportunity to permit customers to design their
own product, they may need to construct a possible image in their minds. Thus,
providing some inspirations or stimulus may let participants obtain directions in such
an unconcrete process. If customers receive appropriate cues which would inspire them,
such as an easy example, they are able to modify it into better-preferred one or imitate
some designing skills, so that customers may perceive the co-design as an easy task. An
the contrary, if we offer customer a complicated and hard example, they might perceive
the co-design as a difficult task, and thus their confidence and willingness to participate
might be declined. It is reasonable that providing proper hints might be helpful for
customers to reduce efforts while they are designing products, since the conditions that
will make customers feel more straightforward about the customizing process.
We suggested that the moderate and adequate example provided could assist or
relieve the consumers who are stuck in the confusing or complicating design process,
and not only to provide the customized product but also proper aids for customers
would facilitate the customizing process and increase satisfactions.
Accordingly, the following hypothesis was formulated:
Hypothesis 1: The positive effect of customer participation on satisfaction will be enhanced when provided with an easy example than provided with a
difficult or no example.
2.4 The Role of Self-Congruity
All commodities can provide two kinds of values for consumers, functional and
symbolic. Symbolic values can be derived from experiences of styles, textures, and
higher prices or sales (Jhan, 2005). Products of greater symbolic values can contribute
to help customers fortify their self-image (Tan & Chua, 2003). Possessions close to a
person are possible to be clues to understand the person’s personality. For example,
“possessions often reveal characteristics of their owners” (Richins, 1994, p. 522), which
suggested the inseparable relationships between consumption and self-image.
After being customized, the final product may appear as a unique one to
customers. Ann Marie, Seung-Eun, & Grace (2004) examined that there was a positive
effect of perceived uniqueness of product on willingness to join co-design. Their results
indicated that firms that offer customizing products should focus on the design process
that creates a remarkable experience, as this may differentiate the consumer from others.
Previous study (Johar & Sirgy, 1991) also maintained that high self-congruity could
increase the possibility of attitude change. Customers’ positive attitude would be
enhanced by improving self-image congruence, since the greater the congruence, the
greater the satisfaction of self-esteem needs. Jamal (2004) also proposed that customers
would feel more satisfied with a brand that are more congruent with their self images.
When participating in the design process, the self-image could be enhanced as
the consumer is positioned as a producer in the market (Firat et al., 1995). The process
of creating a customized product is like a process of production. Early research also
intra-action process whereby an individual communicates with himself through the
medium of goods-symbols, thus supporting his self-concept” (Grubb & Grathwohl,
1967, p. 27). A process of participation would create unique experiences in the
shopping process for the product. This experience of participating may establish the
specific connections between the customer and the product, which elicit more
self-relevance with products.
Sirgy (1985) demonstrated that the congruity of self-image and product-image
had positive effects on purchase motivation. Previous study also suggested that the
congruity of self-image could be an effective predictor of product satisfaction (Sirgy,
Dhruv, Tamara, Jae-ok, & et al., 1997). In addition, “consumers with increasing
augmented purchasing power are increasingly attempting to express their personality by
means of individual product choice” (Berger & Piller, 2003, p. 42), thus they are more
likely to be satisfied with idiosyncratic customized products than generic product. The
co-produced product may not have best functional features, but it could be special or
favorable since it expresses the individual’s characteristics.
Research proposed that customers would focus on symbolic cues of products
and match these cues to their self-image, that the matching process could lead to a more
persuasive advertising message via self-congruity route (Johar & Sirgy, 1991).
participation may be more congruent with a customer’s self-image, and can possibly
satisfy the customer more. Self-congruity referred to “the degree of matching
product-related cues to self-image” of co-designers in this study.
According to H1, the mediation effects of self-congruity would vary across the
levels of example provided. Since providing an easy example could facilitate the design
process, participants would more easily customize a product, which might be more
congruent with their self-images. On the other hand, while providing a hard example,
customers would feel difficult to design so that the output could be few congruent with
self-images. Since providing a hard example would be likely to cause confounding or
frustrating feelings, the absence of example in the design process would possibly be
better than presenting a hard example.
Thus, the following hypotheses were developed:
H2a: The mediation effect of self-congruity will be stronger when provided an
easy example than a hard example.
H2b: The mediation effect of self-congruity will be stronger when provided no
Chapter 3 – Research Methodology 3.1 Overview
The objectives of this experiment are divided into two parts. First, the study
tends to investigate the value of customer participation. To satisfy customers, being the
cornerstone of the marketing concept, is mostly the highest-order goal of a firm. We
would like to explore in what conditions customer participation could be an effective
strategy in mass customization. Besides, design-related ability is self-assessed by
participants since customers’ participation would need some product-related
experiences and knowledge which could facilitate the procedure of selecting and
configuring products. If consumers are able to make decisions for preferred options
through the designing process, they would probably perceive more benefit from
co-design program. A covariate is a source of external variation that when removed
from the dependent variable, it could reduce the magnitude of the error term. The
self-assessed ability is prior measured as a covariate to control this possible effect
caused by individual differences. An ANCOVA was conducted to test Hypothesis 1 that
asserted the moderating effect of example provided on the relationship between
customer participation and satisfactions.
Furthermore, the analysis of mediation effect of self-congruity was conducted
examined more in-depth in Chapter 4.
3.2 Stimulus and Manipulation of Customer Participation
The principle considered in selecting the product as the stimulus in our study is
that the product category has to be one which is available and has the need to be
customized. An associated concept is the uniqueness of the customer’s needs which is
about the relevant demand pattern (Christopher, 1995). That means to what extent does
the customer care whether is customized product or not. For a counterexample, tissues
are not suitable for this study since most of consumers are low involved in its
purchasing process.
Some researcher has discussed the applications of mass customization on
apparel industry (Anne Marie, 2005; Anonymous, 1998; Kamali & Loker, 2002; Ulrich
et al., 2003), and we could find that there are many websites offering custom service for
clothing, such like www.customink.com and www.DesignAShirt.com. Therefore, the
author selected customizing T-shirt as a stimulus. We tended to let respondents design
their favored pictures on the T-shirt, and the style of the T-shirt was controlled as the
most common one.
Since the ease of use of software was not concerned in this study, we chosen an
was developed by Ruder Finn Interactive Co., as the tool for the subjects to design
pictures on the T-shirts.
3.3 Pretest on Example Provided
Examples were selected to affect the perceived difficulty of the co-design task,
and we decided to choose two pictures from the gallery of www.mrpicassohead.com,
one is easy and the other is complicated. Two criteria were considered to select the
appropriate example pictures: first, the two pictures must be perceived as same
appealing for participants; second, they must be significantly different on perceived
difficulty. Accordingly, a pilot survey was conducted to determine the stimulus pictures.
At first, we picked six pictures from the gallery, and we conducted a survey on
Internet. After collecting 115 respondents, the author decided the two pictures (see
Appendix 3) by the two principles for the use of example provided. The statistical
results shown that there were no significantly differences on the appealingness (p
= .428) and were significantly different on perceived difficulty (p < 0.05) between the
two chosen pictures.
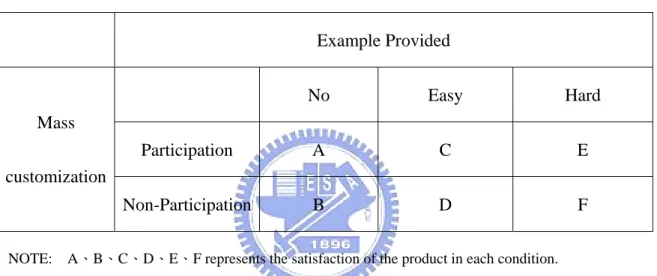
3.4 Experimental Design and Respondents
1), which consisted of two levels of customer participation (participation,
non-participation), and three levels of perceived difficulty which were manipulated by
providing no example, easy example, and hard example. The dependent variables of
interest were self-congruity and satisfaction.
Table 1 Cells of Experimental Design
Example Provided No Easy Hard Participation A C E Mass customization Non-Participation B D F
NOTE: A、B、C、D、E、F represents the satisfaction of the product in each condition.
Respondents were provided incentives and volunteer college and graduate
students and their ages were all between eighteen and twenty-five years old. Though
there were more male (115 of 180) in this study, there were no significant effects of
gender on perceiving appealing ( n.s., p = .855) and difficulty ( n.s., p = .411) of the
example in the pretest. Because respondents were required to come to the laboratory
for this study, all respondents were contacted near or within the campus. Each of 210
successfully completed the experiment.
3.5 Procedure
Only one participant was appointed at one time, and every one of them was
randomly assigned to each cell. In the first part of this study, all participants were
self-reported their ability about design a T-shirt, then they were exposed to the contexts
which asked them to use the mrpicassohead for designing what picture they like.
One-third of them were provided no example, and each half of the rest was provided
with an easy or a hard example respectively. The descriptions for scenarios used in the
study are shown in Appendix 2.
After finished designing their T-shirts, participants were divided into two groups.
Each participant in the target group was measured the self-congruity and product
satisfaction of their own work, whereas each respondent in the control group would be
assigned a picture made by other one participant and answered questions about it. In
order to ensure that each respondent received the same degree of appealingness, we
applied the yoked-control technique. For example, each respondent in the cell of
control group was exposed to the picture designed by each participant in the
corresponded cell of target group, and they were paired together (see Table 1: A→B, C
participation group were assessed the perceived difficulty, confidence and willingness
to design.
It was noted that even those respondents in the non-participation cells have used
the mrpicassohead for a while, that the main reason is for controlling the using
experience.
3.6 Measurements
In this study, questionnaires used for operationally measuring the constructs
were mainly modified from previous research for more suitable in the customization
context, and all construct were measured by multiple items. All items were measured
using a seven-point Likert-type scale (1 = strongly disagree; 7 = strongly agree), except
customer satisfaction.
3.6.1 Measures of Independent Variable and Covariate
Customer participation was a two-level variable which was decided by whether
the respondent have designed the T-shirt and evaluated it or just experienced the design
tool.
The measurement of perceived difficulty of example provided was consisted of
Compeau & Higgins, 1995; Lin, 2006) for perceived ease of use and self-efficacy, and
each statement was answered on a seven-point agree-disagree scale. The result of
assessing perceived difficulty was also taken as a manipulation check for example
provided.
Here is a example question:
01. I think that it is time consuming to design this work.
Strongly Disagree 1 2 3 4 5 6 7 Strongly Agree
Measuring the construct of self-assessed ability based on the measurement of
prior knowledge. Previous research suggested that we could distinguish subjective
knowledge from objective knowledge conceptually (Brucks, 1985; Selnes & Gronhaug,
1986). Studies in consumer behavior have used self-assessed measures for assessing
subjective knowledge (e.g., Johnson & Russo, 1984). The author modified the scale
from Chan-Wook & Byeong-Joon’s (2003) study for the relationship between product
involvement and prior knowledge, which included three items. And for more
completeness in our research, the author added one more question into the scale, so that
the self-assessed ability was measured by a four-item scale, such as:
01. Compared to other people, I think that my ability about painting is excellent.
3.6.2 Measure of Dependent Variables
The self-congruity were assessed with the new method of measuring self-image
congruence designed by Sirgy et al. (1997). Respondents were first exposed to an
instruction:
“Take a moment to think about [product x]. Think about the kind of person
who typically uses [product x]. Imagine this person in your mind and then describe
this person using one or more personal adjectives such as, stylish, classy, masculine,
sexy, old, athletic, or whatever personal adjectives you can use to describe the typical
user of [product x]” (Sirgy et al., 1997, p. 232).
After they have written down those adjectives, respondents would indicate to
what extent they disagree or agree the statements as following for example:
01. Wearing this T-shirt is consistent with how I see myself.
Strongly Disagree 1 2 3 4 5 6 7 Strongly Agree
The other two items were also adapted from Sirgy et al.’s study (1997), which
were listed in the Appendix.
The satisfaction scale was modified from Spreng, MacKenzie, & Olshavsky’s
(1996) study for a reexamination of the consumer satisfaction, which included five
displeased/very pleased,” “very uncomfortable/very comfortable,” “very dislike/very
like,” and “very frustrated/very contented.” The author also consulted the study of
consumer satisfaction by Westbrook & Oliver (1981).
Chapter 4 – Results 4.1 Manipulation Check and Data Analysis
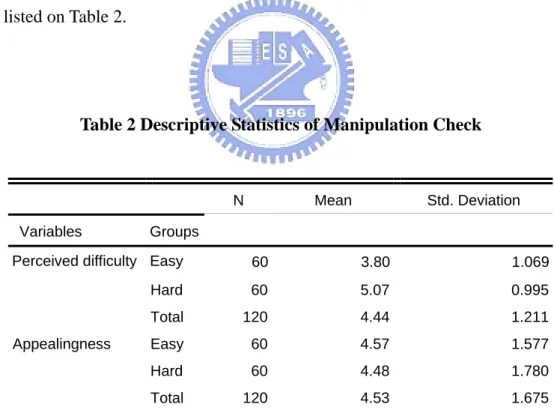
4.1.1 Manipulation Check
It is shown that perceived difficulty of the provided hard example is
significantly higher than which of the provided easy example (t-statistics = 6.761, p <
0.001). Besides, respondents were asked to rate how appealing did they feel about the
two pictures (from 1 point to 7 points), and it was shown no differences on the
appealingness of the two chosen pictures (t-statistics = 0.271, p = 0.506). The means
were listed on Table 2.
Table 2 Descriptive Statistics of Manipulation Check
N Mean Std. Deviation
Variables Groups
Perceived difficulty Easy 60 3.80 1.069
Hard 60 5.07 0.995
Total 120 4.44 1.211
Appealingness Easy 60 4.57 1.577
Hard 60 4.48 1.780
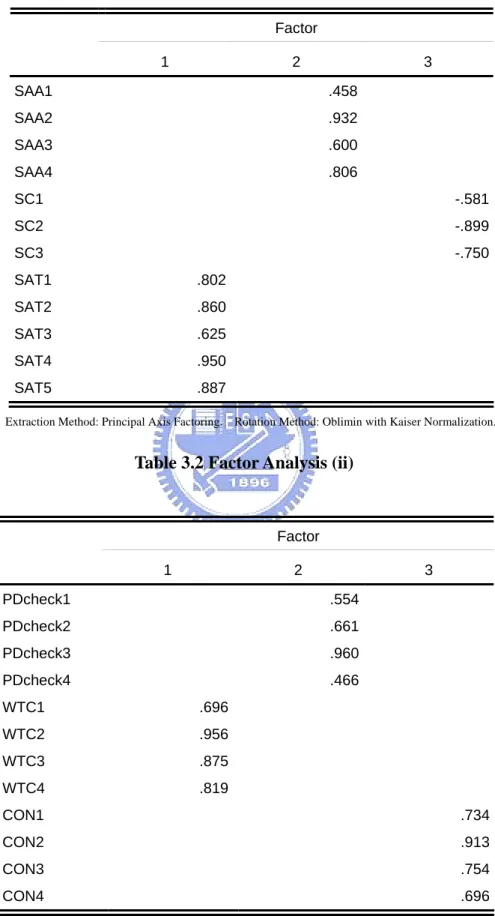
4.1.2 Factor Analysis
As an examination of the factorial validity of those scales, we conducted the
factor analysis, and the result was reported as following Table 3.1 and 3.2. This factor
analysis was divided into two parts: one was for scales presented on all types of
questionnaire and the other one was for those scales specifically assessed in the context
of providing an example. Before the factor analysis, the KMO statistic was reported as
0.871 and 0.791 respectively, and the Bartlett’s test of sphericity was all significant (p <
0.001), that shown the data was adequate for proceeding the factor analysis. We used
the principal axis method for extraction and proceeded the direct oblimin rotation.
With few exceptions, items assigned to each dimension consistently have high
Table 3.1 Factor Analysis (i) Factor 1 2 3 SAA1 .458 SAA2 .932 SAA3 .600 SAA4 .806 SC1 -.581 SC2 -.899 SC3 -.750 SAT1 .802 SAT2 .860 SAT3 .625 SAT4 .950 SAT5 .887
Extraction Method: Principal Axis Factoring. Rotation Method: Oblimin with Kaiser Normalization.
Table 3.2 Factor Analysis (ii)
Factor 1 2 3 PDcheck1 .554 PDcheck2 .661 PDcheck3 .960 PDcheck4 .466 WTC1 .696 WTC2 .956 WTC3 .875 WTC4 .819 CON1 .734 CON2 .913 CON3 .754 CON4 .696
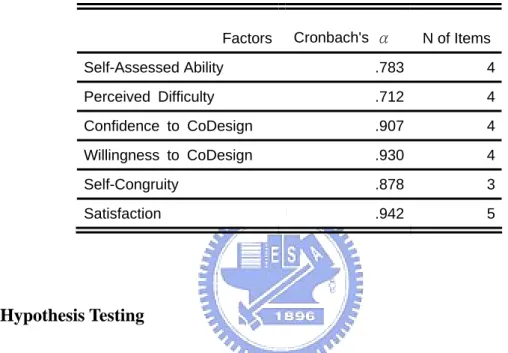
4.1.3 Reliability
The reliabilities are above .7 across all factors, which shows the high internal
consistency of each item of the same factor (see Table 4).
Table 4 Reliability Statistics
Factors Cronbach's α N of Items
Self-Assessed Ability .783 4 Perceived Difficulty .712 4 Confidence to CoDesign .907 4 Willingness to CoDesign .930 4 Self-Congruity .878 3 Satisfaction .942 5 4.2 Hypothesis Testing
4.2.1 Hypothesis 1 and the effect of Customer Participation on Satisfactions. Table 5 Descriptive Statistics of Satisfaction
Dependent variable: satisfactions
Example provided
None Easy Hard
Mean Std. Deviation N Mean Std. Deviation N Mean Std. Deviation N Participation 4.53 1.25 30 4.89 0.82 30 4.54 1.14 30
Non-Participation 3.69 1.32 30 3.13 1.15 30 3.92 1.25 30
Table 6 exhibited that mean values of satisfaction in target group with
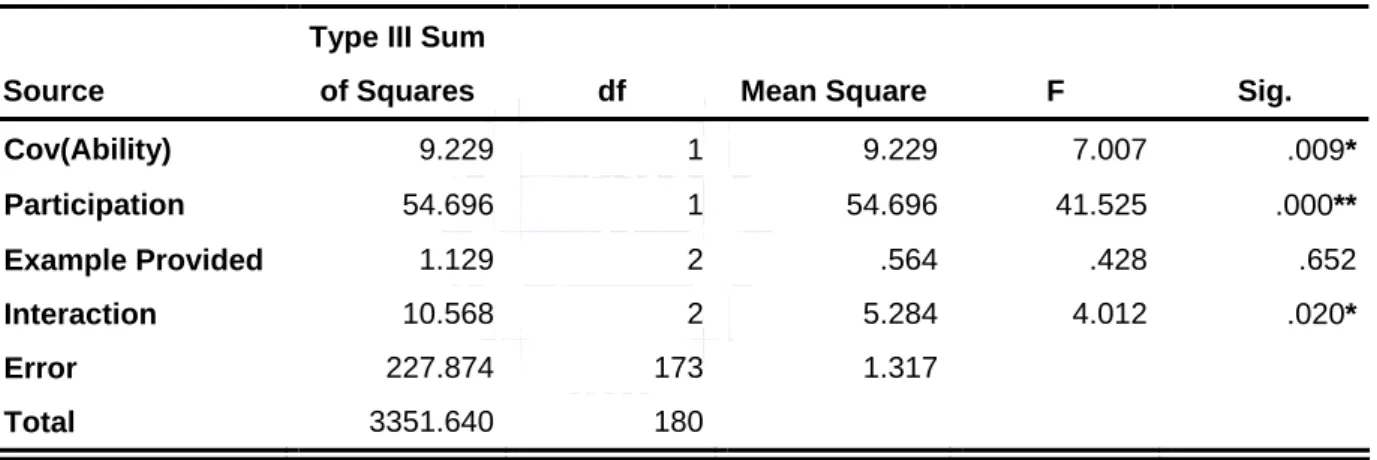
The author conducted an ANCOVA (Table 6) for testing Hypothesis 1, which the
self-assessed ability was taken as a covariate. As the main effect of customer
participation on satisfactions was examined (F-statistics = 41.525, p <0.001),
Hypothesis 1 could be supported that the interaction effect between customer
participation and example provided was statistically significant (F-statistics = 4.012, p
< 0.05).
Table 6 Summary of ANCOVA
Dependent Variable: Satisfaction
Source
Type III Sum
of Squares df Mean Square F Sig. Cov(Ability) 9.229 1 9.229 7.007 .009* Participation 54.696 1 54.696 41.525 .000** Example Provided 1.129 2 .564 .428 .652 Interaction 10.568 2 5.284 4.012 .020* Error 227.874 173 1.317 Total 3351.640 180 *. P <0.05 **. P <0.001
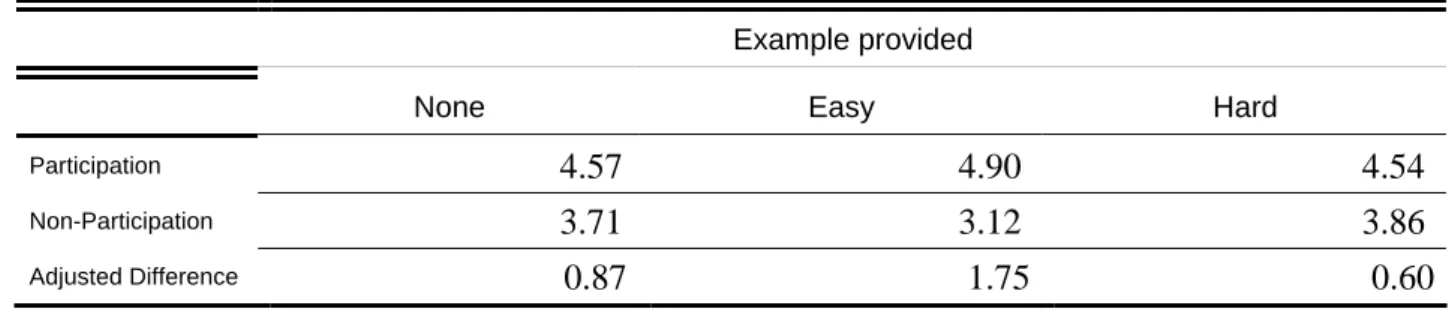
For further confirmed Hypothesis 1, we examined the mean differences between
target group and control group among the three levels of example provided. Results
showed that the mean differences of satisfaction between target and control groups
were stronger when an easy example was provided (F-statistics = 4.133, p < 0.05) in the
(LSD post-hoc test, p = .007<0.05). This result could be presented more clearly in
Figure 3 and Figure 4.
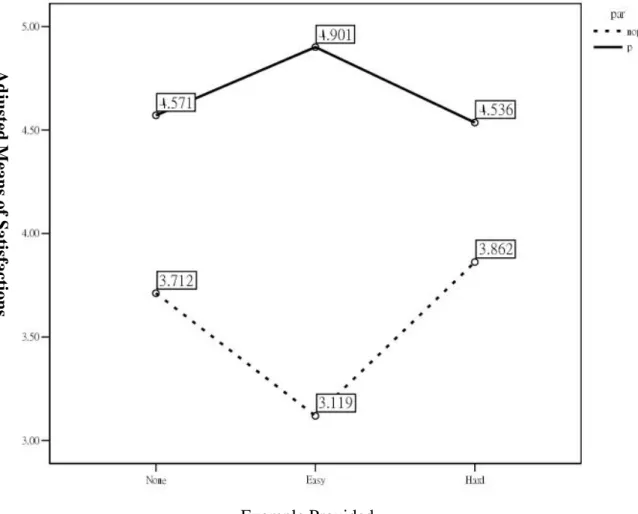
Table 7 Adjusted Means of Satisfactions
Example provided
None Easy Hard
Participation 4.57 4.90 4.54 Non-Participation 3.71 3.12 3.86 Adjusted Difference 0.87 1.75 0.60
It could also be discovered that the interaction effect was ordinal (see Figure 4),
since the main effect of customer participation was statistically significant (F-statistics
= 41.525, p < 0.001) on satisfaction. The results indicated that encouraging customer
co-design would successful raise the satisfaction of a customized product in our case.
Figure 4 Interaction of Participation and Example Provided
Adjusted Means of Satisfactions
4.2.2 The Mediation Analysis
It could be discovered that the mean value of self-congruity in each cell of
participation was higher than that in each corresponding cell of non-participation (Table
8), whether the easy or hard or no example provided. Then, the author proceeded the
analysis by following the steps suggested by Baron & Kenny’s (1986) research. In each
varied condition of example provided, the following analysis was conducted to
constitute that:
1. The independent variable (customer participation) has a significant
influence on the proposed mediator (self-congruity) by regressing the
mediator on the independent variable.
2. The independent variable is shown to significantly affect the dependent
variable (satisfactions) by regressing the dependent variable on the
independent variable.
3. When both the independent variable and the mediator are in the regression
model, the mediator must significantly affect the dependent variable, and the
effect of the independent variable on the dependent variable must be less
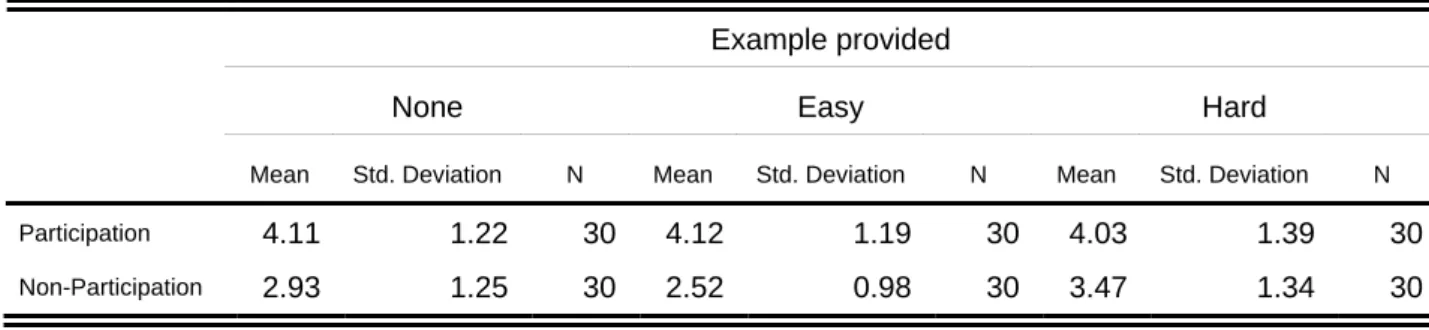
Table 8 Descriptive Statistics of Self-Congruity
Example provided
None Easy Hard
Mean Std. Deviation N Mean Std. Deviation N Mean Std. Deviation N Participation 4.11 1.22 30 4.12 1.19 30 4.03 1.39 30
Non-Participation 2.93 1.25 30 2.52 0.98 30 3.47 1.34 30
First of all, we directed the regression method to examine the first condition
listed above. Table 9 exhibited that customer participation has a positive effect on
self-congruity, except when a hard example is provided in the design process.
Table 9 The effect of customer participation on self-congruity when provided different example
Dependent variable: self-congruity
Example Provided Standardized β t p-value
No Example .435 3.681 .001*
Easy Example .599 5.694 .000**
Hard Example .207 1,608 .113
*. P < 0.05 **. P < 0.001
Second, Table 10 presented that customer participation significantly affect
satisfactions.
Table 10 The effect of customer participation on satisfactions when provided different example
Dependent variable: satisfactions
Example Provided Standardized β t p-value
No Example .317 2.550 .013*
Easy Example .665 6.777 .000**
Hard Example .255 2.008 .049*
*. P < 0.05 **. P < 0.001
Afterwards, we conducted the path analysis to examine both direct and indirect
effects in the regression model that consisted of customer participation, self-congruity,
and satisfaction when different example was provided in the customizing process. The
parameters on those diagrams are the standardized regression weights, which referred
Figure 5.1 The Path Diagram (when no example was provided)
Figure 5.1 shows that the perfect mediation exists since customer participation
has no significant effect on satisfactions when the mediator (self-congruity) is
controlled. According to David A. Kenny’s (2006) article, the amount of mediation
effect could be estimated by the indirect effect. Subsequently, a Sobel test is conducted
and its results indicates that the indirect effect of customer participation on satisfactions
via self-congruity is significantly different from zero (Test statistics = 3.29, p < 0.001),
and the amount of standardized indirect effect is calculated as 0.311. .435*
.714*
Figure 5.2 The Path Diagram (when an easy example was provided)
Figure 5.2 shows that self-congruity is partially mediating the relationship
between customer participation and satisfactions, since the main effect of customer
participation remains significant (t-statistics = 3.357, p < 0.05) after adding the
mediator into the regression model. The standardized indirect effect is .343, which is
significantly larger than zero (Sobel test-statistics = 4.132, p < 0.001). .599*
.573*
Figure 5.3 The Path Diagram (when an hard example was provided)
*. P < 0.05
Since the direct effect of customer participation on self-congruity is not
significant (t-statistics = 1.622, p = 0.105), the mediation effect of self-congruity does
not hold when a hard example is provided in the design process. Thus, Hypothesis 2a
and 2b are supported that the mediation effect of self-congruity will be stronger
whether an easy or no example was provided than a hard example was provided. .207
.689*
Chapter 5 – Discussion and Conclusion 5.1 The Summary of Results and Conclusions
The results indicated that the positive relationship between customer
participation and satisfaction is magnified when we provided an easy example picture,
which the moderating role was examined by the significance of interaction effect. In
order to further support our hypothesis, we confirmed our propositions by additionally
measuring the perceived difficulty, confidence to design and willingness to design. The
Results show that perceived difficulty was negatively correlated to the confidence of
customers (γ= -.267, p < 0.05), whereas the confidence of customers was positively
correlated to the willingness to design (γ= .648, p < 0.001). As we imagined, the more
difficulty the participant perceived the example, the less confidence they had, and thus
would have influence on their willingness to join the co-design process next time. It is
conceivably to assert that making customers feel easier and simpler when they are
participating in customizing process could both raise their satisfactions of the output
and willingness to participate again.
In our study, encouraging customer co-design would successful raise the
satisfaction of a customized product, since the main effect of customer participation is
demonstrated significant whether with an easy or hard or no example provided.
author suggests the cognitive dissonance could be one possible reason. Since the design
process might be viewed as an extra effort which increased the negative feelings when
customers engaged in customization, they want to obtain the customized product but do
not want to pay extra works. Dissonance could be elicited as the participant making
some unwilling efforts to acquire the customized product. Aronson & Mills (1959)
maintained that people would value their additional effort and evaluate higher about the
product that produced from more effort than the product produced by less effort.
Customers may conceivably raise their evaluations of the outcome co-produced through
mass customization, as individuals may have the need to feel satisfied and enhance the
evaluations of their choices that reflect on the wisdom of their own behavior or
judgment (Hall & Dornan, 1988).
Other possible explanation is that when a consumer participates in co-designing,
they might be developing a feeling of ownership and do not want to interrupt the
customizing process. It could be likely to assert that the consumer is so involved in
customizing the product, they might express higher desire to own it.
It is suggested in our mediation analysis that asking the customer to participate
in designing their own product could increase the perceived congruence with the
self-image, thus the purchaser would be more satisfied because of the mediation effect
self-image of forming satisfactions (see Jamal, 2004; Wood, 1972). As being a perfect
mediator when no example provided for the customized offer, the self-congruity can
account for the most variation of satisfactions in mass customization. Moreover, we
could discover that only when an easy example was provided, the customers’
participation would directly affect the satisfaction, thus Hypothesis 1 was enhanced.
5.2 Implications
Much of the existing research have discussed the issue of mass customization
(Kubiak, 1993; MacCarthy & Brabazon, 2003; Tseng & Jiao, 1997), and most of them
have focused on how to implement it as an efficient strategy to companies. We have
demonstrated that offering the opportunity for the consumer to participate in
co-designing their product would possibly induce higher product satisfactions.
For offering more investigation on the point of view of consumer, we have
concentrated more on the decision aids for the consumer who might be stuck when
participating in a customizing process. Online decision aids were widely discussed in
some studies about online shopping behaviour (Karaatli, 2002; Pratibha, 2006), the
author suggested that providing some helping for customers who are involving with
customizing process can be a useful strategy as well. Companies which have already
the customer participating, since the participant could take the example as a reference
or they would be inspired for more creative ideas. Then, the customer could enjoy more
in the designing task, thus create the nice experiences with this product and impressive
image of the firm.
It is also noted that companies would be better to make their customers feel the
participation as an easy and interesting task, so that providing gorgeous but very
complicated example may not work on increasing benefits. Customers will agree that it
looks marvellous but they will feel that it is difficult for them to do as better as what
you provided. Hence, for more extended, the author proposes that the simple (but not
poor-class) messages will more useful for companies which have implemented the mass
customization than the costly complicated ones. To deliver an image that “customizing
is easy and achievable” may need to be considered when firms with customized service
are developing their advertising projects.
Mass customization is applied to many different product category, such like
Sears offering online tool kits for customers designing kitchens and rooms, 121Time
producing Swiss-made watches with almost infinite customization options (see Frank &
Ashok, 2006), and even web-based customized architecture (Stouffs, Tunçer, &
Sariyildiz, 2002). Since we have demonstrated that the self-image congruence has taken
value would be considered as a suitable product for requiring customer participation,
such as cars, watches, or clothes. Another implication of the self-congruity is that
companies could give their customers more autonomy when providing customized
services. The image itself that companies want to present is not important. The much
more valuable issue is that how congruent does the image is with the self-image of the
customer. Instead of designing alternatives or more options for the consumer, why not
consider to let the consumer design their own individual one that may possess higher
symbolic value for themselves, and thus the customer will be more satisfied.
5.3 Limitations and Future Research
A possible limitation of this study is the type of respondents used, which
students accounted for almost all respondents. This result might not be exactly fit the
whole society. Another possible limitation is that the respondents may not involve in
the experiment enough. Since they were not under the real situations of purchasing, or
they were going to do something later, the respondents might not focus on the
designing task. Besides, the experimental involvement of respondents is important for
measuring the reliable data, especially for the studies about customization. One paradox
for conducting an experiment about customization is that researcher may want to design
will make respondents involve more, but it costs more time.
A counter-argument is proposed that encouraging customer to expand efforts in
participation may not always be an attractive strategy because of the self-serving bias
(Bendapudi & Leone, 2003). The self-serving bias refers to a person’s tendency to
claim more credits than a partner for success and less blame for failure in a situation in
which an outcome is jointly produced (Wolosin, Sherman, & Till, 1973). Leone et al.
(2003) have also proposed that increasing a customer’s autonomy may reduce the
self-serving bias. The effect of customer participation on product evaluation may need
more and further research.
Another suggestion is that the attitudes toward the customer participation in
co-design shall be measured and studied in future research. Purchase intention can be
possibly taken into the model as a dependent variable, since there were already some
studies discussing about the effects of store information or attitudes toward the brand
on purchase intention (Dodds, Monroe, & Grewal, 1991; Spears & Singh, 2004)
It is recommended to add “price” as an independent variable in the future
research, since the product with higher price has a higher symbolic value in the daily
life. The author also proposes that there might be different effect of different product
type on the relationship between customer participation and satisfactions. For instance,
with customizing a conspicuous good?
Except asking the customer to design images on the T-shirt, there are some other
levels of participation, such as requiring customers designing the whole T-shirt
including choosing the fabrics. If the designing process is more complicated, is the easy
example still effective on reducing the perceived difficulty?
Another related topic is the relationship between customer participation and
perceived product quality. Carroll and Thomas (1988) suggested that we could clarify
the concepts of easy to use and fun to use when talking about software quality, which
referred the ergonomic quality and hedonic quality respectively. It would be interesting
to know that the participation from customers will increase more perceived functional
quality or hedonic quality, therefore the effects of customer participation on
References
Adomavicius, G., & Tuzhilin, A. (2005). Personalization Technologies: A
Process-Oriented Perspective. Communications of the ACM, 48(10), 83-90.
Altan, C. (2003). Personalization and Customization in Financial Portals. Journal of American Academy of Business, Cambridge, 2(2), 498.
Anckar, B., & Walden, P. (2000). Destination Maui? An Exploratory Assessment of the Efficacy of Self-Booking in Travel. Electronic Markets, 10(2), 10.
Ann Marie, F., Seung-Eun, L., & Grace, K. (2004). Individual Differences, Motivations, and Willingness to Use a Mass Customization Option for Fashion Products. European Journal of Marketing, 38(7), 835.
Anne Marie, L. (2005). The Style Incentive. Potentials, 38(9), 32.
Anonymous. (1998). Doing It Their Way. Apparel Industry Magazine, 59(5), 42.
Aronson, E., & Mills, J. (1959). The Effect of Severity of Initiation on Liking for a Group. Journal of Abnormal Psychology, 59(2), 177-181.
Babyak, R. (2006). Personalization Paradox. Appliance Design, pp. 5-5.
Baron, R. M., & Kenny, D. A. (1986). The Moderator-Mediator Variable Distinction in Social Psychological Research: Conceptual, Strategic, and Statistical
Considerations. Journal of Personality and Social Psychology, 51(6).
Bateson, J. E. G. (1985). Self-Service Consumer: An Exploratory Study. Journal of Retailing, 61(3), 49.
Bendapudi, N., & Leone, R. P. (2003). Psychological Implications of Customer Participation in Co-Production. Journal of Marketing, 67(1), 14-28.
Berger, C., & Piller, F. T. (2003). Customers as Co-Designers. Manufacturing Engineer, 82(4), 42-45.
Behavior. Journal of Consumer Research, 12(1), 1.
Carroll, J. M., & Thomas, J. M. (1988). Fun. SIGCHI Bulletin, 19(3), 21-24.
Christopher, W. L. H. (1995). Mass Customization: Conceptual Underpinnings, Opportunities and Limits. International Journal of Service Industry Management, 6(2), 36.
Compeau, D. R., & Higgins, C. A. (1995). Computer Self-Efficacy: Development of a Measure and Initial Test. MIS Quarterly, 19(2), 189.
Cox, W. M., & Alm, R. (1998). The Right Stuff : America's Move to Mass
Customization (No. 1998 annual report): FEDERAL RESERVE BANK OF DALLAS.
Da Silveira, G., Borenstein, D., & Fogliatto, F. S. (2001). Mass Customization:
Literature Review and Research Directions. International Journal of Production Economics, 72(1), 1-13.
Dabholkar, P. A. (1990). How to Improve Perceived Service Quality by Improving Customer Participation. Developments in Marketing Science, 13, 483-487.
Dodds, W. B., Monroe, K. B., & Grewal, D. (1991). Effects of Price, Brand, and Store Information on Buyers' Product Evaluations. Journal of Marketing Research (JMR), 28(3), 307.
Firat, A. F., Dholakia, N., & Venkatesh, A. (1995). Marketing in a Postmodern World. European Journal of Marketing, 29(1), 40.
Fitzsimmons, J. A. (1985). Consumer Participation and Productivity in Service Operations. Interfaces, 15(3), 60-67.
Frank, P., & Ashok, K. (2006). For Each, Their Own. Industrial Engineer, 38(9), 40.
Godek, J., Yates, J. F., & Yoon, Y. (2002). "Customization and Personalization: The Influence of Perceived Control and Perceived Capability on Product
Grubb, E. L., & Grathwohl, H. L. (1967). Consumer Self-Concept, Symbolism and Marketing Behavior: A Theoretical Approach. Journal of Marketing, 31(4).
Hall, J. A., & Dornan, M. C. (1988). Meta-Analysis of Satisfaction with Medical Care: Description of Research Domain and Analysis of Overall Satisfaction Levels. Social Science & Medicine, 27(6), 637-644.
Huffman, C., & Kahn, B. E. (1998). Variety for Sale: Mass Customization or Mass Confusion? Journal of Retailing, 74(4), 491-513.
Jamal, A. (2004). Retail Banking and Customer Behaviour: A Study of Self Concept, Satisfaction and Technology Usage. International Review of Retail, Distribution & Consumer Research, 14(3), 357-379.
Johar, J. S., & Sirgy, M. J. (1991). Value-Expressive Versus Utilitarian Advertising Appeals: When and Why to Use Which Appeal. Journal of Advertising, 20(3), 23.
Johnson, E. J., & Russo, J. E. (1984). Product Familiarity and Learning New Information. Journal of Consumer Research, 11(1), 542.
Kamali, N., & Loker, S. (2002). Mass Customization: On-Line Consumer Involvement in Product Design. Journal of Computer-Mediated Communication, 7(4).
Kara, A., & Kaynak, E. (1997). Markets of a Single Customer: Exploiting Conceptual Developments in Market Segmentation. European Journal of Marketing, 31(11/12), 737-895.
Karaatli, G. M. (2002). The Effects of Online Decision Aids, Product Knowledge, Extrinsic and Intrinsic Cues, and Purchase Involvement on Consumer Internet Shopping Behavior. Unpublished Ph.D., Rensselaer Polytechnic Institute, United States -- New York.
Kenny, D. A. (2006). Mediation [Electronic Version]. Retrieved March 26 from http://davidakenny.net/cm/mediate.htm.
Kramer, T. (2003). The Effect of Preference Measurement on Preference Construction and Responses to Customized Offers. Unpublished Ph.D., Stanford University, United States -- California.
Kubiak, J. (1993). A Joint Venture in Mass Customization. Planning Review, 21.
Lin, H.-F. (2006). Understanding Behavioral Intention to Participate in Virtual Communities. CYBERPSYCHOLOGY & BEHAVIOR, 9.
Lovelock, C. H., & Young, R. F. (1979). Look to Consumers to Increase Productivity. Harvard Business Review, 57(3), 168-178.
MacCarthy, B., & Brabazon, P. (2003). In the Business of Mass Customisation. Manufacturing Engineer, 82(4), 30-33.
Moffat, S. (1990). Japan's New Personalized Production. Fortune, 122(10), 132-135.
Park, C.-W., & Moon, B.-J. (2003). The Relationship between Product Involvement and Product Knowledge: Moderating Roles of Product Type and Product
Knowledge Type. Psychology & Marketing, 20(11), 977.
Pine Ii, B. J., Peppers, D., & Rogers, M. (1995). Do You Want to Keep Your Customers Forever? Harvard Business Review, 73(2), 103-114.
Pratibha, A. D. (2006). Factors Influencing Consumer Choice of A "Rating Web Site": An Experimental Investigation of an Online Interactive Decision Aid. Journal of Marketing Theory and Practice, 14(4), 259.
Richins, M. L. (1994). Special Possessions and the Expression of Material Values. Journal of Consumer Research, 21(3), 522.
Schwartz, B. (2004). The Tyranny of Choice. Scientific American, 290(4), 70-75.
Selnes, F., & Gronhaug, K. (1986). Subjective and Objective Measures of Product Knowledge Contrasted. Advances in Consumer Research, 13(1), 67-71.
Sirgy, M. J. (1985). Using Self-Congruity and Ideal Congruity to Predict Purchase Motivation. Journal of Business Research, 13(3), 195-206.
Sirgy, M. J., Dhruv, G., Tamara, F. M., Jae-ok, P., & et al. (1997). Assessing the Predictive Validity of Two Methods of Measuring Self-Image Congruence.
Academy of Marketing Science. Journal, 25(3), 229.
Spears, N., & Singh, S. N. (2004). Measuring Attitude toward the Brand and Purchase Intentions. Journal of Current Issues & Research in Advertising, 26(2), 53-66.
Spreng, R. A., MacKenzie, S. B., & Olshavsky, R. W. (1996). A Reexamination of the Determinants of Consumer Satisfaction. Journal of Marketing, 60(3), 15.
Stouffs, R., Tunçer, B., & Sariyildiz, S. (2002). Examples of Web-Based Custom Design in Dutch Residential Developments. Paper presented at the International Council for Research and Innovation in Building and Construction, Aarhus School of Architecture.
Tan, T. W., & Chua, H. M. (2003). Leveraging on Symbolic Values and Meanings in Branding. Journal of Brand Management, 10(3), 208.
Tseng, M. M., & Jiao, J. (1997). Case-Based Evolutionary Design for Mass Customization. Computers industry Engneering, 33, 319.
Ulrich, P. V., Anderson-Connell, L. J., & Wu, W. (2003). Consumer Co-Design of Apparel for Mass Customization. Journal of Fashion Marketing and Management, 7(4).
Vesanen, J., & Raulas, M. (2006). Building Bridges for Personalization: A Process Model for Marketing. Journal of Interactive Marketing, 20(1), 5-20.
Westbrook, R. A., & Oliver, R. L. (1981). Developing Better Measures of Consumer Satisfaction: Some Preliminary Results. Advances in Consumer Research, 8(1), 94-99.
Wolosin, R. J., Sherman, S. J., & Till, A. (1973). Effects of Cooperation and
Competition on Responsibility Attribution after Success and Failure. Journal of Experimental Social Psychology, 9(3), 220-235.
Wood, D. A. (1972). The Effects of Work Involvement When Relating Job Attitudes and Behavior. Academy of Management Proceedings, 189-191.
詹偉雄. (2005). 美學的經濟: 家庭傳媒城邦分公司.
翁鵲嵐, 鄭玉屏 & 張志傑. 情感設計. 譯自 Norman, D. A. (2005). Emotional Design: Why We Love (or Hate) Everyday Things.
Appendix 1. Measures of Dependent Variables (English Questionnaire)
First of all, we’d like to thank you for joining this experiment, and this is a questionnaire for studying the consumer behavior. Your responses will be used for academic research only. We will not disclose your personal information, please take your time to answer the following questions completely. Thank you for your patience and valuable participation!
Best regards,
National Chiao Tuang University Management Science Department Student: I-Chiang Huang
Advisor: Chia-Chi Chang 2007/05
Variable Items
Self-Assessed Ability
1. Compared to other people, I think that my ability about painting isexcellent.
2. I know how to choose and purchase nice clothes for myself. 3. I think I can design a picture for T-shirts on my own, which
satisfies me.
4. As to picking out nice clothes, I am an experienced buyer.
Perceived Difficulty
1. I think that it is time consuming to design this picture.2. I don’t have confident to design this picture.
3. For me, it is very hard to design this picture on this tool.
4. After saw this pictures, I think that it is hard to design my favorite pictures on this tool.
Willingness to Co-Design
1. I would be willing to pay more than usual for a co-designed cloth.2. I like to participate in designing my own cloth. 3. I view a co-design process as an exciting experience.
4. I would be very interested in using co-design to create my own unique clothing design.
Confidence to Co-Design
1. I am confident to design my favorite picture on the T-shirt.2. I feel confident to learn how to design a satisfied picture.
3. I am sure that the work co-designed by myself would satisfy me. 4. I am able to design my favorite picture on the T-shirt.
Self-Congruity
1. Wearing this T-shirt in consistent with how I see myself.2. This T-shirt reflects who I am.
3. The kind of person who typically wears this T-shirt is very much like me.