架構在SCORM相容環境下的使用者學習歷程分析與探勘
69
0
0
全文
(2) 架構在 SCORM 相容環境下的使用者學習歷程分析與探勘 Learning Portfolio Analysis and Mining in SCORM Compliant Environment. 研 究 生:王 威. Student:Wei. Wang. 指導教授:曾憲雄. Advisor:Shian-Shyong Tseng. 國 立 交 通 大 學 資 訊 科 學 系 碩 士 論 文 A Thesis Submitted to Institute of Computer and Information Science College of Electrical Engineering and Computer Science National Chiao Tung University in partial Fulfillment of the Requirements for the Degree of Master in Computer and Information Science June 2004 Hsinchu, Taiwan, Republic of China. 中華民國九十三年六月.
(3) 架構在 SCORM 相容環境下的使用者 學習歷程分析與探勘 研究生:王. 威. 國. 立. 指導教授:曾憲雄博士. 交. 通. 大 資. 學 訊. 電 科. 機 學. 資 系. 訊. 學. 院. 摘要 隨著資訊科技的日新月異與網路技術的蓬勃發展,傳統的教學模式已漸漸發 展成為不受時間與空間限制的網路學習(e-Learning)。SCORM 2004 提供了 Sequencing and Navigation(SN)定義課程的次序行為,並使用活動樹用以描述階層 性的課程結構,其根據不同的學習情況,而提供不同的學習者有不同的學習導引 順序。所以,1.如何根據學習者個人特質的差異及能力的不同提供其客製化的學 習活動,2.如何替不同的學習者新增、表示、管理個人化的學習樹成為兩個重要 的議題。然而,由老師手動替每一位學習者打造個人化的學習樹是一項不可能的 任務。學習者的學習歷程資訊有助於教師了解學習者其之所以得高分或是低分的 原因。因此,提出了包含有四階段的學習歷程分析方法: 1.使用者模組定義階段: 我們根據教育理論的需求定義了使用者的個人檔; 2.使用者學習行為萃取階段: 使用循序樣式探勘(Sequential pattern mining)技術萃取學習者最常學習行為,並將 之轉換成位元向量,隨之使用分群法(Clustering)將成效好的學習者分成適當數目 的群體; 3.決策樹(Decision Tree)建構階段:使用 2/3 的學習者為訓練資料,及剩 下的 1/3 學習者為測試資料,利用其個人檔案及前一階段的分群標籤建立決策樹; 4.活動樹(Activity Tree)建構階段:將產生的每一個群組使用萃取的學習行為以建 構與 SCORM 相容的個人化活動樹。最後,為了評估以上四階段歷程分析的方 法,研究者亦做了一個實驗以驗證其可行性。. 關鍵詞:學習者歷程分析、SCORM、資料探勘、個人化學習、e-Learning I.
(4) Learning Portfolio Analysis and Mining in SCORM Compliant Environment Student : Wei Wang Advisor : Dr. Shian-Shyong Tseng Institute of Computer and Information Science National Chiao Tung University. Abstract With vigorous development of the Internet, e-learning system has become more and more popular. Sharable Content Object Reference Model (SCORM)2004 provides the Sequencing and Navigation (SN) to define the course sequencing behavior, control the sequencing, select and deliver of course, and organize the content into a hierarchical structure, namely Activity Tree (AT). Therefore, how to provide customized courses according to individual learning characteristics and capabilities, and how to create, represent and maintain the activity tree with appropriate associated sequencing definition for different learners become two important issues. However, it is almost impossible to design personalized learning activity trees for each learner manually. The information of learning behavior, called learning portfolio, can help teachers understand the reason why a learner gets high or low grade. A Learning Portfolio Mining (LPM) Approach is proposed includes of four phases: 1. User Model Definition Phase: define the learner profile based upon pedagogical theory. 2. Learning Pattern Extraction Phase: apply sequential pattern mining technique to extract the maximal frequent learning patterns from the learning sequence, transform original learning sequence into a bit vector, and then use distance based clustering approach to group learners with good learning performance into several clusters. 3. Decision Tree Construction Phase: use two third of the learner profiles with corresponding cluster labels as training data to create a decision tree, and the remaining are the testing data. 4. Activity Tree Generation Phase: use each created cluster including several learning patterns as sequencing rules to generate personalized activity tree with associated sequencing rules of SN. Finally, for evaluating our proposed approach of learning portfolio analysis, several experiments have been done and the research shows that generated personalized activity trees with sequencing rules are feasible for those learners. II.
(5) Keywords: Learning Portfolio Analysis, SCORM, Data Mining, Personalized Learning, Adaptive Learning, Intelligent Tutoring System.. III.
(6) 誌謝 這篇論文的完成,必須感謝許多協助與支持我的人。首先必須感謝我的指導 教授,曾憲雄博士,由於老師耐心的指導與勉勵,讓我得以順利完成此篇論文, 此外在學問與待人處世方面,也有很大的啟發。同時必須感謝我的論文口試委 員,游寶達教授、楊錦潭教授,以及孫春在教授,他們也對這篇論文提出了許多 寶貴的意見,讓此篇論文更顯得有價值與意義。. 此外必須感謝實驗室中各位學長、同學平日的諸多協助,特別是蘇俊銘學 長、翁瑞鋒學長、林順傑學長以及王慶堯學長,他們對於此篇論文的架構與理論, 有許多珍貴的意見,而在課業與待人處世上,更讓我受益匪淺,在此深表感激。 而實驗室中的同窗夥伴,楊哲青、蕭斯聰、蘇培綺、陳家瑜、曾于彰、鄭佩琪、 劉力豪、以及溫建豪同學等人互相幫助的情誼,更讓忙碌的碩士班兩年生涯,能 夠愉快而充實的度過。. 再者,感謝張媽媽、及張爸爸對我有如自己兒子般的照顧,在大學四年及碩 士兩年的生活中,給我的勉勵與幫助,讓我有自信面對任何的挑戰與壓力。也感 謝我的女友毓珍,在我的求學階段對我的體諒及照顧,讓我無後顧之憂的完成學 業,這份成果是我們共享的。感謝女友的父母及家人,對我無微不至的照顧,讓 我有機會更加深刻的體會家庭的溫暖與可貴,更期望有機會成為你們的一份子。 最後,感謝父母一路上的栽培教導,感謝辭世的祖父的培育。 在生命中,總是有太多的人對我默默的付出,然而我所能回饋的實在是微不 足道,僅將此篇論文,獻給上述的所有人。. 王 威 2004 年 6 月於新竹交大 IV.
(7) Table of Contents 摘要............................................................................................................. I Abstract ......................................................................................................II 誌謝.......................................................................................................... IV Table of Contents ...................................................................................... V List of Figures .......................................................................................... VI List of Tables...........................................................................................VII Chapter 1: Introduction .............................................................................. 1 Chapter 2: Related Work............................................................................ 3 2.1 SCORM (Sharable Content Object Reference Model) [2] ..............................3 2.2 Other Related Research....................................................................................5. Chapter 3: Learning Portfolio Analysis Using Data Mining Approach .... 7 3.1 The Process of Learning Portfolio ...................................................................8 3.2 The Framework of Learning Portfolio Mining (LPM) ....................................9. Chapter 4: The Clustering Process of Learner......................................... 11 4.1 User Model Definition Phase......................................................................... 11 4.2 Learning Pattern Extraction Phase.................................................................14 4.2.1 Sequential Pattern Mining Process .....................................................15 4.2.2 Feature Transforming Process.............................................................18 4.2.3 Learner Clustering Process .................................................................19. Chapter 5: The Prediction and Construction of Learning Guidance ....... 20 5.1 Decision Tree Construction Phase .................................................................20 5.2 Activity Tree Generation Phase .....................................................................22. Chapter 6: System Implementation ......................................................... 25 6.1 The interface of LMS.....................................................................................25 6.2 The Implementation of LPM System.............................................................27. Chapter 7: Experiment Design and Result Analysis................................ 36 7.1 Experiment Design.........................................................................................36 7.2 Experiment Design Issues..............................................................................39 7.3 Result Analysis...............................................................................................42. Chapter 8: Conclusions and Future Work................................................ 48 Bibliography: ........................................................................................... 50 Appendix A: Learning Style Indicator..................................................... 56 Appendix B: Pretest attitude toward computers ...................................... 58 Appendix C: the Social status Indicator .................................................. 59 Appendix D: the Satisfaction Measure Indicator .................................... 60 V.
(8) List of Figures Figure 2.1: An Example of Activity Tree.......................................................................4 Figure 3.1: The Flowchart of LPM................................................................................9 Figure 4.1: Learning Pattern Extraction Phase ............................................................14 Figure 4.2: Maximal Frequent Sequential Pattern Mining Algorithm.........................15 Figure 4.3: Mining Process of Modified GSP Algorithm withα= 6 ............................16 Figure 5.1: The Decision Tree Based upon the Learner Profiles in Table 5.1.............21 Figure 5.2: The Algorithm of Personalized Activity Tree Creation (PATC) ...............22 Figure 5.3: The Result of PATC Algorithm based upon Cluster 2...............................24 Figure 6.1: The interface of LMS ................................................................................26 Figure 6.2: The web log of a student ...........................................................................27 Figure 6.3: The interface of LPM ................................................................................27 Figure 6.4: The output of preprocess phase.................................................................28 Figure 6.5: The result of applying GSP algorithm.......................................................29 Figure 6.6: The result of Feature Transform of each learner.......................................30 Figure 6.7: The result of Clustering.............................................................................31 Figure 6.8: The result of Decision Tree Construction .................................................31 Figure 6.9: SCORM 2004 Content package Concept diagram....................................32 Figure 6.10: SCO’s information in SCORM’s ItemInfo Table....................................34 Figure 6.11: Personalized Activity Tree imported in SCORM RTE............................35 Figure7.1: Test Processes of Experiment of Non-navigation Group ...........................36 Figure 7.2: Test Processes of Navigation Group .........................................................37 Figure 7.3: The Concept Diagram of three level representaition ................................41 Figure 7.4: The Improvement of Non-navagation Group and Navagation Group ......44 VI.
(9) List of Tables Table 4.1: The Learning Characteristics of Learner ....................................................13 Table 4.2: The Learning Sequences of 10 Learners.....................................................13 Table 4.3: The Set of Maximal Frequent Learning Patterns (MF) ..............................17 Table 4.4: The Result of Feature Transforming Process..............................................18 Table 4.5: The Result of Applying ISODATA Clustering Algorithm ..........................19 Table 5.1: The Learner Profiles with Cluster Labels ...................................................21 Table 7.1: Concepts List in Physics Course.................................................................40 Table 7.2: The statistics of the participators ................................................................42 Table 7.3: Mining results with different minimal support ...........................................43 Table 7.4: Results with pretest and posttest.................................................................44 Table 7.5: Results with satisfaction measure ...............................................................45. VII.
(10) Chapter 1: Introduction. With vigorous development of the Internet, e-learning system has become more and more popular. Sharable Content Object Reference Model (SCORM) 2004 [2], the most popular standard for the consistency of course format among different e-learning systems, provides the Sequencing and Navigation (SN), which relies on the concept of learning activities, to define the course sequencing behavior, to control the sequencing, to select and deliver of course, and to organize the content into a hierarchical structure, namely Activity Tree (AT) as a learning map. Therefore, how to provide customized courses according to individual learning characteristics and capabilities, and how to create, represent and maintain the activity trees with appropriate associated sequencing definition for different learners become two important issues. However, it is almost impossible to design personalized learning activity trees for each learner manually. The information of learning behavior, called learning portfolio, including learning path, preferred learning course, grade of course, and learning time, etc., can help teachers understand the reason why a learner got high or low grade. Thus, in this thesis, we apply data mining approaches to extract learning features from learning portfolio and then adaptively construct personalized activity trees with associated sequencing rules for learners.. 1.
(11) Our approach includes the following four phases: 1. User Model Definition Phase: we define firstly the learner profile including gender, learning style, and learning experience, etc., based upon pedagogical theory. 2. Learning Pattern Extraction Phase: we apply sequential pattern mining technique to extract the maximal frequent learning patterns from the learning sequence within learning portfolio. Thus, original learning sequence of a learner can be mapped into a bit vector where the value of each bit is set as 1 if the corresponding learning pattern is contained, and distance based clustering approach, e.g., K-means, can be used to group learners with good learning performance into several clusters. 3. Decision Tree Construction Phase: after extraction phase, every created cluster will be tagged with a cluster label. Thus, two third of the learner profiles with corresponding cluster labels are used as training data to create a decision tree, and the remaining are the testing data. 4. Activity Tree Generation Phase: finally, each created cluster including several learning patterns as sequencing rules can be used to generate personalized activity tree with associated sequencing rules of SN. Therefore, after analyzing questionnaire of personal learning characteristics, a new learner can be classified into one specific cluster based upon the decision tree and a personalized activity tree adaptively created for this cluster will be provided for achieving the good learning results expectably.. 2.
(12) Chapter 2: Related Work In this chapter, we review SCORM standard and some related work as follows.. 2.1 SCORM (Sharable Content Object Reference Model) [2]. Among those existing standards for learning contents, SCORM is currently the most popular one. It is a product of the U.S. Government's initiative in Advanced Distributed Learning (ADL). In November of 1997, the Department of Defense and the White House Office of Science and Technology Policy launched the ADL initiative with the goal of providing access to high-quality education and training materials that are easily tailored to individual learner needs and available whenever and wherever they are needed. SCORM-compliant courses leverage course development investments by ensuring that compliant courses are Reusable, Accessible, Interoperable, and Durable. Moreover, the Sequencing and Navigation (SN) in SCROM 1.3 (or Called SCORM 2004), relies on the concept of learning activities, each of which may be described as an instructional event, events embedded in a content resource, or an aggregation of activities to describe content resources with their contained instructional events. Content in SN is organized into a hierarchical structure, namely. 3.
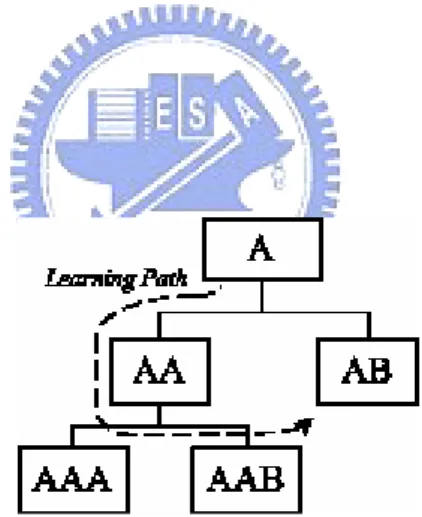
(13) activity tree (AT) as a learning map. The examples of AT are shown in Figure 2.1. Each activity including one or more child activities has an associated set of sequencing behaviors, defined by the Sequencing Definition Model (SDM) which is a set of attributes used by SN. The SN process uses information about the desired sequencing behavior to control the sequencing, selecting and delivering of activities to the learner. The intended sequence is described by a specific set of data attributes, which are associated with learning activities in the activity tree to describe the sequencing behavior. Moreover, the activity tree can be considered as the learning map.. Figure 2.1: An Example of Activity Tree. The sequencing behaviors describe how the activity or how the children of the activity are used to create the desired learning experience. SN makes no requirements on the structure, organization or instruction of the activity tree. The tree and the associated sequencing definitions may be static or dynamically created. Therefore, how to create, represent and maintain the activity tree and associated sequencing definition, which is not specified, is an important issue. SN enables us to share not 4.
(14) only learning contents, but also intended learning experiences. It provides a set of widely used sequencing methods so that the teacher could do the sequencing efficiently.. 2.2 Other Related Research. In adaptive learning environment, Shang [25] proposed an intelligent environment for active learning to support the student-centered, self-paced, and highly interactive learning approach. The learning environment can use the related learning profile of student, e.g., learning style and background knowledge, to select, organize, and present the customized learning materials for students. Trantafillou [27] also proposed an adaptive learning system, called AHS, in which Learners can be divided into two groups with Field Independence (FI) and Field Dependence (FD) respectively according to their cognitive styles. Then, the AHS system can provide appropriate strategy and learning materials for different groups. Moreover, according to learning styles and learning experience of learners, Gilbert [14] applied the Case Based Reasoning (CBR) technique to assign a new learner to the most similar one of four groups. Based upon the learning experience in group selected by CBR, the proposed system can offer the new learner an adaptive learning material. However, in all systems mentioned above, the information and approaches used to represent and. 5.
(15) group learners respectively are too easy to provide learners with personalized learning materials. In addition, for learning portfolio analysis, Chen [6][8] applied decision tree and data cube techniques to analyze the learning behaviors of students and discover the pedagogical rules on students’ learning performance from web logs that include the amount of reading article, posting article, asking question, login, and etc. According to their proposed approach, teachers can easily observe learning processes and analyze the learning behaviors of students for pedagogical needs. Although their proposed approaches can observe and analyze the learning behavior of students, they don’t apply education theory to model the learning characteristics of learners. Therefore, the learning guidance can not be provided automatically for the new learner. Of course, they don’t support SCORM 2004 standard yet.. 6.
(16) Chapter 3: Learning Portfolio Analysis Using Data Mining Approach Several articles [7][9][14][19][31] have proposed that a new learner will get the similar learning performance if providing the learning guidance extracted from previous similar learners. The concept is the same as the adage of Chinese, “Good companions have good influence while bad ones have bad influence.” Therefore, we conclude that a new learner could get the high learning performance if s/he follows the effective learning experience of similar learners. However, this conclusion results in that the following three issues should be solved: (1) how to acquire the learning characteristics of learners, (2) how to group learners into several groups according to her/his individual learning characteristics, and (3) how to assign a new learner to a suitable group for offering her/him personalized learning materials.. 7.
(17) 3.1 The Process of Learning Portfolio During learning activity, learning behaviors of learners can be recorded in database, called learning portfolio, including learning path, preferred learning course, grade. of. course,. and. learning. time,. etc.,. in. e-learning. environment.. Articles[6][8][12][13][22] have proved that the information of learning portfolio can help teacher analyze the learning behaviors of learners and discover the learning rules for understanding the reason why a learner gets high or low grade. Therefore, based upon the learning portfolio, we can apply sequential pattern mining approach to extract frequent learning patterns of learners. Then, according to these mined learning patterns, these learners can be grouped into several groups with the similar learning behaviors using clustering approach. By using the questionnaires [9][10][14][17][21][24][32] proposed to acquire the learning characteristics of learners, we can acquire the learning characteristics of learners as learner profile that can be used to create a decision tree to predict which group a new learner belongs to. Thus, we propose a four phase Learning Portfolio Mining (LPM) approach using sequential pattern mining, clustering approach, and decision tree creation sequentially. Then, in the last Phase, we also propose an algorithm to create personalized activity tree which can be used in SCORM compliant learning environment. 8.
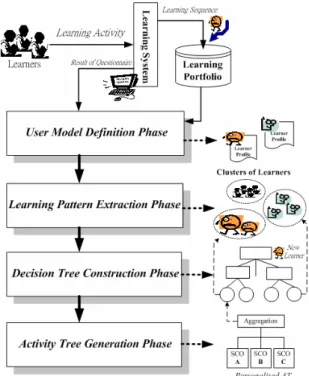
(18) 3.2 The Framework of Learning Portfolio Mining (LPM). As mentioned above, we propose a Learning Portfolio Mining (LPM) approach to extract learning features from learning portfolio and then adaptively construct personalized activity tree with associated sequencing rules for learners.. Figure 3.1: The Flowchart of LPM. As shown in Figure 3.1, the LPM includes four phases described as follows: (1) User Model Definition Phase: we define firstly the learner profile including gender, learning style, and learning experience, etc. based upon pedagogical theory and the definitions of what we are going to discover in database.. 9.
(19) (2) Learning Pattern Extraction Phase: we apply sequential pattern mining technique to extract the maximal frequent learning patterns from the learning sequence within learning portfolio. Thus, original learning sequence of a learner can be mapped into a bit vector where the value of each bit is set as 1 if the corresponding learning pattern is contained, and distance based clustering approach can be used to group learners with good learning performance into several clusters. (3) Decision Tree Construction Phase: after extraction phase, every created cluster will be tagged with a cluster labels. Thus, two third of the learner profiles with corresponding cluster label are used as training data to create a decision tree, and the remaining is the testing data. (4) Activity Tree Generation Phase: finally, each created cluster including several learning patterns as sequencing rules can be used to generate personalized activity tree with associated sequencing rules of Sequencing and Navigation (SN).. The details of each phase will be described in the following chapters.. 10.
(20) Chapter 4: The Clustering Process of Learner. In this chapter, we will describe the User Model Definition Phase and Learning Pattern Extraction Phase in LPM.. 4.1 User Model Definition Phase. Before extracting the learning features, we have to define a user model as learner profile, which will be recorded in database, to represent every learner based upon pedagogical theory. The definition is described as follows: Learner L= (ID, LC, LS), where z. ID: denotes the unique identification of a learner.. z. LC = <c1c2…cn>: denotes the sequence of learning characteristics of a learner.. z. LS = <s1s2…sn>: denotes the learning sequence of a learner during learning activity, where si is an item of learning content. There are several learning characteristics have been proposed in articles. [9][10][14][17][18][21][27][32] to describe the learning features of a learner. By integrating these different learning characteristics, we define the frequent learning characteristics for representing a learner. As shown in Table 4.1, the values of Gender,. 11.
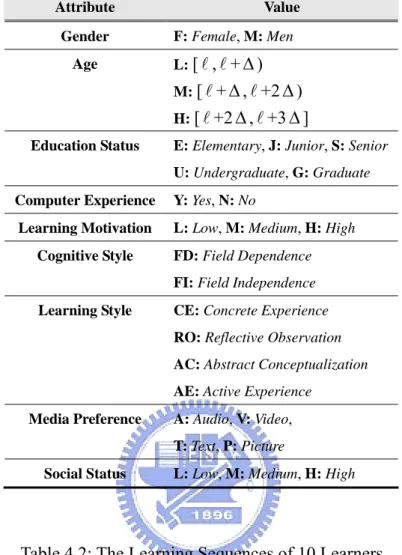
(21) Age, Education Status, Computer Experience, and Media Preference can be inputted by learners directly and the values of Learning Motivation, Cognitive Style, Learning Style, and Social Status can be acquired by questionnaire. Here, the numeric value of Age can be transformed into symbolic with {L, M, H}. The transformation principle is described as follows: In all learners, l and µ are the minimal and maximal values of age, respectively. Let ∆ =( l - µ )/3, and then a numeric value of age can be mapped into symbolic value with L in [ l , l + ∆ ), M in [ l + ∆ , l +2 ∆ ), and H in [ l +2 ∆ ,. l +3 ∆ ]. For example, LC = <F, M, S Y, H, FD, CE, T, H> denotes that a learner is a Female, Age is medium among all learners, Education Status is senior, and etc. Nevertheless, the learning characteristics in user model can be modified for the real needs. In addition, the LS denote a learning sequence of a learner. For example, in Figure 2.1, LS = <A, AA, AAA, AAB, AB> denotes that a learner studies the learning content A first and then studies the learning content AA, AAA, AAB, AB sequentially. Therefore, based upon the user model, the learner can be represented as L= (35, <F, M, S Y, H, FD, CE, T, H>, < A, AA, AAA, AAB, AB>).. 12.
(22) Table 4.1: The Learning Characteristics of Learner Attribute. Value F: Female, M: Men. Gender. L: [ l , l + ∆ ). Age. M: [ l + ∆ , l +2 ∆ ). H: [ l +2 ∆ , l +3 ∆ ]. Education Status. E: Elementary, J: Junior, S: Senior U: Undergraduate, G: Graduate. Computer Experience. Y: Yes, N: No. Learning Motivation. L: Low, M: Medium, H: High FD: Field Dependence. Cognitive Style. FI: Field Independence CE: Concrete Experience. Learning Style. RO: Reflective Observation AC: Abstract Conceptualization AE: Active Experience Media Preference. A: Audio, V: Video, T: Text, P: Picture. Social Status. L: Low, M: Medium, H: High. Table 4.2: The Learning Sequences of 10 Learners ID. Learning Sequence (LS). 1. <B, C, A, D, E, F, G, H, I, J>. 2. <A, B, H, D, E, F, C, G, I, J>. 3. <A, D, F, G, H, B, C, I, J>. 4. <A, B, D, E, C, F, G, H>. 5. <A, C, J, F, B, H, D, E, I, G>. 6. <B, H, F, D, E, A, G, C, I>. 7. <A, J, E, H, B, C, I, D, G>. 8. <B, C, G, E, A, H, D, I, J, F>. 9. <C, E, G, F, J, B, H, A, D>. 10. <B, C, A, J, D, E, G, H, F, I>. 13.
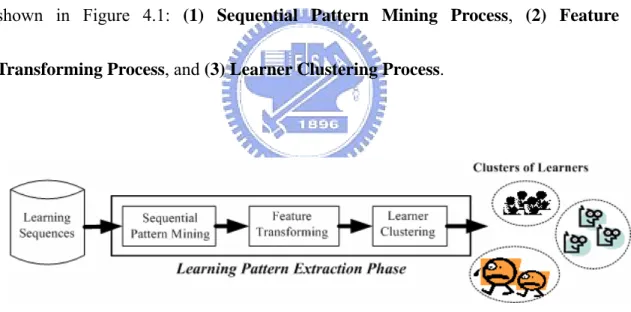
(23) 4.2 Learning Pattern Extraction Phase. After defining the user model, we can apply sequential pattern mining technique to extract the maximal frequent learning patterns from the learning sequence within learning portfolio. Because we try to offer a new learner with effective learning guidance, we collect the learning sequences of learners with high learning performance from database, as shown in Table 4.2. For extracting the frequent learning pattern, the Learning Pattern Extraction Phase includes three processes shown in Figure 4.1: (1) Sequential Pattern Mining Process, (2) Feature Transforming Process, and (3) Learner Clustering Process.. Figure 4.1: Learning Pattern Extraction Phase. 14.
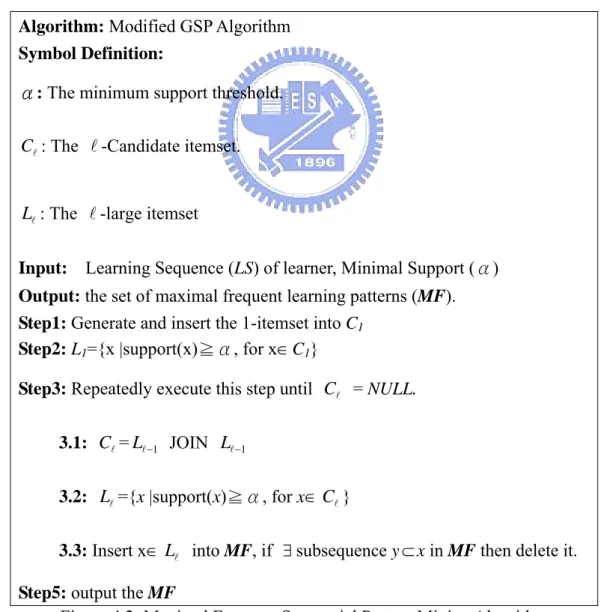
(24) 4.2.1 Sequential Pattern Mining Process. In this thesis, we modify a sequential pattern mining approach, called GSP algorithm[4][23], to extract the frequent learning patterns from learning portfolio because we use the maximal frequent learning pattern to represent the learning features of learners, shown in Figure 4.2.. Algorithm: Modified GSP Algorithm Symbol Definition: α: The minimum support threshold.. Cl : The l -Candidate itemset. Ll : The l -large itemset Input: Learning Sequence (LS) of learner, Minimal Support (α) Output: the set of maximal frequent learning patterns (MF). Step1: Generate and insert the 1-itemset into C1 Step2: L1={x |support(x)≧α, for x ∈ C1} Step3: Repeatedly execute this step until Cl = NULL. 3.1: Cl = Ll −1 JOIN Ll −1 3.2: Ll ={x |support(x)≧α, for x ∈ Cl } 3.3: Insert x ∈ Ll into MF, if ∃ subsequence y ⊂ x in MF then delete it. Step5: output the MF Figure 4.2: Maximal Frequent Sequential Pattern Mining Algorithm 15.
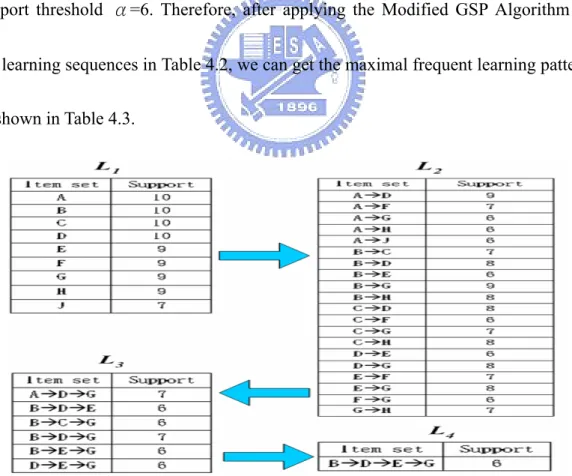
(25) In Figure 4.2, the subsequence definition and JOIN process which are borrowed from GSP algorithm are described as follows. A sequence s1 joins with s2 if the subsequence obtained by dropped the first item of s1 is the same as the subsequence obtained by dropped the last item of s2. The candidate sequence generated by joining s1 with s2 is the sequence s1 extended with the last item of s2. For example, in L3 , sequence <A, B, C> joins with <B, C, D> to generate <A, B, C, D> for generating the. Cl . Figure 4.3 shows the mining process of Modified GSP Algorithm with minimal support threshold α=6. Therefore, after applying the Modified GSP Algorithm for the learning sequences in Table 4.2, we can get the maximal frequent learning patterns as shown in Table 4.3.. Figure 4.3: Mining Process of Modified GSP Algorithm withα= 6. 16.
(26) Table 4.3: The Set of Maximal Frequent Learning Patterns (MF) Large Itemset. Maximal Frequent Learning Patterns. L2. AÆF. AÆH. L3. AÆDÆG. BÆCÆG. L4. BÆDÆEÆG. AÆJ. BÆH. 17. CÆD. CÆF. CÆH. EÆF. FÆG. GÆH.
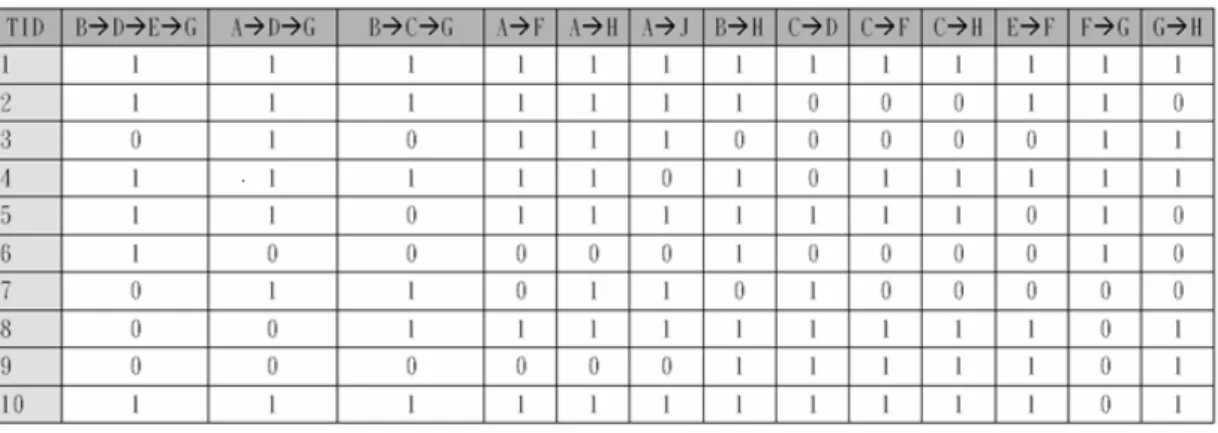
(27) 4.2.2 Feature Transforming Process. The generated maximal frequent learning patterns can be used to represent learning features of learners, which denotes that a learner would get high learning performance if s/he follows these learning patterns. Thus, based upon maximal learning patterns, the original learning sequences in Table 4.3 of every learner can be mapped into a bit vector where the value of each bit is set as 1 if the mined maximal learning pattern is a subsequence of original learning sequence. For example, in Figure 4.3, the frequent learning pattern <BÆDÆEÆG> is a subsequence of learning sequence <A, B, H, D, E, F, C, G, I, J> of the second learner and the <CÆD> is not. Therefore, we can get the bit vector of every learner according to feature transforming process [15] as shown in Table 4.4.. Table 4.4: The Result of Feature Transforming Process. 18.
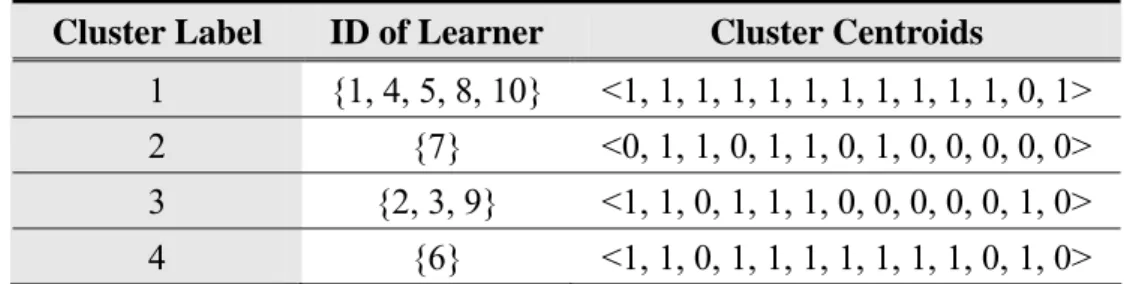
(28) 4.2.3 Learner Clustering Process. As mentioned above, every learner can be represented by mined frequent patterns. Therefore, we can apply clustering algorithm to group learners into several clusters according to learning features of learners. In the same cluster, every learner with high learning performance has the similar learning behaviors. However, it is difficult to determine the number of clusters for applying clustering approach like K-means algorithm. A clustering algorithm, called ISODATA [16], can dynamically change the number of clusters by lumping and splitting procedures and iteratively change the number of clusters for better result. Therefore, in this thesis, we apply the ISODATA clustering approach to group learners into different clusters. The Table 4.5 shows the result after applying ISODATA Clustering Algorithm for the data in Table 4.4. The bit vector in Cluster Centroid Filed denotes the representative learning patterns set in a cluster, which will be used to generate the sequencing rules of SCORM later. Table 4.5: The Result of Applying ISODATA Clustering Algorithm Cluster Label. ID of Learner. Cluster Centroids. 1. {1, 4, 5, 8, 10}. <1, 1, 1, 1, 1, 1, 1, 1, 1, 1, 1, 0, 1>. 2. {7}. <0, 1, 1, 0, 1, 1, 0, 1, 0, 0, 0, 0, 0>. 3. {2, 3, 9}. <1, 1, 0, 1, 1, 1, 0, 0, 0, 0, 0, 1, 0>. 4. {6}. <1, 1, 0, 1, 1, 1, 1, 1, 1, 1, 0, 1, 0> 19.
(29) Chapter 5:. The Prediction and Construction of Learning. Guidance. In this chapter, we will describe the Decision Tree Construction Phase and Activity Tree Generation Phase in LPM.. 5.1 Decision Tree Construction Phase. After learner pattern extraction phase, every created cluster will be tagged with a cluster label as shown in Table 4.5. However, how to assign a new learner to a suitable cluster according to her/his learning characteristics and capabilities is an issue to be solved. Fortunately, the decision tree approach can solve this issue. Thus, based upon the Learner Profiles with cluster labels in Table 5.1, we can apply decision tree induction algorithm, ID3 [20], to create a decision tree. In this thesis, two third of the learner profiles with associated cluster label are used as training data to create a decision tree, and the remaining is the testing data. The result of applying ID3 algorithm is shown in Figure 5.1.. 20.
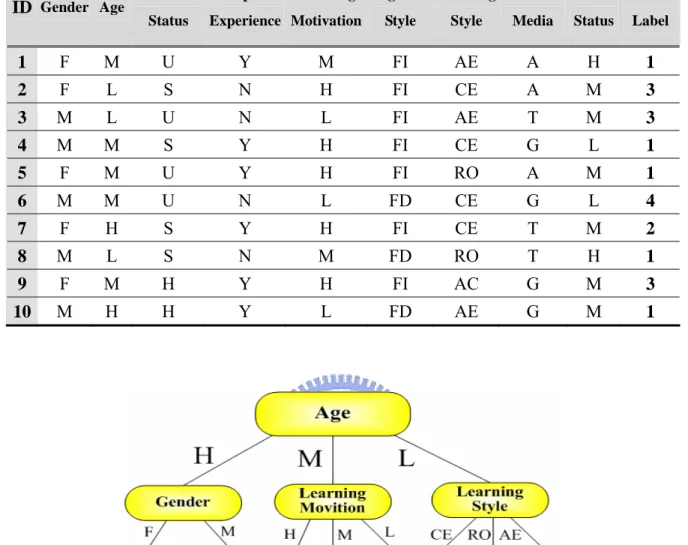
(30) Table 5.1: The Learner Profiles with Cluster Labels. ID Gender Age. Education Computer Status. Learning Cognitive Learning Preferred Social Cluster. Experience Motivation. Style. Style. Media. Status. Label. 1. F. M. U. Y. M. FI. AE. A. H. 1. 2. F. L. S. N. H. FI. CE. A. M. 3. 3. M. L. U. N. L. FI. AE. T. M. 3. 4. M. M. S. Y. H. FI. CE. G. L. 1. 5. F. M. U. Y. H. FI. RO. A. M. 1. 6. M. M. U. N. L. FD. CE. G. L. 4. 7. F. H. S. Y. H. FI. CE. T. M. 2. 8. M. L. S. N. M. FD. RO. T. H. 1. 9. F. M. H. Y. H. FI. AC. G. M. 3. 10. M. H. H. Y. L. FD. AE. G. M. 1. Figure 5.1: The Decision Tree Based upon the Learner Profiles in Table 5.1. 21.
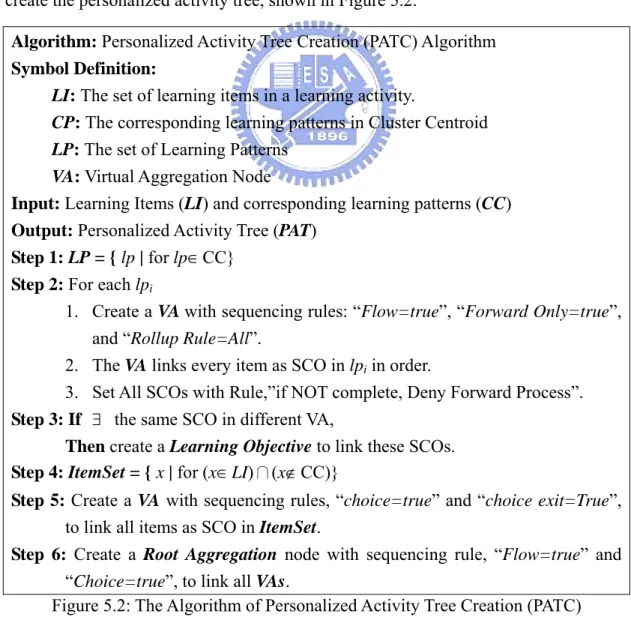
(31) 5.2 Activity Tree Generation Phase. Finally, based upon the created decision tree, we can assign a new learner to a suitable cluster which contains several learning guidance. Each cluster contains a cluster centroid which corresponds to lots of learning patterns as sequencing rules in sequencing and navigation (SN) of SCORM 1.3. Therefore, in this thesis, we propose an algorithm to transform learning patterns of cluster into sequencing rules and then create the personalized activity tree, shown in Figure 5.2. Algorithm: Personalized Activity Tree Creation (PATC) Algorithm Symbol Definition: LI: The set of learning items in a learning activity. CP: The corresponding learning patterns in Cluster Centroid LP: The set of Learning Patterns VA: Virtual Aggregation Node Input: Learning Items (LI) and corresponding learning patterns (CC) Output: Personalized Activity Tree (PAT) Step 1: LP = { lp | for lp ∈ CC} Step 2: For each lpi 1. Create a VA with sequencing rules: “Flow=true”, “Forward Only=true”, and “Rollup Rule=All”. 2. The VA links every item as SCO in lpi in order. 3. Set All SCOs with Rule,”if NOT complete, Deny Forward Process”. Step 3: If ∃ the same SCO in different VA, Then create a Learning Objective to link these SCOs. Step 4: ItemSet = { x | for (x ∈ LI)∩(x ∉ CC)} Step 5: Create a VA with sequencing rules, “choice=true” and “choice exit=True”, to link all items as SCO in ItemSet. Step 6: Create a Root Aggregation node with sequencing rule, “Flow=true” and “Choice=true”, to link all VAs. Figure 5.2: The Algorithm of Personalized Activity Tree Creation (PATC) 22.
(32) For the data of Cluster 2 in Table 4.5, the results of PATC algorithm are shown in Figure 5.3. Firstly, in Step 1, the LP will be inserted five learning patterns according to the centroid of cluster 2, i.e., LP= {AÆDÆG, BÆCÆG, CÆD, AÆH, AÆJ}. In Step 2, because a learning pattern, which contains several items as SCO in SCORM, e.g., the item A in pattern AÆH, represents an effective learning sequence, we can create a virtual aggregation node as a sub-activity to aggregate all items in learning pattern in order. Moreover, in each SCO, we set its sequencing rule with “if NOT complete, Deny Forward Process” for controlling the navigation order. In order to make learners complete all learning objects (SCO) and satisfy the pass condition, we set the Rollup rule as “All”. The rules, Flow=true” and “Forward Only=true”, can forbid learners to learn backward. In addition, a learning objective is created to link the same items appeared in different learning patterns. By setting the value of learning objective, we can forbid to learn an item repeatedly. For example, in Figure 5.3, the learning objective, called OBJ-A, links the SCO A in Aggregations 1, 2, and 3. After a learner satisfied the SCO A, the OBJ-A is set and then the SCO A in Aggregations 2 and 3 will be skipped. In addition, the frequent learning patterns may not contain all learning items in the learning activity. Thus, we also create an aggregation node as referable learning activity to link these items which are not contained in learning 23.
(33) patterns, e.g., in Figure 5.3, the Aggregation 6 contains {E, F, I} and rules, “choice=true” and “choice exit=True”, for free navigation. Finally, the root aggregation node is used to link all aggregation nodes. Therefore, according to PATC algorithm, we can create personalized activity tree, which can be executed in SCORM compliant learning environment, for every cluster. Thus, for a new learner, we can first use the created decision tree to choose a suitable cluster containing learning guidance of several similar learners and then offer her/him the corresponding personalized activity tree to learn.. Figure 5.3: The Result of PATC Algorithm based upon Cluster 2. 24.
(34) Chapter 6: System Implementation. In this Chapter, to evaluate our proposed approach of learning portfolio analysis and mining, we implemented the system and made an experiment to evaluate it based on LPM system. We introduce the interface of LMS [28][29][30] in Section 6.1. In Section 6.2, we describe the detail of the implementation of LPM. The LPM system is implemented in JAVA (JDK 1.4). A learning manage system (LMS) is implemented in JavaServer Pages (JSP), which is able to call the JAVA API. All the systems are executed on Microsoft Windows 2000 Server. The web log data is collected and stored in MicroSoft Access 2000.. 6.1 The interface of LMS. At the beginning, we need to define the format of input data in our system. Our data comes from the training students who have finished learning in LMS [28][29][30]. Figure 6.1 shows the process of training phase. It shows that the learning process includes eight main steps in this figure. In the first step, the students must login the LMS using an id registering with their personal information. After they login the LMS, the students should fill in the questionnaire values and make a pretest. Then they can learn courses in the LMS system. 25.
(35) Figure 6.1: The interface of LMS 26.
(36) Figure 6.2: The web log of a student We use these web logs as our input data, shown in Figure 6.2.. 6.2 The Implementation of LPM System. Figure 6.3: The interface of LPM. 27.
(37) In this Section, we describe the LPM system in detail. Figure 6.3 shows the interface of LPM. It includes three parts: input data, seven components and command buttons. The details of each component will be described in following subsections.. z Input Data There are three input data:DBURL,TableName and minimal support. DBURL denotes the path of the system used to access the database and the TableName denotes name of the input table of web logs. Finally, the minimal support allows user to scroll the value of support between of 0 and 1.. z Preprocesses Function This function is used to preprocess the input data. In our system, the original web log is the input data and it is transformed to other representation format using symbol ‘A’, ‘B’, etc. the output is shown in Figure 6.4.. Figure 6.4: The output of preprocess phase 28.
(38) z Sequential Pattern Function After the original web logs are preprocessed into our representation format, we use the “SP” button to extract the maximal frequent learning patterns from learning portfolio. The GSP algorithm will be implemented and applied to mine maximal frequent patterns, and the output is shown in Figure 6.5.. Figure 6.5: The result of applying GSP algorithm. z Independent Frequent Set Function IF denotes “Independent Frequent Set”. This function is used to modify the GSP algorithm. And output of this step is taken as the input data of feature transform process.. 29.
(39) z Feature Transformation Function In this step, based upon maximal learning patterns, the original learning sequences of every learner can be mapped into a bit vector where the value of each bit is set as 1 if the mined maximal learning pattern is a subsequence of original sequence. A new table, called “FeatureTransformTable”, is created with each learning mined sequence as one dimension to store this information. Therefore, we can use these bitwise vectors of each learner to group them into several clusters. Figure 6.6 shows the result of the Feature Transformation process.. Figure 6.6: The result of Feature Transform of each learner. z Clustering Function The ISODATA [16] algorithm is implemented and executed to group learners into several clusters through several iterations. The bit vector in Cluster Centroid 30.
(40) Filed denotes the representative learning patterns set in a cluster, which will be used to generate the sequencing rules of SCORM later. Figure 6.7 shows the output of this process.. Stored Cluster Information. Figure 6.7: The result of Clustering. z Decision Tree Function The ID3 algorithm is implemented and executed by clicking the Decision Tree button, and the output of this process is shown in Figure 6.8.. Figure 6.8: The result of Decision Tree Construction. 31.
(41) z Content Package Function Finally, based upon the cluster centroid of each cluster which is corresponding to several learning patterns as sequencing rules in sequencing and navigation (SN) of SCORM 2004, a personalized activity tree is generated for each cluster. To implement our PATC algorithm, the SCO which is imported into SCORM RTE or others SCORM compliant LMS is needed to reorganize and reuse in order to generate a content package. Indeed, we never want to create a new content package instead of reusing existing materials. Therefore, we should know the structure of an SCORM content package, as Figure 6.9 shows.. Figure 6.9: SCORM 2004 Content package Concept diagram. 32.
(42) A SCORM Content Package contains two major components [2]: z. A special XML document describing the content structure and associated resources of the package called the manifest file (imsmanifest.xml). A manifest is required to be present at the root of the content package.. z. The physical files making up the content package.. Therefore, we implement our PATC according to several steps in below: (1) Getting the information of each learning material As mentioned above, the granularity of learning material in our system is SCO. Fortunately, the SCORM RTE will store all information about SCOs, such as CourseID, ItemIdentifier, path, etc., it is that even if different SCOs in different Courses which may be imported into the RTE system by different authors. In other words, we really achieve the reusability by reorganizing different SCOs into one content package. Figure 6.10 shows the detailed information about SCOs in SCORM RTE. Then we can get the CourseID and its item identifier of each SCO.. 33.
(43) Figure 6.10: SCO’s information in SCORM’s ItemInfo Table. (2) Parsing physical files of each SCO Although we know the CourseID and identifier of each SCO, the physical files those make up this SCO material aren’t still known. To get this information, the “imsmanifest.xml” file which is the main file in every imported course is parsed. Due to using XML, an existing parser, Xerces [1], is used. Therefore, all information of each SCO’s physical files is obtained. (3) Generating the main file: “imsmanifest.xml” In this process, the main component of our activity tree: “imsmanifest.xml” is generated. W3C (World Wide Web Consortium) defines the Document Object Model (DOM) that allows programs and scripts to dynamically access and update the content and structure of documents. As a result, an xml file using DOM. 34.
(44) structure is created and added nodes with SCOs’ information including metadata, organizations and resources. In additionally, we also add sequential rules defined in PATC in Chapter 3 to the “imsmanifest.xml” file. (4). Zip them into one content package. Finally, a Zip package in JAVA is used to create a content package which use all information mentioned above. After generating personalized activity tree, this zip file is imported into SCORM RTE v 1.3 beta 3 to verify that whether it is compliant with SCORM standard or not. Figure 6.11 shows the result of our finally content package be workable in RTE.. Figure 6.11: Personalized Activity Tree imported in SCORM RTE. 35.
(45) Chapter 7: Experiment Design and Result Analysis. In this chapter, we describe the design of our experiment in Section 7.1 and the results are listed in Section 7.2. Finally, some findings are taken up for detailed discussions also in this Section.. 7.1 Experiment Design To verify our proposed approach workable for learners, an empirical experiment is designed to observe whether our system can provide adaptive learning environment to learners or not.. Figure7.1: Test Processes of Experiment of Non-navigation Group. The LPM system was offered to the senior high school students in Taiwan. We divided those students randomly into two parts: 2/3 as Non-navigation Group and 1/3 36.
(46) as Navigation Group indeed. Figure 7.1 shows the processes of Non-navigation Group and Figure 7.2 shows the processes of Navigation Group. Both of those two groups have the processes of register, questionnaire and pretest. All of them will end with post test and satisfaction measure to the system.. Figure 7.2: Test Processes of Navigation Group. As a result, the most difference between them is learning process. As these two figures show, Non-navigation Group students will have learned materials out of their choices without any navigation. On the other hand, the Navigation group students have learned and are navigated by the results of LPM according to their individual characteristics. When students register to be members of our system, we will ask them to fill in. 37.
(47) the values of their profiles for system need, such as ID, name, password, Email, Address, School, and class. Bedsides of those values, other categories such as education status, gender, and computer experienced and preferred media are asked to fill. Four testing questionnaires are used in the questionnaire process. The first is the Group Embedded Figures Test (GEFT) [34] , which is used to determine the cognitive style of the participants. In this test subjects perceived information (a series of simple figures) independently from larger complex figure in which the simple figures are embedded. This method can be used to divide the students into field dependent group (FD) and field independent (FI). The second questionnaire is learning style questionnaire [17]. This testing is used to divide the students into four groups of Concrete Experience (CE), Reflective Observation (RO), Abstract Conceptualization (AC) and Active Experimentation (AE) by using eighteen sub questions. The third questionnaire has five questions to determine the users’ motivation of learning system (LS). Each sub question arranges from strong disagree to strong agree and we use these results to divide into three values: low, medium, and high. The fourth questionnaire is to determine the social status of the learners. We use the degree of their parents to inference the social status of the learners and label with low, medium and high.. 38.
(48) The pretest is a quiz with 10 open-ended items, which is designed to determine the subject’s prior knowledge with the domain. Finally, a posttest will immediately be done that includes a performance test with the same items as the pretest to verify any increase in understanding at the end of the instruction. The finally process is the satisfaction measure. This questionnaire is an attitude and acceptance questionnaire for the students including items relating to the completeness and adaptivity and ease of use the systems.. 7.2 Experiment Design Issues. The main characteristic of LPM is that it can provide adaptive navigation support that aims to help users to find an appropriate path according to their individual characteristics. When the LMS system is implemented and used to make the experiment, there are many factors will be concerned. We list and briefly discuss them here: z. Participators: Our experiment if offered to senior high school students in Taiwan. We. choose two classes of students as our Non-navigation Group and another class as Navigation Group.. 39.
(49) z. Domain: The domain of our experiment is the Physics course. There are fourteen. learning objects in our experiment environment. As Table 7.1 shows, here are the names of each learning materials. z. Learning Object Relationship: Because our approach wants to extract learning patterns from good students,. the strong relationship among each learning objects is not necessarily used, such as math. For this reason, we choose the domain of Physics to verify our approach.. Table 7.1: Concepts List in Physics Course. Concept ID. Learning Concept. 1. Tools and Theories for Timing. 2. Unit of Time. 3. Isochronism of Pendulum. 4. Change of Position. 5. Movements. 6. Speed and Direction of Motion. 7. Average and Instant Speed. 8. X- t Diagram. 9. Change of Speed and Direction. 10. Acceleration. 11. Uniform Acceleration. 12. Free Fall. 13. V- t Diagram. 14. The Resultant of Forces 40.
(50) z. Learning Object Presentation: In Non-navigation Group process, the learning objects are represented as. three levels concept diagram [28] , there are domain, section and concept, shown in Figure 7.3. Furthermore, the granularity of each concept accords with the SCO in SCORM and only concept level has physical learning materials. In addition, the order of the presentation of each learning object is randomly provided in the level of concept level. For example, when a student chooses a virtue classroom in our LMS, the fist steps of learning materials is to choose the domain level. After choosing a domain, in Figure 7.3 is “Physics”, the Section level is chosen, there five options in Figure 7.3. However, only Concept level has physical learning materials, the students must go down to the Concept level and in this level the concepts are provided in randomly order. In this way, the learners are enhanced to choose the most prefer learning object.. Figure 7.3: The Concept Diagram of three level representaition. 41.
(51) 7.3 Result Analysis. As mentioned above, under such states, the LMS is used as learning environment and LPM is as mining tool. An empirical experiment designed in Section 6.2 is haven done. The experiment results and analyzing description are as follows. z. The statistics of the Participators We invited students in Kee Long senior high school as our participators. They are. divided into two groups, Non-navigation Group and Navigation Group. The statistics of them are shown in Table 7.2.. Table 7.2: The statistics of the participators Item. Non-navigation Group. Navigation Group. Sample size. 84. 45. Female. 40. 25. Male. 44. 20. Age. 17~19. 17~19. 42.
(52) z. The statistics with different minimal support. Table 7.3: Mining results with different minimal support minSupport. 0.1. 0.2. 0.3. 0.4. 0.5. 0.6. 0.7. 0.8. 0.9. LargeItem. 1022. 178. 90. 25. 13. 13. 10. 4. 0. MaxLength. 6. 4. 2. 2. 1. 1. 1. 1. 0. IndependentSet. 571. 134. 77. 12. 4. 1. 1. 1. 0. ClusterNum. 2. 6. 7. 9. 2. 1. 1. 1. 1. Item. After 84 learners of Non-navigation Group have finished the whole experiment, we analyze and count the total web logs which is stored in database. The total number of web logs is 36,659 which include login, logout, learning, selecting classroom, exam, etc. There are 14 learning objects (SCOs) and the minimal length of learning pattern is 5 and maximal is 14, the average length is 10. The top 2/3 of the Non-navigation Group is selected as training data in LPM. With inputting different minimal support, we can obtain different results of large item set, number of clusters, maximal length of learning sequences, and decision tree. The result shows in Table 7.3. z. The Result of pretest and posttest After the students of Navigation Group have finished the learning experience, we. compare the performance of students in Non-navigation Group with those in Navigation Group. We use pretest and posttest of domain knowledge as the performance of this learning experience. The total score of each quiz is 20 and this 43.
(53) quiz is limited to 20 minutes. The result shows in Table 7.4.. Table 7.4: Results with pretest and posttest. Sample Size. Non-navigation Group. Navigation Group. 84. 45. Pretest Mean Standard Deviation. 4.2. 4.5. 2.74. 2.41. Posttest Mean Standard Deviation. 14.3. 17.5. 3.52. 2.34. Improvement(Pretest-Post) Mean. 10.1. 13.0. 20 15. Non-navigation Group. 10. Navigation Group. 5 0 Pretest. Posttest. Figure 7.4: The Improvement of Non-navagation Group and Navagation Group. On the other hand, the difference of pretest and posttest can be treated as the improvement of this experience. Figure 7.4 shows the difference of these two groups about improvement of domain knowledge.. 44.
(54) z. The Result of satisfaction measure Finally, we offered the learners with a questionnaire of satisfaction measure. whose score extends agreement or disagreement with the following statements (appropriately phrased on a 1-5 scale where 1=strongly agree and 5= strongly disagree). As a result, the fewer score in the question item means the more satisfied with the system. Table 7.5 shows the results. Table 7.5: Results with satisfaction measure Non-navigation Navigation. Question Item. Group. Group. 2.54. 2.40. 3.78. 2.43. V3. Comprehensiveness of the instructional material.. 3.50. 2.50. V4. Enjoyment with the way the instructional material was presented.. 3.73. 2.24. V5. Variety of display formats (text, graphs, etc.) used.. 2.47. 2.34. V6. User-friendliness of the system.. 3.42. 2.21. V7. Ease of use of the system.. 2.65. 2.41. 3.87. 2.50. V9. Overall, I was very satisfied with the system.. 3.20. 2.50. V10. Overall, I have a very positive learning experience.. 3.31. 2.24. V1. Ability to use the system without additional help. V2. Degree of motivation infused by the instruction program to learn the material.. V8. Overall, I was very satisfied with the presentation of instructional material.. 45.
(55) z. Discussion and Recommendations The purpose of our study is to provide more adaptive and effective learning. environment to learners. There are several interesting conclusions from results of this empirical experience. z. The mean value of Non-navigation group is similar to the one of Navigation Group. It means that those two groups of students seem to have the same prior knowledge.. z. The result of the performance test indicated that subject’s performance was increased after the illustration, both of Non-navigation group and Navigation group.. z. However, the difference between the means of the pretest and the posttest showed that the students in Navigation group were improved more than Non-navigation group.. z. Both of the Non-navigation and Navigation students show positive attitude to our system in satisfaction measure.. z. The students in Navigation group show more adaptively with the environment than the ones in Non-navigation group.. In addition, they also felt that the system was clear and easy to understand and. 46.
(56) they had a better understanding of what they have learned. Furthermore, most of them show that they want to use the system again and they are willing to use the system in other domain. However, they also made suggestions for the improvement of the system. Some of the more significant recommendations are summarized into the following points: z. They suggested that the system should have concept map and graphic path indicator to show the structure the knowledge domain of whether they have learned or not.. z. They stated that the system should have more interaction with the system instead of only providing materials to learners.. z. They also suggested that the LMS should have more other functions and could interact with other users.. These recommendations resulted from an empirical study, although they haven’t a universal value of designing an adaptive learning system. However, we can design other features to enhance our LPM system to provide more adaptive and effective in accordance with these suggests in the near future.. 47.
(57) Chapter 8: Conclusions and Future Work. With vigorous development of the Internet, e-learning system has become more and more popular. How to provide customized course according to individual learning characteristics and capability, and how to create the activity tree in SCORM 2004 with appropriate associated sequencing definition for different learners are two important issues. Thus, in this thesis, we propose a four phase Learning Portfolio Mining (LPM) Approach, which uses sequential pattern mining, clustering approach, and decision tree creation sequentially, to extract learning features from learning portfolio and to create a decision tree to predict which group a new learner belongs to. Then, in the last Phase, we also propose an algorithm to create personalized activity tree which can be used in SCORM compliant learning environment.. Then, we implemented a prototype of LPM system and used this system to make an empirical experience at senior high school. The experimental results show that our proposed approach is feasible for those students. In addition, the results also show that our system provide more adaptive to learners and is accepted by most users. In other hand, we also get some suggests about our system and we can design other features to. 48.
(58) enhance our LPM system.. In the near future, we will extend the user model definition and enhance our mining approach for providing learners with more personalized learning guidance. Furthermore, we will enhance the experiment design and utilize statistic tools to verify the significant difference of our experiment. The mined learning patterns could also be further evaluated by the learning results of students. These statistics information could feed back to each phase of our mining approach. Finally, we will use the results to modify the parameters of each phase to provide more adaptivity environment to learners.. 49.
(59) Bibliography: [1] Apache Xerces, http://www.apache.org [2] Sharable Content Object Reference Model (SCORM), http://www.adlnet.org [3] W3C,http://www.w3.org [4] R. Aggrawal and R. Srikant, “Mining Sequential Patterns”, International Conference on Data Engineering(ICDE), 1996. [5] S. Beekhoven, U.D. Jong and H.V. Hout, “Different Course, Different Students, Same Results? An Examination of Differences in Study Progress of Students in Different Courses”, Higher Education, Vol. 46, 2003, pp. 37-59. [6] C.K. Chang, G. D. Chen and K. L. Ou ,“Student Portfolio Analysis for Decision Support of Web Based Classroom Teacher by Data Cube Technology”, Journal of Educational Computing Research, Vol. 19, No. 3, 1998. [7] V. Carchiolo, A. Longheu and M. Malgeri, “Adaptive Formative Paths in a Web-Based Learning Environment”, Educational Technology & Society, Vol. 5, No. 4, 2002, pp. 64-75. [8] G. D. Chen, C. C. Liu, K. L. Ou and B. J. Liu, “Discovering Decision Knowledge From Web Log Portfolio for Managing Classroom Processes by Applying. 50.
(60) Decision Tree and Data Cube Technology”, Journal of Educational Computing Research, Vol. 23, No. 3 , 2000, pp. 305-332. [9] W. Chen, and R. Mizoguchi., “Communication Content Ontology for Learner Model Agent in Multi-agent Architecture”, Advanced Research in Computers and Communications in Education, Proc. ICCE'99, pp. 95-102. [10] D.G. Dewhurst, H.A. Macleod and T.A.M. Norris, “Independent Student Learning Aded by Computers: An Acceptable Alternative to Lectures?”, Computer and Education, Vol.35, 2000, pp. 223-241. [11] S. Eugene, “The Relationship between Learning Style and Cognitive Style ”, Personality and Individual Differences, Vol.30, 2001, pp. 609-616 [12] U. Fayyad, “Data Mining and Knowledge Discovery in Database: Implications for Scientific Databases”, Proceedings of Ninth International Conference on Scientific and Statistical Database Management, 1997, pp. 2-11. [13] T. Feng and M. Fionn, “Towards knowledge Discovery from WWW Log Data”, Proceeding of the International Conference on Information Technology: Coding and Computing, 2000.. 51.
(61) [14] J.E. Gilbert and C.Y. Han, “Adapting Instruction in Search of ‘A Significant Difference’ ” , Journal of Network and Computer Application, Vol. 22, 1999, pp. 149-160. [15] V. Guralnik and G. Kartpis, “A Scalable Algorithm for Clustering Sequential data”, Proceedings of the 2001 IEEE International Conference on Data Mining, 2001, pp. 179-186. [16] D.J. Hall and G.B. Ball, "ISODATA : A Novel Nethod of Data Analysis and Pattern Classification", Technical report, Stanford Research Institute, Menlo park CA, 1965. [17] D.A. Kolb, “Learning Style Inventory: Technical Manual”, Boston, Mass: McBer originally published in 1976, 1985. [18] D. McIlroy, B. Bunting, K. Tierney and M. Gordon, “The Relation of Gender and Background Experience to Self-reported Computing Anxieties and Cognitions”, Computer in Human Behavior, Vol.17, 2001, pp. 21-33. [19] K.A. Papanikolaoua, M. Grigoriadoua and G.D. Magoulasb, and H. Kornilakisa, “Towards New Forms of Knowledge Communication: The Adaptive Dimension of A Web-base Learning Environment”, Computer and Education, Vol. 39, 2002, pp. 333-360.. 52.
(62) [20] J.Quinlan, “Induction of Decision Trees”, Machine learning, Vol.1, 1986, pp.81-106. [21] R. Riding and I. Cheema, “Cognitive Styles—An oOverview and Integration”, Educational Psychology, 11(3-4), 1991, pp.193-215. [22] J.E. Sharp, “Using Portfolio in Classroom”, Proceedings of 27th Frontiers in Education Conference, 1997, pp. 272-279. [23] R. Srikant and R. Aggrawal, “Mining Sequential Patterns: Generalizations and Performance Improvements”, The Fifth International Conference on Extending Database Technology,1996. [24] L. Shashaani and A. Khalili, “Gender and Computers: Similarities and Differences in Iranian College Students’ Attitudes Toward Computers”, Computer and Education , Vol.37, 2001, pp. 363-375. [25] Y. Shang, H.C. Shi, and S.S. Chen, “An Intelligent Distributed Environment for Active Learning”, ACM Journal of Educational Resources in Computing, Vol. 1, Issue 2, 2001, Article 4,17pages. [26] K. Smith and H. Tillema, “Evaluating Portfolio Use As A Learning Tool For Professionals”, Scandinavian Journal research , Vol. 42, No. 2, 1998, pp.193-205.. 53.
(63) [27] E. Trantafillou, A. Poportsis and S. Demetriadis, “The Design and The Formative Evaluation of An Adaptive Educational System based on Cognitive ”, Computer and Education, Vol. 41, 2003, pp. 87-103. [28] C. J. Tsai, S. S. Tseng, and G. H. Su, “Design of An Object-oriented and Rule-based Virtual School,” Proc. of GCCCE’00/ICCAI’00, pp. 320-327, Singapore, 2000. [29] C. J. Tsai, S. S. Tseng, and G. H. Su, “虛擬教室的設計與實作,” 遠距教育季 刊, 第 15/16 期, pp. 16-25, 2000. [30] C. J. Tsai, S. S. Tseng, C. T. Chen, H. L. Hsu, and J. R. Cheng, “Design of An Object-oriented. Teaching. Material. Authoring. System,”. Proc.. of. GCCCE/ICCAI’01, pp. 1008-1015, Taipei, Taiwan, R.O.C., 2001. [31] V. Tsiriga and M. Virvou, “Dynamically Initializing The Student Model in A Web-based. Language. Turor”,. First. International. IEEE. Symposium. “INTELLIGENT SYSTEMS”, 2002. [32] E.V. Wilson, “Student Characteristics and Computer-Mediated Communication”, Computer and Education, Vol.34, 2000, pp. 67-76. [33] M.J. Zaki, “SPAD: An Efficient Algorithm for Mining Frequent Sequences”, Machine Learning, Vol.42, 2001, pp. 31-60.. 54.
(64) [34] H.A. Witkin, P.K. Ottman, E. Raskin and S.A. Karp, “A manual for the embedded figures tests”, Consulting Psychologists, Palo Alto, CA,1971. 55.
(65) Appendix A: Learning Style Indicator z What kind of learner are you? Read each statement carefully. To the left of each statement, write the code that best describes how each statement applies to you. Answer honestly as there are no correct or incorrect answers. It is best if you do not think about each question too long, as this could lead you to the wrong conclusion. z SECTION 1 Place either an AE or a RO next to the statement below, depending upon which part of the statement mostly closely describes you. 1. _____ (AE) - I often produce off-the-cuff ideas that at first might seem silly or half-baked. (RO) - I am thorough and methodical. 2. _____ (AE) - I am normally the one who initiates conversations. (RO) - I enjoy watching people. 3. _____ (AE) - I am flexible and open minded. (RO) - I am careful and cautious. 4. _____ (AE) - I like to try new and different things without too much preparation. (RO) - I investigate a new topic or process in depth before trying it. 5. _____ (AE) - I am happy to have a go at new things. (RO) - I draw up lists up possible courses of actions when starting a new project. 6. _____ (AE) - I like to get involved and to participate. (RO) - I like to read and observe. 7. _____ (AE) - I am loud and outgoing. (RO) - I am quite and somewhat shy. 8. _____ (AE) - I make quick and bold decisions. (RO) - I make cautious and logical decisions. 9. _____ (AE) - I speak slowly, after thinking. (RO) - I speak fast, while thinking. Total of AEs - _____. Total of ROs - _____. The one that has the larger number is your task preference.. 56.
(66) z SECTION 2 Place either an AC or a CE next to the statement below, depending upon which part of the statement mostly closely describes you. 1. _____ (AC) - I ask probing questions when learning a new subject. (CE) - I am good at picking up hints and techniques from other people. 2. _____ (AC) - I am rational and logical. (CE) - I am practical and down to earth. 3. _____ (AC) - I plan events down to the last detail. (CE) - I like realistic, but flexible plans. 4. _____ (AC) - I like to know the right answers before trying something new. (CE) - I try things out by practicing to see if they work. 5. _____ (AC) - I analyze reports to find the basic assumptions and inconsistencies. (CE) - I rely upon others to give me the basic gist of reports. 6. _____ (AC) - I prefer working alone. (CE) - I enjoy working with others. 7. _____ (AC) - Others would describe me as serious, reserved, and formal. (CE) - Others would describe me as verbal, expressive, and informal. 8. _____ (AC) - I use facts to make decisions. (CE) - I use feelings to make decisions. 9. _____ (AC) - I am difficult to get to know. (CE) - I am easy to get to know. Total of ACs - _____. Total of CEs - _____. The one that has the larger number is your thought or emotional preference.. 57.
(67) Appendix B: Pretest attitude toward computers Extent agreement or disagreement with the following statements (appropriately phrased on a 1-5 scale where 1=strongly agree and 5= strongly disagree). ATT1. Apprehensiveness in using a computer. ATT2. Positive experiences in using computer applications. ATT3. Belief of computers’ role in education in terms of importance.. ATT4. Belief of computers’ role in business in terms of importance.. ATT5. Overall(positive) view of the role of computers.. 58.
(68) Appendix C: the Social status Indicator V1. What is the educational background of your father?. Doctor Master College Senior high school Others. V2. What is the educational background of your mother?. Doctor Master College Senior high school Others. V3. What is the income of your family each month?. $0~$1500 $1500~$3000 $3000~$4500 $4500~$6000 $6000 up. 59.
(69) Appendix D: the Satisfaction Measure Indicator Extent agreement or disagreement with the following statements (appropriately phrased on a 1-5 scale where 1=strongly agree and 5= strongly disagree). V1. Ability to use the system without additional help.. V2. Degree of motivation infused by the instruction program to learn the material.. V3. Comprehensiveness of the instructional material.. V4. Enjoyment with the way the instructional material was presented.. V5. Variety of display formats (text, graphs, etc.) used.. V6. User-friendliness of the system.. V7. Ease of use of the system.. V8. Overall, I was very satisfied with the presentation of instructional material.. V9. Overall, I was very satisfied with the system.. V10. Overall, I have a very positive learning experience.. 60.
(70)
數據
+7
相關文件
one on ‘The Way Forward in Curriculum Development’, eight on the respective Key Learning Areas (Chinese Language Education, English Language Education, Mathematics
The purpose of using information technology is to facilitate language learning, not to replace teachers. Does e-learning replace
• School-based curriculum is enriched to allow for value addedness in the reading and writing performance of the students. • Students have a positive attitude and are interested and
The indicators for assessment of child learning experiences evaluate children’s learning performance from the curriculum perspective, while the indicators for the Domain of
Science education provides learning experiences for students to develop scientific literacy with a firm foundation on science, realise the relationship between science, technology,
* 2 Learning contents to be replaced by the learning elements covered in the enriched TEKLA curriculum starting from 2016/17 school year... The enriched
(Samuel, 1959) Some studies in machine learning using the game of checkers. Picture extracted from the original paper of Samuel for
DVDs, Podcasts, language teaching software, video games, and even foreign- language music and music videos can provide positive and fun associations with the language for
