國 立 交 通 大 學
光 電 工 程 學 系 碩 士 班
碩 士 論 文
有機金屬螯合物之時間解析光激螢光之
研究
Time-resolved Photoluminescence study
of Organic Metal Chelates
研 究 生:張可揚
指導教授:安惠榮 教授
有機金屬螯合物之時間解析光激螢光之研究
Time-resolved Photoluminescence study of
Organic Metal Chelates
研 究 生:張可揚 Student:Ke-Yang Chang
指導教授:安惠榮 教授 Advisor:Prof.Hyeyoung Ahn
國 立 交 通 大 學
光電工程學系碩士班
碩 士 論 文
A Thesis
Submitted to Department of Photonics and
Institute of Electro-Optical Engineering
College of Electrical Engineering
National Chiao Tung University
In partial Fulfillment of the Requirements
for the Degree of
Master of Science
in
Electro-Optical Engineering
September 2013
Hsinchu, Taiwan, Republic of China
I
Time-resolved Photoluminescence study of
Organic Metal Chelates
Student: Ke-Yang Chang Advisor: Prof. Hyeyoung Ahn
Institute of Electro-Optical Engineering
National Chiao Tung University
Abstract
Since the discovery of luminescence from organic materials, there has been a considerable amount of efforts devoted to developing organic light emitting devices for use in display applications. Recently, organic light emitting materials also emerge as the candidate for highly efficient active media for lasers. And significant enhancement of spontaneous emission by coupling with surface plasmonic energy transfer has been demonstrated for organic materials. In this work, we studied the surface plasmon-induced enhancement of spontaneous emission and estimated the Purcell factors from three organic chelates dyes doped by 4-(dicyanomethylene)-2-methyl-6-(4-dimethylaminostyryl)-4H-pyran (DCM), Znq:DCM (2.5%), BAlq:DCM (2.5%), and Alq3:DCM (2.5%). Besides the
time-integrated photoluminescence (PL), time-resolved PL (TRPL) from these organic materials was measured by time-correlated single photon counting (TCSPC) technique. Doping the guest emitter DCM to the host emitter in organic dyes can make the energy transfer from the host to the guest, and then the spontaneous emission rate can be increased. Gold film coated on the sample induces the surface plasmon enhancement between the metal and the dielectric medium and the Purcell
II
factor, obtained from the TRPL signals measured with and without the gold film, can be increased. While those of Znq:DCM and BAlq:DCM are improved with gold film, the radiative properties of Alq3:DCM are not significantly affected. For Znq:DCM
coupled with gold film, PL intensity enhancement as large as 8-fold was observed and the Purcell factor was estimated to be ~2. Significant shortening of radiative lifetime was also observed for Au film-covered Znq:DCM and the corresponding radiation efficiency was estimated.
III
Acknowledgement
在這念碩士班兩年的日子裡有辛苦也有歡笑,從一開始接觸未知的領域到開始自 己做實驗的過程都要經過一番努力學習才會有收穫。在這過程中,首先我要感謝 我的指導教授安惠榮老師,老師在平常會告訴我們要念什麼方面的書或修什麼課, 讓我們有方向可以快點了解實驗室的主要研究,另外老師最注重的是研究的態度, 有努力認真的態度就算實驗結果不好也沒有關係,重點是那個研究過程才是學習 的精隨,推廣到整個做人處事的話,也就是說並不是任何事情都一定會有好結果, 努力才是最重要的,這讓我對我的做事態度有很深的影響。再來要特別感謝我們 實驗室的博士後陳景智博士,每當我有實驗數據分析的問題,他總是不厭其煩的 與我討論每一個細節,我看不懂的參考文獻,也總是一一替我說明,沒有他我碩 士班的最後一段時間一定會很難熬。接著要感謝清華大學果尚志老師實驗室的呂 宥蓉學姐,我做實驗的樣品、儀器常常都要跟他借,在最初做實驗的階段,關於 樣品的部分我那時還摸不著頭緒,也是學姐告訴我可以去探討某些部分,提供我 一些參考文獻讓我研究,讓對我的之後的實驗有靈感。然後要特別感謝一開始帶 我做實驗的學長劉育昇,有著他在做實驗上的教導,讓我對我們實驗室所做的研 究開始慢慢了解,然後之後更讓我有能力自己做實驗,然後對於實驗儀器操作方 面的問題,我有時不會用時,他也會適時的幫助我,讓我能順利做實驗,很感謝 他。再來是我同屆的同學,李珉澤、江邦賢、還有蘇修禾,在這兩年由其實碩二 這年,大家都過得很辛苦,常常會熬夜做實驗到天亮,心情不好的時候就互吐苦 水或加油打氣,之後就有動力繼續努力下去,沒有你們的陪伴我應該畢不了業。 然後要感謝我的女朋友葉仲芸,他都會跟我一起出去外面走走散散心,或者出去 吃好料的,緩和星期一到五緊繃的情緒,然後在我實驗做不出來時,總是會跟我 加油打氣,所以每到周末我都很開心能與他見面。然後感謝實驗室的學弟們,陳 樺、嚴仕君、劉維勳,蔡堯鈞,有時候一起打屁聊天很開心,能讓我暫時忘掉壓 力。然後最要感謝的就是我的家人,從大學開始到研究所,因為都在北部念書, 離家很遠,所以很少回家,但他們也總是體諒我要念書要做實驗抽不了身,偶爾 抽空回家也是很快就要回學校,他們也不會跟我抱怨一句,所以很謝謝他們。最 後我能念完這碩士學位,寫完這本論文決不是靠我一己之力,而是靠著大家的支 持與陪伴而完成的,真的很謝謝大家陪我度過這兩年的日子。IV
Content
Abstract ... I Acknowledgement ... III Content ... IV List of figures ... VIList of tables... VIII
Chapter 1 Introduction ... 1
1-1 Background ... 1
1-2 Motivation ... 3
1-3 Thesis structure ... 5
Chapter 2 Background Overview ... 6
2-1 Absorption and emission ... 6
2-2 Singlet and triplet excited states... 8
2-3 Charge transfer in organic molecules ... 10
2-4 Light emitting mechanisms ... 11
2-4.1 Energy transfer ... 11
2-4.2 Carrier trapping ... 13
2-5 The Purcell factor ... 14
2-5.1 The expression of the Purcell factor[24] ... 14
Chapter 3 Experimental setup and samples ... 17
3-1 Time-Resolved Photoluminescence (TRPL) System ... 17
3-1.1 The principle of Time-Correlated Single Photon Counting ... 18
3-1.2 Principles behind PicoHarp 300 ... 19
3-1.3 Experimental Setup for TPRL measurement with TCSPC ... 20
V 3-2 Organic Dyes ... 22 3-2.1 DCM... 22 3-2.2 Alq3 ... 22 3-2.3 BAlq ... 23 3-2.4 Znq ... 23 3-3 Sample preparation ... 24 3-3.1 Samples on mica ... 24 3-3.2 Sample on SOG ... 25
Chapter 4 Result and discussion ... 26
4-1 Power dependence of photoluminescence ... 26
4-2 Wavelength dependence of photoluminescence ... 58
Chapter 5 Conclusion ... 64
VI
List of figures
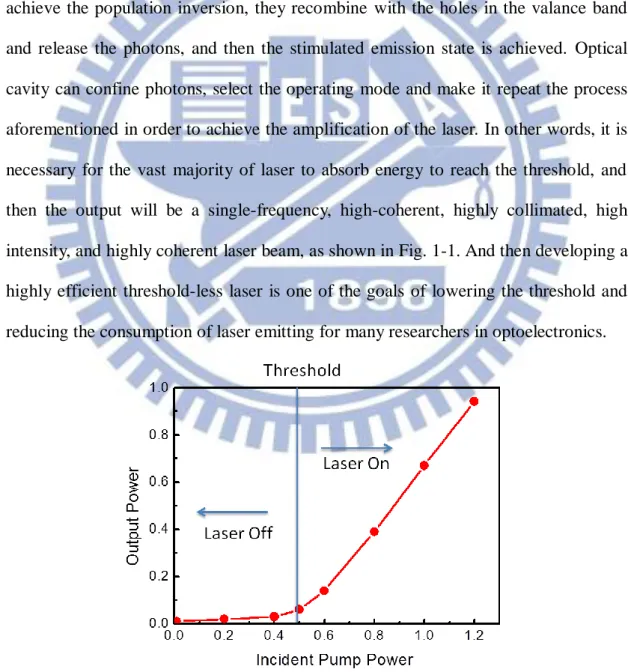
Fig. 1-1 Schematic diagram of laser threshold. ... 1
Fig. 2-1 The emitting principle of the fluorescence and phosphorescence[8]. ... 6
Fig. 2-2 Excited state after the recombination of the electrons and the holes[9]. ... 8
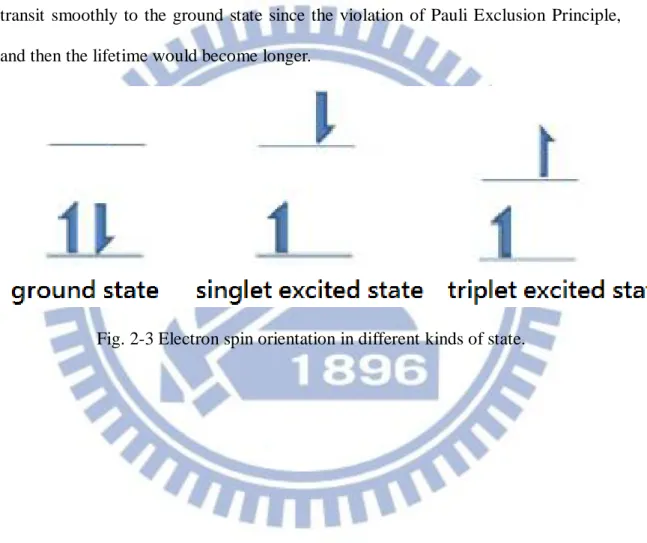
Fig. 2-3 Electron spin orientation in different kinds of state. ... 9
Fig. 2-4 Electron transfer in organic semiconductor[8]. ... 10
Fig. 2-5 Förster and Dexter energy-transfer mechanisms[14]. ... 12
Fig. 3-1 TCSPC histogram... 18
Fig. 3-2 Building blocks of PicoHarp 300. ... 20
Fig. 3-3 Experiment setup for TPRL measurement with TCSPC. ... 20
Fig. 3-4 Experiment setup for PL measurement. ... 21
Fig. 3-5 Molecule structure of DCM. ... 22
Fig. 3-6 Molecule structure of Alq3. ... 22
Fig. 3-7 Molecule structure of BAlq. ... 23
Fig. 3-8 Molecule structure of Znq. ... 23
Fig. 3-9 Structure of the samples on mica. ... 24
Fig. 3-10 (a)OM image of gold nanoplates. (b) Structure of the sample on SOG. ... 25
Fig. 4-1 PL peak intensity against pump fluence of sample A. ... 27
Fig. 4-2 PL peak intensity against pump fluence of sample B. ... 27
Fig. 4-3 PL peak intensity against pump fluence of sample C. ... 28
Fig. 4-4 PL peak intensity against pump fluence of sample D (a) first peak, (b) second peak. ... 28
Fig. 4-5 Physical mechanism of the electron-hole recombination and surface plasmon coupling. ... 30
Fig. 4-6 Surface plasmon dispersion diagram[26], interfaced with Au (dash line), Ag (solid line), and Al (dotted line). ... 30 Fig. 4-7 Power-dependent PL of sample A (a) without gold film, (b) with gold film. 32 Fig. 4-8 Power-dependent PL of sample B (a) without gold film, (b) with gold film. 33 Fig. 4-9 Power-dependent PL of sample C (a) without gold film, (b) with gold film. 34 Fig. 4-10 Power-dependent PL of sample D (a) without gold nanoplates, (b) with gold
VII
nanoplates. ... 35
Fig. 4-11 Enhancement ratio against pump fluence of sample A. ... 37
Fig. 4-12 Enhancement ratio against pump fluence of sample B. ... 37
Fig. 4-13 Enhancement ratio against pump fluence of sample C. ... 38
Fig. 4-14 Enhancement ratio against pump fluence of sample D (a) first peak, (b) second peak. ... 38
Fig. 4-15 PL spectra comparisons of dyes with gold and without gold of sample A at pump fluence 48 kW/cm2. ... 40
Fig. 4-16 PL spectra comparisons of dyes with gold and without gold of sample B at pump fluence 48 kW/cm2. ... 40
Fig. 4-17 PL spectra comparisons of dyes with gold and without gold of sample C at pump fluence 48 kW/cm2. ... 41
Fig. 4-18 PL spectra comparisons of dyes with gold and without gold of sample D at pump fluence 48 kW/cm2. ... 41
Fig. 4-19 PL spectra comparisons of dyes with gold and without gold of sample A measured by CW 405nm diode laser. (From Prof. S. Gwo’s lab in National Tsing Hua University.) ... 42
Fig. 4-20 PL spectra comparisons of dyes with gold and without gold of sample B measured by CW 405nm diode laser. (From Prof. S. Gwo’s lab in National Tsing Hua University.) ... 43
Fig. 4-21 PL spectra comparisons of dyes with gold and without gold of sample C measured by CW 405nm diode laser. (From Prof. S. Gwo’s lab in National Tsing Hua University.) ... 43
Fig. 4-22 PL spectra comparisons of dyes with gold and without gold of sample D measured by CW 405nm diode laser. (From Prof. S. Gwo’s lab in National Tsing Hua University.) ... 44
Fig. 4-23 TRPL measurement of sample A (a) without gold film, (b) with gold film. 46 Fig. 4-24 TRPL measurement at 550nm of sample B (a) without gold film, (b) with gold film. ... 47 Fig. 4-25 TRPL measurement of sample C (a) without gold film, (b) with gold film. 48 Fig. 4-26 TRPL measurement of sample D (a) first peak without gold nanoplates, (b)
VIII
first peak with gold nanoplates, (c) second peak without gold nanoplates, (d)
second peak with gold nanoplates. ... 49
Fig. 4-27 Time constant of power-dependent PL of sample A. ... 51
Fig. 4-28 Time constant of power-dependent PL at 550nm of sample B. ... 51
Fig. 4-29 Time constant of power-dependent PL of sample C. ... 52
Fig. 4-30 Time constant of power-dependent PL of sample D. ... 52
Fig. 4-31 (a),(b) Absorption and PL spectra of Alq3 and DCM, respectively. (c) Energy level diagram of Alq3:DCM. ... 54
Fig. 4-32 The reduction in lifetime of sample A at pump fluence 48 kW/cm2. ... 56
Fig. 4-33 The reduction in lifetime at 550nm of sample B at pump fluence 48 kW/cm2. ... 56
Fig. 4-34 The reduction in lifetime of sample C at pump fluence 48 kW/cm2. ... 57
Fig. 4-35 The reduction in lifetime of sample D at pump fluence 48 kW/cm2 (a) first peak, (b) second peak ... 57
Fig. 4-36 Fast and slow time constants with PL spectrum of sample A (a) without gold film, (b) with gold film. ... 59
Fig. 4-37 Fast and slow time constants with PL spectrum of sample B. (a) without gold film, (b) with gold film. ... 60
Fig. 4-38 Fast and slow time constants with PL spectrum of sample C. (a) without gold film, (b) with gold film. ... 61
Fig. 4-39 Purcell factor against wavelength of sample A, B, and C. ... 62
List of tables
Table 3-1 Symbol assignment of four samples. ... 24Table 4-1 Purcell factor at pump fluence 48 kW/cm2 of four samples. ... 55
1
Chapter 1 Introduction
1-1 Background
Since its first appearance in 1960, laser has been one of the most important and powerful tools in the optical society. Laser system basically consists of pumping source, gain material and optical cavity. The working principle of the laser system is that the electrons in gain material transit to excited state by absorbing the electrical or optical energy from the pumping source. After the electrons in the conduction band achieve the population inversion, they recombine with the holes in the valance band and release the photons, and then the stimulated emission state is achieved. Optical cavity can confine photons, select the operating mode and make it repeat the process aforementioned in order to achieve the amplification of the laser. In other words, it is necessary for the vast majority of laser to absorb energy to reach the threshold, and then the output will be a single-frequency, high-coherent, highly collimated, high intensity, and highly coherent laser beam, as shown in Fig. 1-1. And then developing a highly efficient threshold-less laser is one of the goals of lowering the threshold and reducing the consumption of laser emitting for many researchers in optoelectronics.
2
Common types of semiconductor laser are Fabry-Perot edge-emitting laser, distributed feedback (DFB) laser, and vertical-cavity surface-emitting laser (VCSEL) and so on. The most different element among them is the form of the optical cavity. The ability of photons being limited in the optical cavity is depending on the quality factor (Q). Quality factor is defined as the ratio of the energy stored in optical cavity to the energy loss from the optical energy. In other words, the probability of the existence of photons in the gain medium will be high if the optical cavity has a high quality factor, and the probability of spontaneous emission will be subsequently high. The enhancement of spontaneous emission can be expressed by the Purcell factor[1]
,
where is emission wavelength, n is the refractive index of the material, and is the mode volume of the resonator. If the Purcell factor is high, the spontaneous emission coupling factor
will be close to one
[2]
. Then the threshold will close to zero so that a highly efficient laser can be realized. Therefore, improvement of the quality factor or reducing the mode volume is a key issue to increase the Purcell factor.
3
1-2 Motivation
Lasing action in optically pumped thin film of organic semiconductors has recently been demonstrated. There are several reasons why organic dyes can be attractive laser material. The first is that there exists a variety of organic dyes can emit light across the visible spectrum. And the organic materials have broad spectra which can provide the large tunability lasers and allow the easy adjustment of the output wavelength to the particular requirement of the spectroscopic application. And the simple fabrication of organic semiconductor devices by simple techniques such as evaporation can make a low cost manufacturing process. And due to the soft features of the organic materials, there is a good possibility for them to work with flexible substrates. Thus, if highly efficient organic semiconductor lasers can be achieved, there will be a wide range of applications.
Recently, surface plasmon (SP) has been used as a means to couple into the luminescent layer because it can increases the density of states and the spontaneous emission rate. The SPR-induced wave is called surface plasmon polaritons, which are surface electromagnetic waves that propagate in the metal-dielectric interface. Surface plasmons have been used to enhance the surface sensitivity of several spectroscopic measurements including fluorescence, Raman scattering, and second harmonic generation. The enhanced emission of organic material coupled with metal by surface plasmon polaritons[3-7] has been widely studied. So by metal coating of organic materials, the desired emission and the spontaneous emission rate can be enhanced significantly due to the energy transfer between the metal interfaces via surface plasmons, and then the Purcell factor will be increased. Owing to the above-mentioned advantages of the organic semiconductors, we choose three organic chelates dyes of Znq, BAlq, and Alq3 doped by DCM for studying. Alq3 is a
4
well-known organic material that has been widely studied for light emitting devices. In this work, we want to observe the influence of SP coupling to the light emitting behavior of three organic samples. The photoluminescence (PL) of three samples coated with and without gold were elucidated by using the time-integrated and time-resolved PL measurement techniques to realize the best candidate for developing a highly efficient organic semiconductor laser. In particular, time-resolved PL (TRPL) analysis can provide the information of energy transfer between donors and host media as well as the enhancement mechanism due to SPR.
5
1-3 Thesis structure
In Chapter 1, we have an overview of the relation between laser and Purcell factor and introduce the surface plasmon resonance. In Chapter 2, we mainly describe the theories of organic materials and the derivation of the Purcell factor formula. In Chapter 3, we introduce the experimental setup and the sample preparation. In Chapter 4, data analyze and the discussion is given. And the conclusion is shown in Chapter 5.
6
Chapter 2 Background Overview
2-1 Absorption and emission
Absorption and emission characteristics of organic materials can be measured by UV/VIS photoluminescence spectroscopy. The absorption/emission characteristics are determined by the molecular orbitals. According to Pauli’s exclusion principle, each molecular orbital can only be filled with two electrons. The electrons start to fill from the lowest energy level, and then we can get the lowest-energy electron configuration. When electrons fill up the highest occupied molecular orbitals (HOMO), the molecule is in the so-called ground state and molecules are usually in the ground state. When the excitation light absorbed by molecules, electrons can transit to a higher energy level to the excited state, but the excited electrons will quickly go back to the lowest occupied molecular orbitals (LUMO) through internal conversion and relaxation.
7
When the molecules absorb energy, the electrons will transit to the singlet excited state (Sn). Fluorescence is the light when the electrons in the singlet excited state transit to the ground state. If the electrons at the singlet excited state transit to the lower level triplet excited state (Tn) via intersystem crossing (ISC) and go back to the ground state and emit the light, the light is called phosphorescence.
8
2-2 Singlet and triplet excited states
Organic materials have different excited states after the recombination of the electrons and the holes (Fig. 2-2). One is singlet excited state with spin symmetric excited electrons and the other is triplet excited state with spin-anti-symmetric electrons. According to theoretical speculation, the ratio of the singlet excited state to the triplet excited state caused by the recombination of the electric charge is 1 : 3. Therefore, only 25% of the energy can be used and the remaining 75% of the energy in the triplet excited state is lost through non-emitting mechanism or non-radiative decay at the use of small molecule fluorescent materials. So it is considered that the limit of internal quantum efficiency is 25%. But if we take the generation of singlet excitons by triplet-triplet annihilation into consideration, the internal quantum efficiency may be increased to 40%.
9
In Fig. 2-3, the electrons in the ground state and the singlet excited state are spin-anti-symmetry. The electrons in the triplet excited are spin-symmetry. According to Hund’s Rule, it will be more stable for the electrons in spin-symmetry, so the energy level of the triplet excited state is lower. The transition of the electron from the triplet excited to the ground state will produce a pair of electrons with the same spin orientation, so is not compatible with Pauli Exclusion Principle. The electron cannot transit smoothly to the ground state since the violation of Pauli Exclusion Principle, and then the lifetime would become longer.
10
2-3 Charge transfer in organic molecules
Unlike the inorganic semiconductor or crystalline materials, the organic semiconductor is amorphous and doesn’t have extended energy band. There are always delocalized π electrons in the organic semiconductor structure. These electrons in organic semiconductor are freer compared to the ones in the inorganic and crystalline materials, but they are confined in the molecule. Therefore, the hopping theory is the most commonly used for describing the charge transfer between the organic molecules[10]. When the organic semiconductor is driven by the electric field or pumped by the laser, the electrons will be excited to the LUMO level, and jump to another LUMO level as shown in Fig 2-4.
11
2-4 Light emitting mechanisms
Currently, the structure of the host emitter (main material) and guest emitter (dopant) system[11, 12] is widely being used in organic material device. That is, to dope the guest emitter in the host emitter and the organic semiconductor will emit the light when the host emitter with higher energy transfers the energy to the guest emitter. We can choose the emitting color and raise the device efficiency by changing different guest emitters. There are two emitting mechanisms: (1) energy transfer (2) carrier trapping
2-4.1 Energy transfer
When the electron in the excited state gives the energy to the one in low energy level, this process is called energy-transfer. Energy transfer mechanism often happens in multi-component doping system and can be classified into radiative and non-radiative. The host emitter in high energy level can transfer energy to guest emitter in low energy level. We can change the fluorescence color by doping some guest emitter.
Radiative energy transfer is related to the energy transfer rate, the quantum efficiency of the host, the concentration of the guest etc. This mechanism causes the total fluorescence quantum efficiency drops, so it should be avoided. The other is non-radiative energy transfer. There are two ways (Fig. 2-3) of non-radiative energy transfer: (1) Förster energy transfer. It transfers energy by the interaction of long distance dipole-dipole. If the radiation of the host and the absorption of the guest can overlap, the Förster energy transfer can be done. (2) Dexter energy transfer. It transfers energy by the exchange of short distance electrons. It should follow the Wigner-Witmer[13] selection rules when the electrons are transferring, that is, the spin orientation should be the same after the transfer. So Dexter energy transfer only
12
occurs between singlet state to singlet state and triplet state to triplet state. Since Dexter energy transfer only occurs between adjoining molecules, the procedure is relatively slow. By these two energy transfer mechanism, the energy can be transferred to the singlet and triplet excited state of the guest emitter. The energy at the singlet excited state can be transferred to the triplet excited state via ISC rapidly and emit the phosphorescence. Therefore, the internal quantum efficiency is possible to nearly be 100%[14]
13
2-4.2 Carrier trapping
The energy can be transferred not only by the energy transfer from the host emitter to the guest emitter but also by carrier trapping to excite the guest emitter. That is, the electrons and holes recombine on the guest emitter and make a form of Frenkel excitons which representing the electrons and hole are in the same molecule, and then the guest emitter will emit the light. This mechanism will take place when the bandgap of the host emitter is larger than the guest emitter and the HOMO and LUMO of the guest should be included in the ones of the host emitter. If the bandgap of the host is too large for the electrons and holes to inject into, the carriers will directly inject into the guest emitter and have a recombination to emit light[15-21]. If either the HOMO or LUMO of the guest emitter is included in the ones of the host emitter, the emitting should depend on whether the Frenkel excitons of the guest are in the lower energy state or not. If they are, the guest will emit the light, or it will be difficult to emit the light because they form an electron-hole pair between the host and the guest.
Carrier trapping and energy transfer both exist at the same time and which one will be the major emitting mechanism depends on the different situations. Generally speaking, in the high doping concentration or low current density conditions, the carrier trapping would be the major emission mechanism.
14
2-5 The Purcell factor
The enhancement of spontaneous emission rates of molecules when they are matched in a resonant cavity was first observed by Purcell 50 years ago[1]. The spontaneous emission (SE) rate of radiating dipoles depends on the environment light source. This means that using a cavity modifies the dipole-field coupling and the density of available photon modes can modify the spontaneous emission rate. This concept is now well-established due to the large quantity of research on cavity quantum electrodynamics (CQED)[22, 23], and its applications for optoelectronics has been widely used. Many kinds of microcavities which have an ability of three-dimensional photon confinement have been developed since 1990s and a lot of these microcavities are capable of generating strong spontaneous emission rate (Purcell effect). Microcavities need a good emitter which is spectrally narrower than the resonant mode of the cavities, otherwise the magnitude of the Purcell effect will be weakened.
2-5.1 The expression of the Purcell factor
[24]In this section, we will briefly derive the formula of the Purcell factor of a cavity, and describe the physical significance. First, we suppose a single localized radiating dipole which is weakly coupled to the field and placed in a monomode cavity. And we assume that the emitter is placed in a medium of refractive index n. We can suppose that the dipole sees continuous modes if the dipole emission line is narrower spectrally than the cavity resonant mode. And then, we can calculate the spontaneous emission rate by the Fermi Golden Rule. The transition rate for an electric dipole can be written as
eq. (1)
15
is the electric field operator, is the location of the emitter. The emitter sees the averaging of the squared dipolar matrix element performed over the various modes. The electric field operator for the cavity mode is
eq. (2)
where h.c. is Hermitian conjugate, is the photon creation operator and is the mode spatial function. is normalized so that its norm at the antinode of the electric field is unity and it is a complex vector which follows Maxwell equations and describes the local field polarization and relative field amplitude. , which is called numerical prefactor or maximum field per photon, can be estimated by expressing that the vacuum-field energy is for each mode
eq. (3)
where n is the refractive index at the maximum of the field, is the effective cavity volume that implies the efficiency of the cavity concentrating the electromagnetic field in a limited space. It is more precisely to say that is the volume of hypothetic cavity, defined by Born–Von Karman periodic boundary conditions, and would provide the same maximum field per photon as the cavity under study. The maximum field per photon is given by equation (4), for each mode, provided that is replaced by a normalization volume V.
There are three ways of changing the cavity’s spontaneous rate when inserting the radiating dipole inside the cavity: (1) The spectral density of modes. (2) The amplitude of the vacuum field. (3) The orientation with respect to the radiating dipole. All three of the above are modified. And then, the following evaluations will depend on the resulting change of the SE rate for a cavity which supports a single-mode of angular frequency , linewidth , and quality factor .So the mode
16
density seen by the emitter is given by a normalized Lorentzian
and
eq. (4)
while the “free-space” mode density can be written as
eq. (5)
The ratio of the spontaneous emission rate enhancement of the cavity to the free space is eq. (6)
where describes the orientation matching of and , and the factor 3 is originated from a averaging factor of 1/3 which stands for the random polarization of free-space modes with respect to the dipole.
However the first term ( , ) is only related to the cavity itself. The others, which are smaller than 1, are related to the emitter/mode spectral detuning, the relative field amplitude at the emitter’s location, and the orientation matching of the transition dipole and electric field. For the purpose of finding an expression for the cavity alone, the emitter can be assumed as an ideal emitter, whose properties are allowed to maximize the magnitude of the Purcell effect. So this ideal emitter has to be: (1) perfectly matched spectrally with the cavity mode, that is , (2) located at a maximum of the electric field, (3) with its dipole aligned with the local electric field. Based on the above conditions, the expression proposed by Purcell is
17
Chapter 3 Experimental setup and samples
3-1 Time-Resolved Photoluminescence (TRPL) System
Nowadays, fluorescence spectroscopic investigations are very common, and the temporal evolution of the laser induced fluorescence can provide various important information on dynamics of radiative relaxation. Time-correlated single photon counting (TCSPC) technique has been widely used to study the radiative lifetime of laser induced fluorescence. Although time-resolved fluorescence spectroscopy is a powerful analysis tool in sciences, it is a challenge to record its fast decay time which lasts hundred picoseconds to tens of nanoseconds. In order to recover fluorescence lifetimes as short as 300 ps, one must be able to resolve the exponential decay by tens of sampling steps. This means the transient recorder required to sample at 30 ps time steps. And it is a hard task to achieve with ordinary electronic transient recorder. In addition, the fluorescence intensity can be too weak to sample an analog temporal decay. One of the solutions for these problems is TCSPC technique. Since with periodic excitation, it is possible to extend the data collection over multiple cycle and one can reconstruct the single cycle decay profile from single photon events collected over many cycles. By setting the count rate small enough than the repetitive excitation source from the laser, TCSPC measures the time difference between the single pulses from the trigger that is synchronized with excitation signals in the single photoelectron state as shown in Fig. 3-3. In a single cycle, the timing electronics will record the single photon and the time delay with the trigger pulse. After multiple cycles, we can get the probability distribution of photons related to delay time as shown in Fig 3-1. For TRPL measurement, a picosecond pulsed diode laser which emits light pulses as short as 70 ps at repetition rates from single shot up to 80 MHz with peak powers up to 1 Watt was used.
18
3-1.1 The principle of Time-Correlated Single Photon Counting
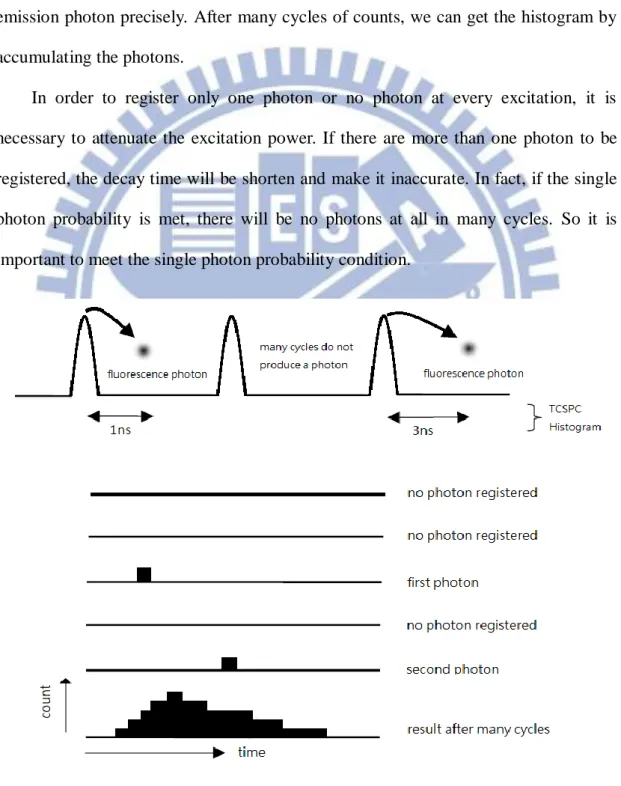
The working principle of TCSPC is based on the repetitive recording a fluorescence photon when it was excited by the laser pulse. Fig. 3-1 shows how the histogram is formed over many cycles. We should use the pulsed laser to excite a fluorescence photon and measure the time difference between excitation pulse and emission photon precisely. After many cycles of counts, we can get the histogram by accumulating the photons.
In order to register only one photon or no photon at every excitation, it is necessary to attenuate the excitation power. If there are more than one photon to be registered, the decay time will be shorten and make it inaccurate. In fact, if the single photon probability is met, there will be no photons at all in many cycles. So it is important to meet the single photon probability condition.
19
3-1.2 Principles behind PicoHarp 300
Our time-resolved PL measurement was performed using the commercial TCSPC system, so called, PicoHarp 300. Figure 3-2 is the building blocks of PicoHarp 300, in which the signal is fed into the constant fraction discriminator (CFD). CFD has some important function in PicoHarp 300: (1) It can extract precise timing information from the electrical detector pulses that may vary in amplitude. (2) The overall system Instrument Response Function (IRF) may be tuned to become narrower for improving the resolution and some of the random background signal can be suppressed. The same could not be achieved with a simple comparator. (3) Pulses originating from random electrons generated at the dynode of the PMT can be suppressed. Therefore, CFD can recognize the laser pulses as well as photon signal pulse and extract precise timing information. Similar to the detector signal, the sync signal must be made available to the timing circuitry. Since the sync pulses are usually of well-defined amplitude and shape, a simple settable level trigger (comparator) is enough to adapt to different sync sources. The signals from CFD and sync trigger are fed to a Time to Amplitude Converter (TAC). The result is a voltage proportional to the time difference between the two signals. The voltage obtained from TAC is then fed to an Analog to Digital Converter (ADC) which provides the digital timing value to histogrammer.
20
Fig. 3-2 Building blocks of PicoHarp 300.
3-1.3 Experimental Setup for TPRL measurement with TCSPC
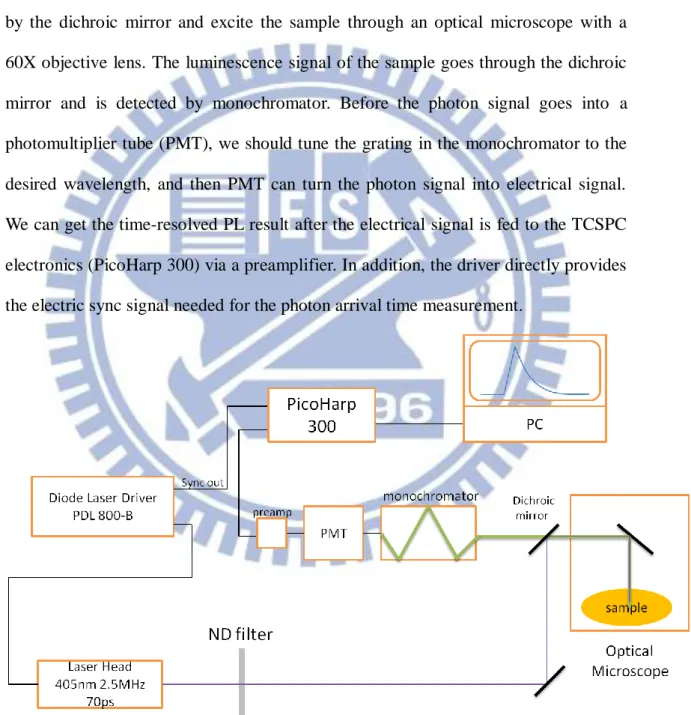
Figure 3-3 shows the schematic arrangement of TRPL measurement system with TCSPC. The central wavelength of the laser head is 405nm and the repetition rate and pulse width are 2.5 MHz and 70 ps, respectively. The pump laser pulses are reflected by the dichroic mirror and excite the sample through an optical microscope with a 60X objective lens. The luminescence signal of the sample goes through the dichroic mirror and is detected by monochromator. Before the photon signal goes into a photomultiplier tube (PMT), we should tune the grating in the monochromator to the desired wavelength, and then PMT can turn the photon signal into electrical signal. We can get the time-resolved PL result after the electrical signal is fed to the TCSPC electronics (PicoHarp 300) via a preamplifier. In addition, the driver directly provides the electric sync signal needed for the photon arrival time measurement.
21
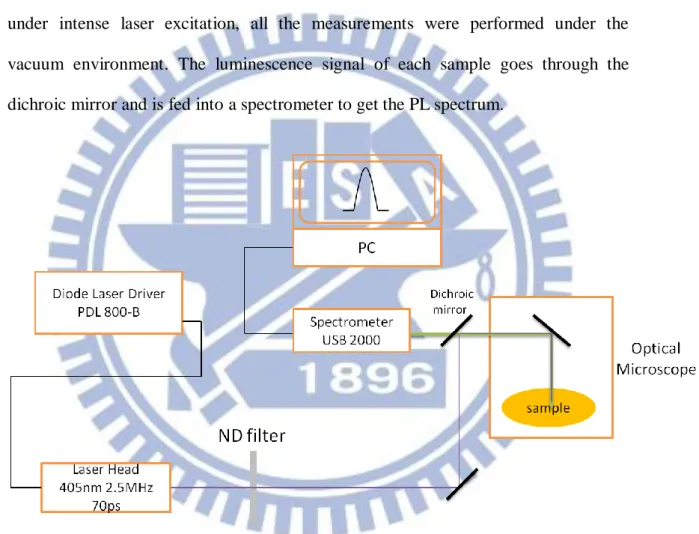
3-1.4 Experimental Setup for micro-PL measurement
The experimental setup for micro-PL measurement is shown in Fig. 3-4. It is similar to the schematic experimental arrangement of TPRL measurement with TCSPC, but here the time-integrated PL is measured by a spectrometer. For micro-PL measurement, either continuous (CW) or pulsed light source can be used as excitation source. Since the organic materials used in this study are highly reactive with air under intense laser excitation, all the measurements were performed under the vacuum environment. The luminescence signal of each sample goes through the dichroic mirror and is fed into a spectrometer to get the PL spectrum.
22
3-2 Organic Dyes
3-2.1 DCM
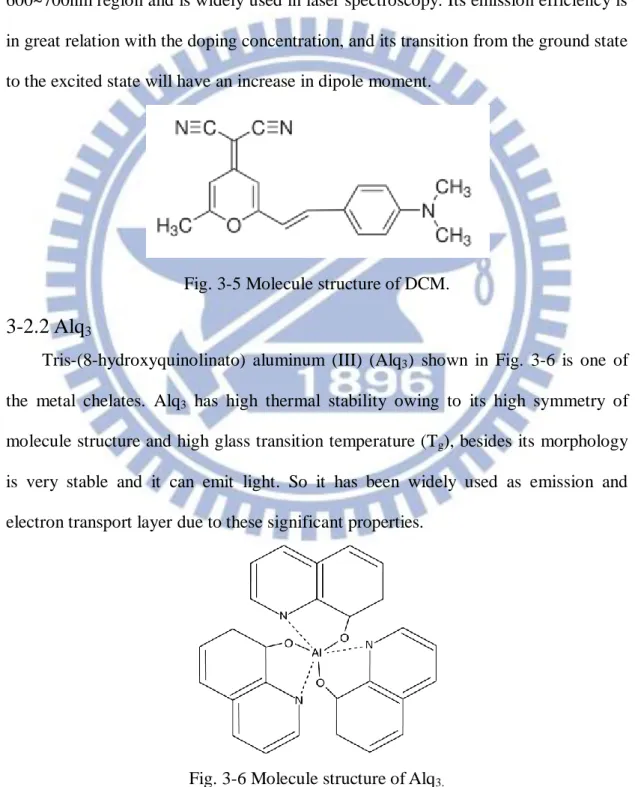
4-(Dicyanomethylene)-2-methyl-6-(4-dimethylaminostyryl)-4H-pyran (DCM), shown in Fig. 3-5 is known as one of the best laser dyes in the red emission field. It is often used as a dopant in the host-guest system. It has a great effectiveness in 600~700nm region and is widely used in laser spectroscopy. Its emission efficiency is in great relation with the doping concentration, and its transition from the ground state to the excited state will have an increase in dipole moment.
Fig. 3-5 Molecule structure of DCM.
3-2.2 Alq
3Tris-(8-hydroxyquinolinato) aluminum (III) (Alq3) shown in Fig. 3-6 is one of
the metal chelates. Alq3 has high thermal stability owing to its high symmetry of
molecule structure and high glass transition temperature (Tg), besides its morphology
is very stable and it can emit light. So it has been widely used as emission and electron transport layer due to these significant properties.
23
3-2.3 BAlq
Bis (2-methyl-8-quinolinato)-4-phenylphenolate aluminum (III) (BAlq) shown in Fig. 3-7 is usually used as the exciton-blocking layer between the emissive layer in phosphorescent light-emitting devices to prevent the long lifetime excitons in the triplet excited state diffuse to the electron transport layer.
Fig. 3-7 Molecule structure of BAlq.
3-2.4 Znq
Bis (8-hydroxyquinoline) zinc (II) (Znq) is one of the metal chelates shown in Fig. 3-8 and is used as emission and electron transport layer. It is a highly luminescent and electroluminescent material and has shown advantages over Alq3 in electron
transport and shown higher quantum yields in device performance. So it has lower operating voltages than Alq3.
24
3-3 Sample preparation
For this study, three different dyes of Znq:DCM (2.5%), BAlq:DCM (2.5%), and Alq3:DCM (2.5%) grown on mica, and Alq3:DCM grown on SOG which covered the
gold nanoplates were prepared. Znq, BAlq, Alq3 are the host emitter while DCM is
the guest emitter. All the organic samples were prepared by Prof. Djurisic, Aleksandra’s lab in Hong Kong University. Table 3-1 is the symbol assignment of four samples. Samples A B C D Znq:DCM on mica BAlq:DCM on mica Alq3:DCM on mica Alq3:DCM on SOG Table 3-1 Symbol assignment of four samples.
3-3.1 Samples on mica
Sample A, B, and C were grown on mica substrate and all of them had the same structures as shown in Fig. 3-9. As for the organic layers, they were deposited by co-doping technique in a thermal evaporator. The gold and SiO2 layer were deposited
by e-beam evaporation. The organic layer is 150nm of thickness. The gold film is 50nm of thickness, and SiO2 buffer layer between the organic dye and SiO2 protect
layer over the organic dye are 5nm of thickness.
25
3-3.2 Sample on SOG
The sample with the dye of Alq3:DCM(2.5%) was positioned on the SOG, which
is 5nm of thickness and covered the gold nanoplates, as shown in Fig. 3-10(b). The organic layer was deposited by co-evaporation technique. The average length of the gold nanoplates is about 10μm (Fig. 3-10(a)). The organic layer is 170nm of thickness. The protect layer SiO2 over the organic dye is 20nm of thickness. The three silver bars
for orientation are 50nm of thickness. (a)
(b)
26
Chapter 4 Result and discussion
4-1 Power dependence of photoluminescence
We measured the PL spectra and TRPL under different pump fluence from 4.02 kW/cm2 to 80.46 kW/cm2. The PL peak intensities of the four samples with gold and without gold show the linear relations to the excitation power as shown in Fig. 4-1, 4-2, 4-3, and 4-4, indicating that there is no thermal heating effect on the samples due to the excess pump fluence or amplified spontaneous emission (ASE) phenomenon. As the pump fluences increase, the samples with gold film have a lager slope than the ones without gold film, and the change of slope implies that the samples are under the surface plasmon resonance of gold. The slopes of the samples without and with gold are changed from 14.6, 17.5, and 28.5 to 30.6, 25.2, and 30.7 for sample A, B, and C respectively. For sample D, the slope changes of the first and the second peaks are 6.8 to 16.3 and 4.2 to 13.6, respectively. The ratios of the two slopes for sample A, B, and C are 2.1, 1.4, and 1.1, respectively, and those for the first and second peak of sample D are 2.4 and 3.3. The largest change in slope for sample D indicates that sample D has the largest PL enhancement resulting from surface plasmon coupling with gold film, especially the second peak of sample D.
Samples C and D contain the same organic material, but sample D shows a larger slope change than sample C. This result shows that the slope change is not related to the PL enhancement ratio, but is related to the metal structure of surface plasmon resonance and will be discussed later.
27
Fig. 4-1 PL peak intensity against pump fluence of sample A.
28
Fig. 4-3 PL peak intensity against pump fluence of sample C.
Fig. 4-4 PL peak intensity against pump fluence of sample D (a) first peak, (b) second peak.
29
When the carrier recombination process in organic layer starts, the energy from the carrier recombination process will generate photons, moreover, for the sample that is coated with metal, if the interaction of photons and the surface plasmons matches the Momentum Conservation Principle condition, the photons will be absorbed by the surface plasmons and exist in the form of surface plasmon polaritons. That is, the energy of the external electromagnetic field will be absorbed by surface plasmon, resulting in the electromagnetic enhancement of the resonance-influenced area. After the surface plasmon resonance, the enhanced surface plasmons can be turned into photons as light when matching the Momentum Conservation Principle again. So there are two ways to generate the photons when coupling with the metal and comes out the PL enhancement. So the emission enhancement of the organic dye on gold film can be attributed to excited organic dye molecules coupling to the electron vibration energy of surface plasmon. As shown in Fig. 4-5, a surface plasmon is produced during the molecular relaxation process and leads to an increase in the spontaneous recombination rate. Excitons are generated in organic layer by optical- or electrical-excitation. For the sample that is not coated with metal, theses excitons are terminated by the radiative or nonradiative recombination rates. For
the sample that is coated with metal, when the bandgap energy ( ) of organic dye is close to the electron vibration energy of surface plasmon ( at the
metal-semiconducting interface, the energy can transfer to the surface plasmon with surface plasmon coupling rate ( . PL decay rates are enhanced by surface plasmon coupling rate, as values are expected to be very fast.
Large density of states from the surface plasmon dispersion diagram shown in Fig. 4-6 introduces high electromagnetic fields and increases . In this figure, surface plasmon enhancement method can be applied in the range of visible to ultraviolet depending on the metal chosen, where aluminum is for UV, silver for the
30
blue region, and gold for the red region. We chose the gold for surface plasmon enhancement because the surface plasmon resonance wavelength of gold ranges from about 500nm to 700nm so that is suited for the PL wavelength range of our samples. If the metal surface is perfectly flat, the surface plasmon energy will dissipate thermally because the plasmon wave is a nonpropagating evanescent wave. So by providing rough or nanostructure metal layer allows the SP energy be extracted as light and make SPs of high momentum to scatter, lose momentum, and couple to radiative light[25].
Fig. 4-5 Physical mechanism of the electron-hole recombination and surface plasmon coupling.
Fig. 4-6 Surface plasmon dispersion diagram[26], interfaced with Au (dash line), Ag (solid line), and Al (dotted line).
31
The main peak originated from the host emitter and a shoulder (side peak) locates at 628nm on the PL spectra are illustrated in Fig. 4-7, 4-8, 4-9, and 4-10. Except sample D, the second peak of which is enhanced by the surface plasmon resonance, the PL spectra of samples A, B, and C increase uniformly over the whole wavelength. The main PL peak and the shoulder peak at 628nm may be attributed to the intermolecule and intramolecule emission branching[27]. Intramolecule singlet excitons can be generated by the absorption of photons or the carrier injection followed by electron-hole pair formation on a single molecule; and the intermolecule excitation can be formed by resonantly interacting between two molecules in different sites. So the first emission peak of the PL spectra is the intramolecule process of the host materials and the second peak is due to the intermolecule process of the energy transfer mechanism from the host emitter to DCM. Two different molecules, one neutral and the other in the excited state, can form an intermolecule excitation as an excimer. Excimer shows a long radiative lifetime, which is because the transition from the excimer state to the ground state is usually forbidden by symmetry, and this is consistent with the TRPL measurement for sample D (see Fig. 4-30). Because of the SPR, we could observe the red shift of the PL spectrum with respect to the center wavelength of the host dyes. The shift range of the main peak are from 555nm to 560nm, and 591nm to 600nm for samples A and D respectively, but samples B and C do not show red shift at the main peak because the main peak at 490nm for sample B is not in the surface plasmon resonance wavelength of gold and sample C does not show much enhancement by surface plasmon resonance. The shift of spectra is clearer for PL spectra measured with and without gold as shown in Fig. 4-15 to 4-18.
32
Fig. 4-7 Power-dependent PL of sample A (a) without gold film, (b) with gold film.
628nm
33
Fig. 4-8 Power-dependent PL of sample B (a) without gold film, (b) with gold film.
628nm 628nm
34
Fig. 4-9 Power-dependent PL of sample C (a) without gold film, (b) with gold film.
628nm
35
Fig. 4-10 Power-dependent PL of sample D (a) without gold nanoplates, (b) with gold nanoplates.
36
The PL enhancement ratio as a function of pump fluence is plotted in Fig. 4-11 to 4-14 for samples A-D. It can be observed that the enhancement ratios of all the samples start to get saturated at pump fluence of ~48 kW/cm2. And the results in the following sections are measured under this saturation pump fluence. While sample C shows nearly no enhancement, sample B shows a large enhancement at 550 nm, instead of its main peaks at 490nm. Sample D not only shows the largest overall enhancement, but also has a large enhancement at its second peak (shoulder) rather than at its main peak. The difference of the enhancement ratio between sample C and D is attributed to the structure of the metal[28]. For small nanostructure such as nanorods or nanoparticles, which have the diameter or side length shorter than 500nm, the scattering cross sections are small due to the smaller volumes in these kinds of structures, so that the surface plasmon coupling is not significant. But for the case of large nanocrystals such as hexagonal or triangular plates (500nm~few μm of side length), it is necessary to mainly concern the wavevector matching condition of plasmons in gold structure and the scattered photons. However, the surface plasmon energy can be extracted as light only when appropriate wavevector matching conditions are met. Compared with individual gold nanostructures with finite sizes, the wavevector matching condition of plasmons with outcoupling photons in continuous gold structures (gold film) is more stringent. Thus in the coupling with Alq3:DCM dye, the gold nanoplates (about 5~10μm of side length) structure shows
the better wavevector matching condition than the gold film resulting in a higher enhancement ratio and a larger scattering cross section although the nanoplates are much smaller than film.
According to the measurement results of sample C and the description above, Alq3:DCM dye may not have apparent surface plasmon enhancement coupling with
37
second peak increases considerably, while the shoulder peak of samples A, B, and C does not show obviously sharp peak after the enhancement by the surface plasmon resonance (Fig. 4-18). So we can suppose that the intermolecule process of sample D gets larger surface plasmon resonance enhancement coupling with gold nanoplates.
Fig. 4-11 Enhancement ratio against pump fluence of sample A.
38
Fig. 4-13 Enhancement ratio against pump fluence of sample C.
Fig. 4-14 Enhancement ratio against pump fluence of sample D (a) first peak, (b) second peak.
Fig. 4-15, 4-16, 4-17, and 4-18 show the PL spectra of dyes measured with gold and without gold at pump fluence of 48 kW/cm2. Samples A, B, and D have the considerable enhancement at the main PL peak while PL enhancement of sample B occurs at 550nm. The PL enhancements by surface plasmon resonance are 1.81 times, 1.34 times, and 1.87 times (first peak) 2.15 times (second peak) for sample A, B, and
39
D respectively. For sample C, however, there is only 1.06 times of enhancement at the main PL peak. The PL spectra of sample A, C, and D cover the spectral range from 500nm to 700nm while that of sample B covers from 400nm to 700nm. The PL enhancement of sample B starts from 510nm, the middle of the spectrum (Fig. 4-16), so there is nearly no enhancement at the first half of sample B and the enhancement occurs at the latter half of the spectrum. Besides, sample A and sample D also get the overall enhancement start from ~500 nm and it is in agreement with the surface plasmon resonance wavelength of gold and the surface plasmon dispersion diagram (Fig. 4-6). These results suggest that the enhancement is due to the surface plasmon resonance coupled with gold.
It is very interesting that the sample B has a large enhancement at 550nm instead of the overall enhancement. The lifetime of sample B is at the order of nanoseconds implying that this peak cannot be the phosphorescence because the lifetime of the phosphorescence is usually a few microseconds or even milliseconds. As a matter of fact, the enhancement ratio of sample B is similar to those of other samples that follow the process of being enhanced gradually from the beginning and then reached to the maximum enhancement point and then gradually decayed to the original state. That is, the spectral ranges of the other three samples match gold’s surface plasmon resonance wavelength so that get the overall enhancement. But for sample B, the enhancement of sample B is limited by the gold’s surface plasmon resonance wavelength ranging from about 510nm to 700nm, and the maximum enhancement point of gold is located at nearly 550nm. So sample B is enhanced just from the middle of its spectrum not from the beginning (400nm), leading us to think that there is a sudden enhancement appears at 550nm.
40
Fig. 4-15 PL spectra comparisons of dyes with gold and without gold of sample A at pump fluence 48 kW/cm2.
Fig. 4-16 PL spectra comparisons of dyes with gold and without gold of sample B at pump fluence 48 kW/cm2.
41
Fig. 4-17 PL spectra comparisons of dyes with gold and without gold of sample C at pump fluence 48 kW/cm2.
Fig. 4-18 PL spectra comparisons of dyes with gold and without gold of sample D at pump fluence 48 kW/cm2.
42
The enhancement ratio and the peak shift of PL excited by a continuous (CW) laser are far different from those excited by a pulse laser, as shown in Fig. 4-19, 4-20, 4-21, and 4-22. There are at least 2.2 times of PL enhancements for sample A, B, and D at the main PL peak, while enhancement in sample B by the surface plasmon resonance occurs at 550nm. The PL enhancements by surface plasmon resonance are 8 times, 2.2 times, and 6 times for sample A, B, and D respectively. Sample C, which gets nearly no enhancement in pulsed laser measurement, shows ~1.2 times of enhancement at the main peak in CW measurement. Although the spectral dependence is similar, SPR induced PL enhancement is more significant under CW laser excitation..
Surface plasmon-induced enhancement under the CW pump leads to the shift of the spectra. Sample D shows the red shift as much as ~30 nm, but sample A shows slight blue shift. Meanwhile, samples B and C do not show any peak shift at the main peak since the spectra is not influenced by the surface plasmon resonance of gold.
Fig. 4-19 PL spectra comparisons of dyes with gold and without gold of sample A measured by CW 405nm diode laser. (From Prof. S. Gwo’s lab in National Tsing Hua University.)
43
Fig. 4-20 PL spectra comparisons of dyes with gold and without gold of sample B measured by CW 405nm diode laser. (From Prof. S. Gwo’s lab in National Tsing Hua University.)
Fig. 4-21 PL spectra comparisons of dyes with gold and without gold of sample C measured by CW 405nm diode laser. (From Prof. S. Gwo’s lab in National Tsing Hua University.)
44
Fig. 4-22 PL spectra comparisons of dyes with gold and without gold of sample D measured by CW 405nm diode laser. (From Prof. S. Gwo’s lab in National Tsing Hua University.)
45
In order to understand the emission dynamics, we measured the time-resolved PL of each sample. Fig. 4-23, 4-24, 4-25, and 4-26 illustrate the results of TRPL of samples A, B, C, and D measured at different pump intensity. There were two slopes of the decay paths, which indicated that the effective lifetimes was determined by double exponential fitting, , where and and
and represent the PL intensities and decay time constants of the fast and
slow components, respectively. While PL signals of samples A, B, and C undergo double exponential decays, that of sample D shows a single exponential decay curve, .
At low pump fluences, PL signals of sample A, B, and C without gold film decay with a single time constant. As the pump fluence increases, double exponential decay becomes obvious. For samples A and B with gold film, PL signals show two-step decay for all pump fluence, but that of sample C with does not change the radiative decay path. Figures 4-23, 4-24, 4-25, and 4-26 show that the fast decay paths of samples A and B with gold film show much steeper slope than the ones without gold film and it implies that the decay lifetime become faster due to the Purcell effect. But for samples C and D, the changes of the decay times are not obvious because sample C does not get much surface plasmon enhancement and sample D has exhibited fast decay rates (see Fig. 4-30) so that is not strongly affected by the Purcell effect, although the PL of sample D is enhanced by surface plasmon resonance. So samples A and B show the stronger Purcell effect than samples C and D.
46
47
Fig. 4-24 TRPL measurement at 550nm of sample B (a) without gold film, (b) with gold film.
48
49
Fig. 4-26 TRPL measurement of sample D (a) first peak without gold nanoplates, (b) first peak with gold nanoplates, (c) second peak without gold nanoplates, (d) second peak with gold nanoplates.
50
The relation between the power and the time constants is shown in Fig. 4-27, 4-28, 4-29, and 4-30. The excitation power and the decay time are in linear relationship, implying that the high pump fluence can make the recombination rate increase. No saturation at high pump power indicates no heating phenomenon on the samples due to the excess pump fluence or amplified spontaneous emission phenomenon.
In the figures, the black lines with triangles are for samples without gold and the red lines with circles correspond to samples with gold, and the time constants of fast and slow decays are clearly separated. For all samples with or without gold film, the slow decay has the time constants of the order of tens of ns. For the fast decay parts, the time constants are of the order of 1 or 2 ns. For both fast and slow decay parts, the time constants with gold (red lines) are faster than those without gold. The range of the changes in time constant among sample A, B, and C is A>B>C and it is consistent with the PL enhancement. Although sample B shows the larger time constants than sample A, but the ratio of change in lifetimes is still smaller than sample A. Sample D changes a little in time constants due to its weak Purcell effect and is inconsistent with the PL enhancement as above mentioned.
51
Fig. 4-27 Time constant of power-dependent PL of sample A.
52
Fig. 4-29 Time constant of power-dependent PL of sample C.
53
In the TRPL measurement, the double exponential decay curve is related to the Förster energy transfer mechanism. When doping of a host emitter with a highly emissive guest emitter, Förster energy transfer can take place and result in transfer of the excited-state energy from the host to the guest and subsequent emission from the guest. The Förster energy transfer rate via induced dipole-dipole interactions between organic materials is given by[29]
eq. (1)
eq. (2)
where is the normalized fluorescence spectrum of the host material, is the normalized optical absorption cross section of the dopant, is the natural radiative lifetime of the host material, and is the mean distance between host and dopant molecules. For efficient energy transfer (i.e., for large) the overlap between and must be large, as in the case of Alq3 and DCM [Fig. 4-31 (a) and
(b)]. In Fig. 4-31 (c), the energy transfer process illustrates that the pump energy is absorbed by Alq3 molecule and is subsequently transfers to the DCM molecule. This
exciton then recombines and emits a photon.
In double exponential decay curve, the two lifetime components can be attributed to different physical processes[30]. The fast decay path represents the host molecule excitations in close proximity to the nearest guest molecules which nonradiatively (Förster-type) transfer their energy to them. The slow decay path may represent the host excitations that are further away from the guest molecules and, depending on the intermolecule distance between the host and guest molecules, either migrate within the host before being transferred to the guest or decay radiatively and/or nonradiatively. Both processes contribute to the energy transfer rate. The significant
54
contribution from the slow components to the total lifetime suggests that some excitations remain on the hosts and radiatively decay there, leading to the emission of the host. So this is consistent with the PL spectral (Figs. 4-7 to 4-9) that the main peaks originate from the host material and the shoulders or second peaks fixed at 628nm are due to the Förster energy transfer from the host to the guest.
Fig. 4-31 (a),(b) Absorption and PL spectra of Alq3 and DCM, respectively.
(c) Energy level diagram of Alq3:DCM.
The TRPL signals of samples A-D with and without gold film at pump fluence of 48.28 kW/cm2 are shown in Fig. 4-32, 4-33, 4-34, and 4-35. The degree of reduction in lifetime is sample A>B>D>C. The reduction in lifetime is due to the Purcell effect[31], and the Purcell factors of the four samples is determined by dividing the
on and off cavity (with or without gold)[32] and are shown in Table 4-1. We
observe that for sample A, B, and C, the Purcell factors are proportional to the PL enhancement, but for the sample D, it is not. This is because despite large PL enhancement, sample D initially has a fast decay rate without gold nanoplates so that
55
the lifetime is similar to the one coupled with surface plasmons[26], and does not show apparent reduction in lifetime. However, for the better electron transport material, Znq (sample A), the reduction in lifetime (Purcell effect) is more obvious.
Furthermore, for samples A, B, and C, the degree of the surface plasmon enhancement can be observed by the relative amplitude ratio of the fast and slow decay components and from the TRPL signals measured with and without the gold film. It should be noticed that whether the samples are with or without gold, the amplitude of the fast decay part is always larger than the amplitude of the slow decay part. In Fig. 4-32, 4-33, and 4-34, for sample A, the amplitude ratio is 4 times enhancement from 7 to 29.9; for sample B, the amplitude ratio is 3 times enhancement from 4.2 to 12.8; and for sample C, the amplitude ratio is nearly no enhancement. This result is also consistent with the enhancement degree that was previously discussed.
Samples Purcell factor
A(Znq:DCM on mica) 2
B(BAlq:DCM on mica) 1.6 (at 550nm)
C(Alq3:DCM on mica) 1.0
D(Alq3:DCM on SOG) 1.1 (both the first and the second peaks)
56
Fig. 4-32 The reduction in lifetime of sample A at pump fluence 48 kW/cm2.
Fig. 4-33 The reduction in lifetime at 550nm of sample B at pump fluence 48 kW/cm2.
57
Fig. 4-34 The reduction in lifetime of sample C at pump fluence 48 kW/cm2.
Fig. 4-35 The reduction in lifetime of sample D at pump fluence 48 kW/cm2 (a) first peak, (b) second peak .
58
4-2 Wavelength dependence of photoluminescence
Figures 4-36, 4-37, and 4-38 show the PL spectra and the PL lifetimes of samples A, B, and C measured with and without gold film plotted against the emission energy. For sample A with gold film, the lifetime gets shorter as the photon energy decreases from 2.6 to 2.0 eV. For sample B with gold film, the lifetimes show a rapid decline as E decreases from 2.5 to 2.25 eV, and then gradually decrease until E=1.8 eV. Here, the range of energy change is consistent with the surface plasmon resonance wavelength of gold, implying that they are enhanced by the surface plasmon resonance of gold. For sample C, the lifetimes with gold and without gold film do not show much change, indicating that PL of sample C is not enhanced by surface plasmon resonance.
In Fig. 4-39, the Purcell factor of sample A starts to increase at about 500 nm and reaches the maximum at about 560 nm and persists at ~2 until 615 nm. The Purcell factor of sample B starts to increase at about 520 nm and comes to the maximum at 550 nm. The Purcell factor of sample C maintains at about one. Purcell factor larger than 1 for samples A and B indicates that the PL enhancement is due to the surface plasmon resonance.
59
Fig. 4-36 Fast and slow time constants with PL spectrum of sample A (a) without gold film, (b) with gold film.
60
Fig. 4-37 Fast and slow time constants with PL spectrum of sample B. (a) without gold film, (b) with gold film.
61
Fig. 4-38 Fast and slow time constants with PL spectrum of sample C. (a) without gold film, (b) with gold film.
62
Fig. 4-39 Purcell factor against wavelength of sample A, B, and C.
In Fig. 4-36(a), 4-37(a), and 4-38(a), the fast decay radiative lifetime can be fitted by[33]
eq. (1)
where is the radiative lifetime, is the energy of the mobility edge, and represents the localization energy. Since we get the radiative lifetime, the
internal quantum efficiency can be obtained by the relation [26, 34]
eq. (2)
where is the radiative recombination rate, is the nonradiative
recombination rate, and PL lifetime is the inverse of the recombination rate (i.e. ). For the surface plasmon case, the Purcell factor can be
described by the enhanced efficiency and the internal quantum efficiency as below[35]
![Fig. 2-1 The emitting principle of the fluorescence and phosphorescence [8] .](https://thumb-ap.123doks.com/thumbv2/9libinfo/8527091.186910/16.892.138.758.399.1010/fig-emitting-principle-fluorescence-phosphorescence.webp)
![Fig. 2-2 Excited state after the recombination of the electrons and the holes [9] .](https://thumb-ap.123doks.com/thumbv2/9libinfo/8527091.186910/18.892.145.756.438.1054/fig-excited-state-recombination-electrons-holes.webp)
![Fig. 2-4 Electron transfer in organic semiconductor [8] .](https://thumb-ap.123doks.com/thumbv2/9libinfo/8527091.186910/20.892.138.754.346.1028/fig-electron-transfer-in-organic-semiconductor.webp)
![Fig. 2-5 Förster and Dexter energy-transfer mechanisms [14] .](https://thumb-ap.123doks.com/thumbv2/9libinfo/8527091.186910/22.892.141.759.353.1058/fig-förster-and-dexter-energy-transfer-mechanisms.webp)